Market Wrap: Stocks, Bonds, Commodities
The S&P 500 closed slightly lower after hitting a record intraday high on Tuesday, as a four-day rally lost steam in thin trading and investors weighed Omicron-driven travel disruptions and store closures.
The Dow Jones Industrial Average rose 95.83 points (0.26%) to 36,398.21, the S&P 500 lost 4.84 points (0.10%) to 4,786.35 and the Nasdaq Composite fell 89.54 points (0.56%) to 15,781.72.
MSCI’s index of Asia-Pacific stocks outside Japan loss 0.55% to 781.61 levels. Australian index rose 01.21% to 7,509.80. Japanese Nikkei Index lost 0.56% to 28,906.55.
European stocks were lower on Wednesday, with the Stoxx Europe 50 Index down 0.08% to 4,308.55, Germany’s DAX declined 0.13% to 15,943.60, and France’s CAC gained 0.16% to 7,192.41, and U.K.’s FTSE 100 down 0.09% to 7,451.74.
Benchmark 10-year U.S. Treasury rose as demand for safe assets fell again, today 10-year bond yields flat to 1.481.
US oil rose for the sixth consecutive session on Wednesday while Brent gained more ground with a broad-based rally in global markets supporting prices.
Spot Brent crude oil gained 0.27% to $78.88 per barrel. US West Texas Intermediate crude up 0.18% to $76.12 a barrel.
The yellow metal gold is lost 0.44% to 1,802.95 dollars per ounce.
Market Wrap: Forex
The dollar firmed slightly in early Asian trade on Wednesday as the recent stock market rally showed signs of petering out, but holiday-thinned trading meant markets were showing little real direction.
Today, the U.S. dollar index measures the greenback against a trade-weighted basket of six major currencies, which advanced 0.12% to 96.315.
The Euro US Dollar (EUR/USD) is a widely traded pair that is flat today. This left the pair trading around $1.12870.
The Japanese yen fell against the U.S. dollar on Wednesday as the stock pushes higher. Today US/JPY is rose 0.14% to 114.97 level.
Another commodity-related currency mixed against the U.S dollar, AUD/USD gained 0.06% to 0.72320, and NZD/USD down 0.21% to 0.67970 level.
EUR/USD Intraday: In a Consolidation Zone
Our pivot point is at 1.13220
Preferable Price Action: Take Short positions Below pivot level with targets at 1.12900 & 1.12680 in extension.
Alternative Price Action: Above pivot looks for a further Upside to 1.13530 & 1.13730.
Comment: Pair below 55MA & 20MA and RSI below 50 levels.
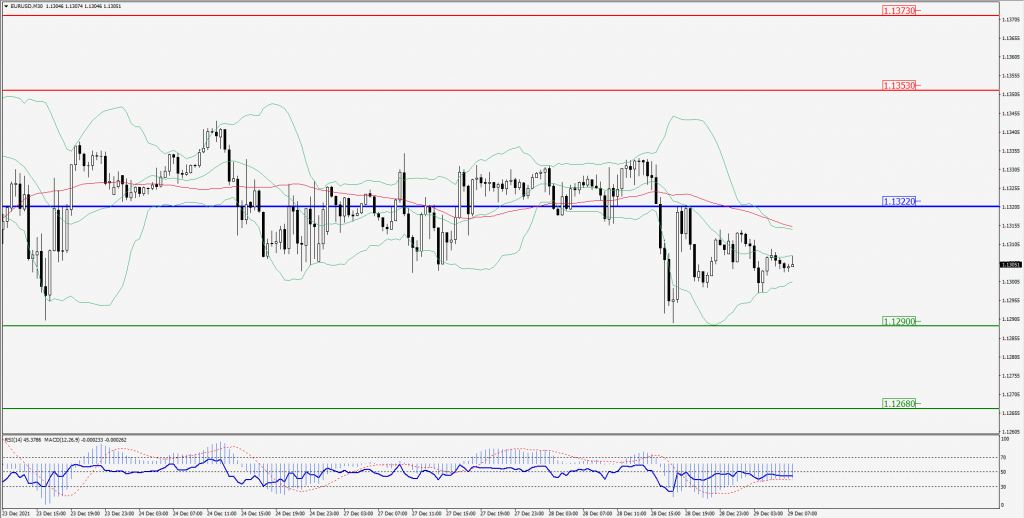
Green Lines Indicate Resistance Levels – Red Lines Indicates Support Levels
Light Blue is a Pivot Point – Black represents the price when the report was produced
GBP/USD Intraday: Trend may change from here
Our pivot point is at 1.34530
Preferable Price Action: Sell positions Below pivot with targets at 1.34130 & 1.33830 in extension.
Alternative Price Action: The price above pivot would call for further upside to 1.34880 & 1.35130.
Comment: Pair below its 55MA and RSI below 50 levels.
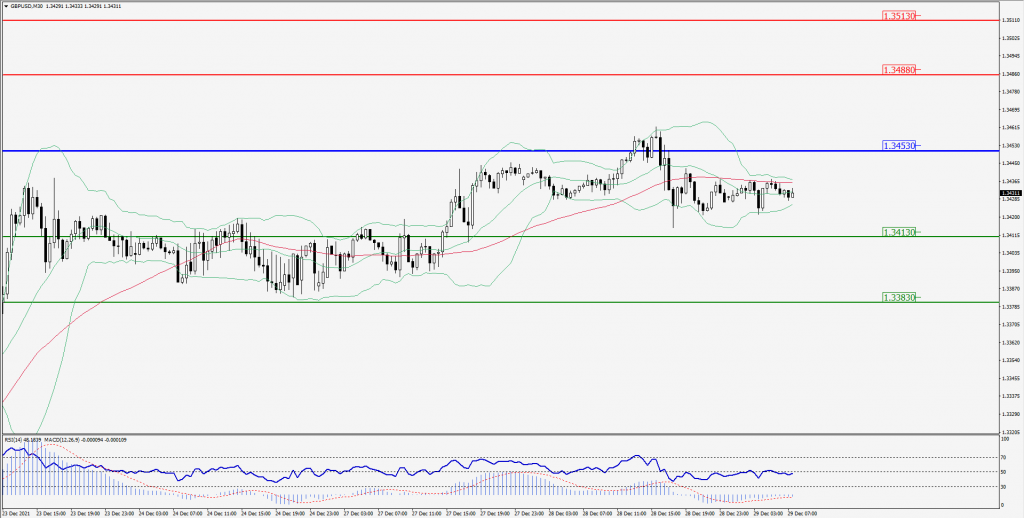
Green Lines Indicate Resistance Levels – Red Lines Indicates Support Levels
Light Blue is a Pivot Point – Black represents the price when the report was produced
USD/JPY Intraday: Trend on the upside
Our pivot point is at 114.760
Preferable Price Action: Buy position Above pivot with the target at 115.030 and 115.190 in extension.
Alternative Price Action: The Downside breakout of the pivot would call for 114.500 and 114.330.
Comment: Price above its 55MA & 20MA and MACD in positive territory.
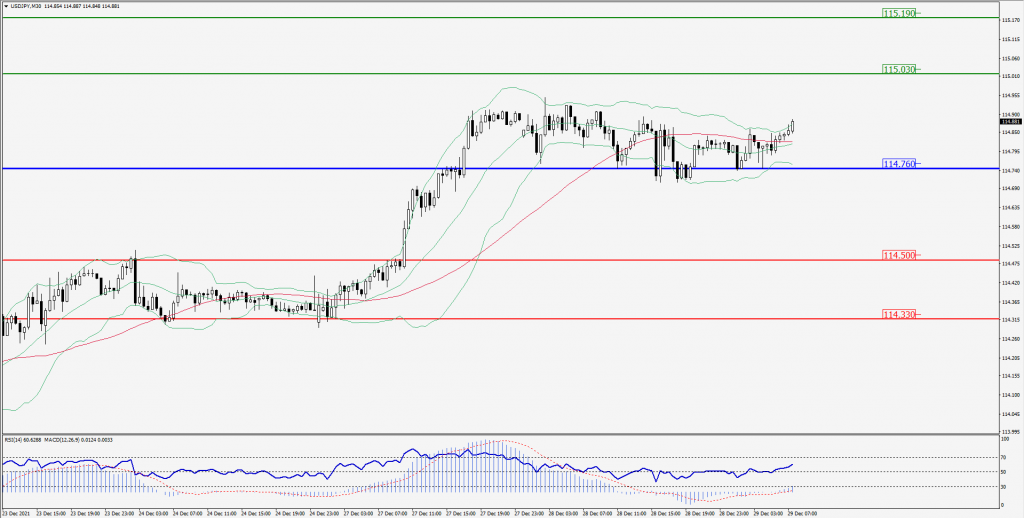
Green Lines Indicate Resistance Levels – Red Lines Indicates Support Levels
Light Blue is a Pivot Point – Black represents the price when the report was produced
AUD/USD Intraday: In a Consolidation Zone
Our pivot point is at 0.72430
Preferable Price Action: Sell Positions Below pivot with targets at 0.72170 & 0.72030 in extension.
Alternative Price Action: Above pivot looks for a further upside with 0.72660 & 0.72790 as targets.
Comment: Pair below 55MA and RSI at 50 levels.
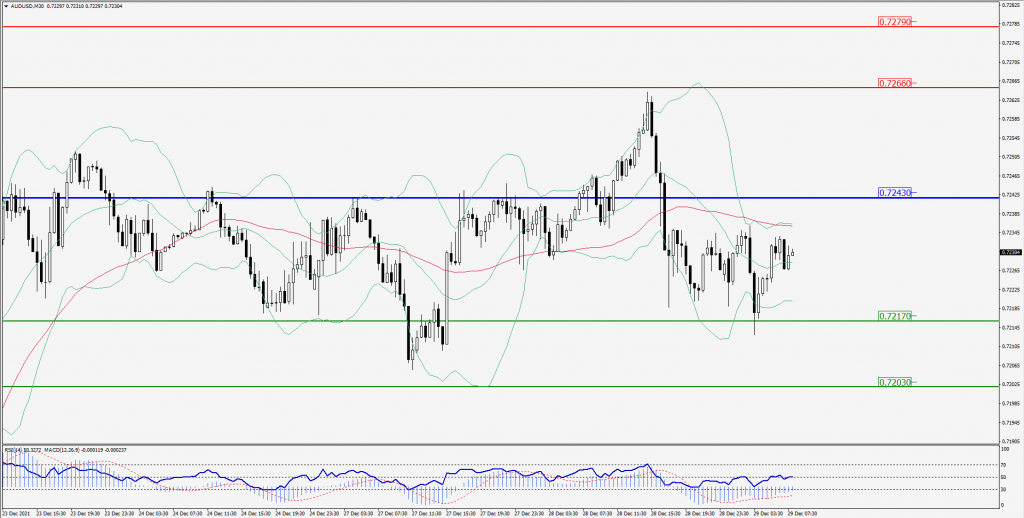
Green Lines Indicate Resistance Levels – Red Lines Indicates Support Levels
Light Blue is a Pivot Point – Black represents the price when the report was produced
CRUDEOIL Intraday: Trend on the upside
Our pivot point is at 75.06
Preferable Price Action: Above pivots Buy Oil with 77.67 & 79.27 as targets.
Alternative Price Action: Sell crude Below pivot with targets at 72.59 and 70.86 in extension.
Comment: MACD is in the positive territory.
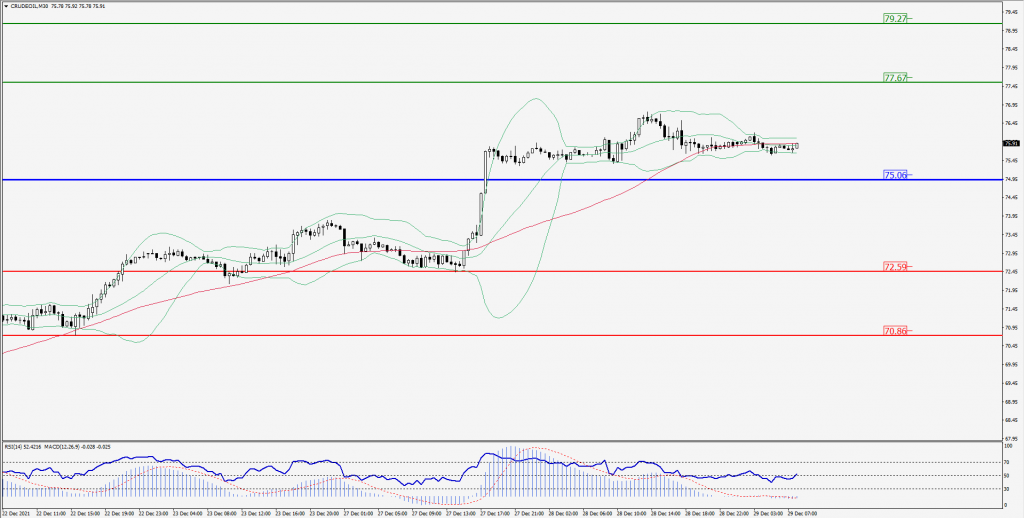
Green Lines Indicate Resistance Levels – Red Lines Indicates Support Levels
Light Blue is a Pivot Point – Black represents the price when the report was produced
XAU/USD Intraday: Break Resistance levels
Our pivot point is 1813.00
Preferable Price Action: Further Downside to 1798.70 and 1792.40.
Alternative Price Action: If the price gives an Upside breakout of a pivot, then the price extends to 1825.10 and 1831.90.
Comment: MACD in negative territory and price below its 55MA.
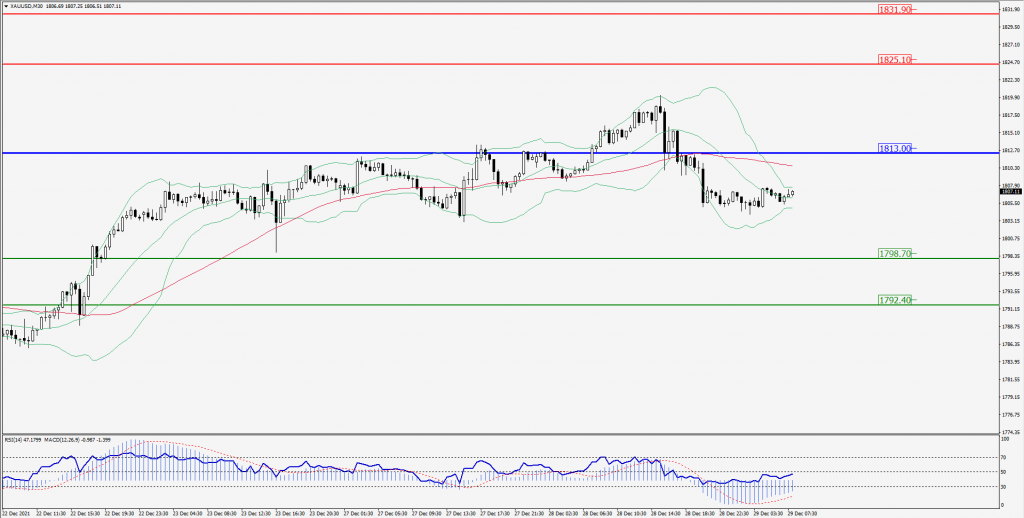
Green Lines Indicate Resistance Levels – Red Lines Indicates Support Levels
Light Blue is a Pivot Point – Black represents the price when the report was produced
Dow Jones Intraday: Strong Trend on the upside
Our pivot point is 36,297.40
Preferable Price Action: Take Long positions above pivot with targets at 36,642.10 & 36,804.90.
Alternative Price Action: Below 36.297.40 looks for further Downside to 35,969.60 & 35,725.10.
Comment: Price above 55MA & 20MA and RSI At 50 levels.
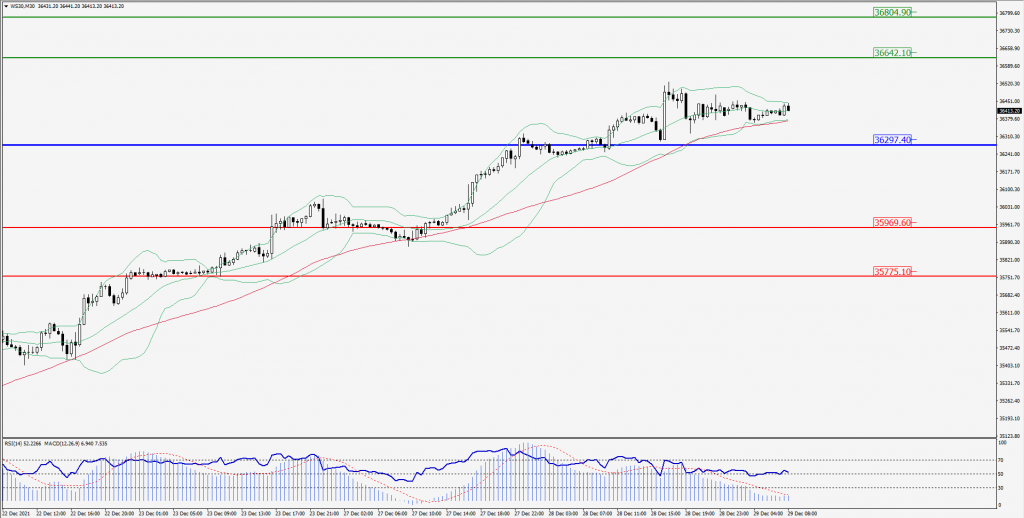
Green Lines Indicate Resistance Levels – Red Lines Indicates Support Levels
Light Blue is a Pivot Point – Black represents the price when the report was produced