Market Wrap: Stocks, Bonds, Commodities
The S&P 500 index ended at a record high on Monday, its fourth straight session of gains, as strong US retail sales underscored economic strength and eased worries from Omicron-driven flight cancellations that hit travel stocks.
The Dow Jones Industrial Average flat 351.82 points to 36,302.38, the S&P 500 gained 65.4 points (1.38%) to 4,791.19 and the Nasdaq Composite added 217.89 points (1.39%) to 15,871.26.
MSCI’s index of Asia-Pacific stocks outside Japan advance 0.49% to 785.58 levels. Australian index rose 0.44% to 7,420.30. Japanese Nikkei Index surged 1.37% to 29,069.16.
European stocks were higher on Tuesday, with the Stoxx Europe 50 Index rose 0.53% to 4,310.00, Germany’s DAX advance 0.71% to 15,941.50, and France’s CAC gained 0.53% to 7,177.95, and U.K.’s FTSE 100 closed.
Benchmark 10-year U.S. Treasury rose as demand for safe assets fell again, today 10-year bond yields lose 0.59% to 1.472.
Crude oil gained more ground on Tuesday with prices trading close to last session’s one-month high on expectations that the Omicron coronavirus variant will have only a limited impact on global demand.
Spot Brent crude oil gain 0.04% to $78.25 per barrel. US West Texas Intermediate crude up 0.20% to $75.72 a barrel.
The yellow metal gold is rose 0.40% to 1,815.95 dollars per ounce.
Market Wrap: Forex
The yen traded near a one-month low to the dollar on Tuesday as safe-havens fell out of favour following Wall Street’s rally to a record high overnight, with Omicron uncertainty consigned to the background.
Today, the U.S. dollar index measures the greenback against a trade-weighted basket of six major currencies, which flat 96.085.
The Euro US Dollar (EUR/USD) is a widely traded pair that is flat today. This left the pair trading around $1.13190.
The Japanese yen fell against the U.S. dollar on Tuesday as the stock pushes higher. Today US/JPY is rose 0.04% to 114.88 level.
Another commodity-related currency higher against the U.S dollar, AUD/USD gained 0.16% to 0.72450, and NZD/USD rose 0.07% to 0.68100 level.
EUR/USD Intraday: Support at 1.13100
Our pivot point is at 1.13100
Preferable Price Action: Take Long positions Above pivot level with targets at 1.13460 & 1.13660 in extension.
Alternative Price Action: Below pivot looks for a further Downside to 1.12760 & 1.12560.
Comment: Pair above 55MA & 20MA and RSI at 50 levels.
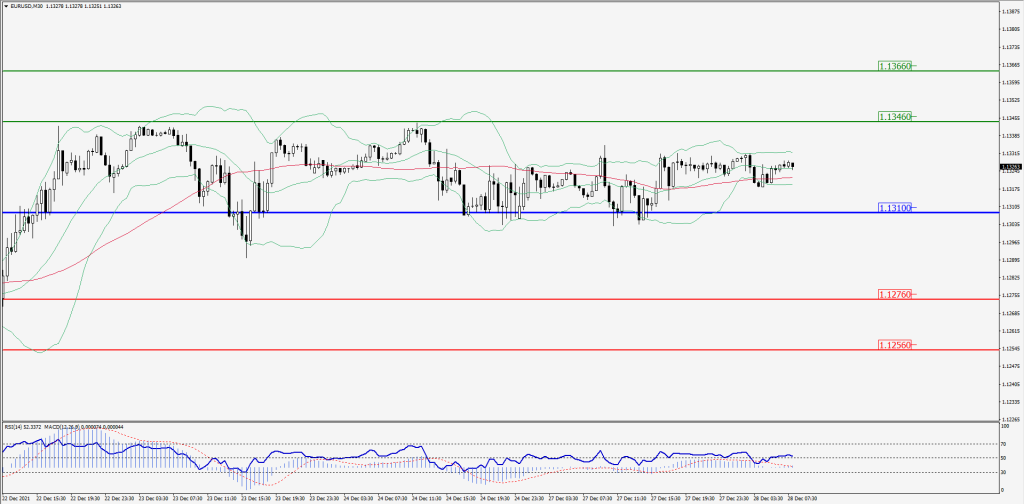
Green Lines Indicate Resistance Levels – Red Lines Indicates Support Levels
Light Blue is a Pivot Point – Black represents the price when the report was produced
GBP/USD Intraday: Trend on the upside
Our pivot point is at 1.33940
Preferable Price Action: Buy positions above pivot with targets at 1.34740 & 1.35140 in extension.
Alternative Price Action: The price below pivot would call for further downside to 1.33090 & 1.32710.
Comment: Pair above its 55MA and RSI at 50 levels.
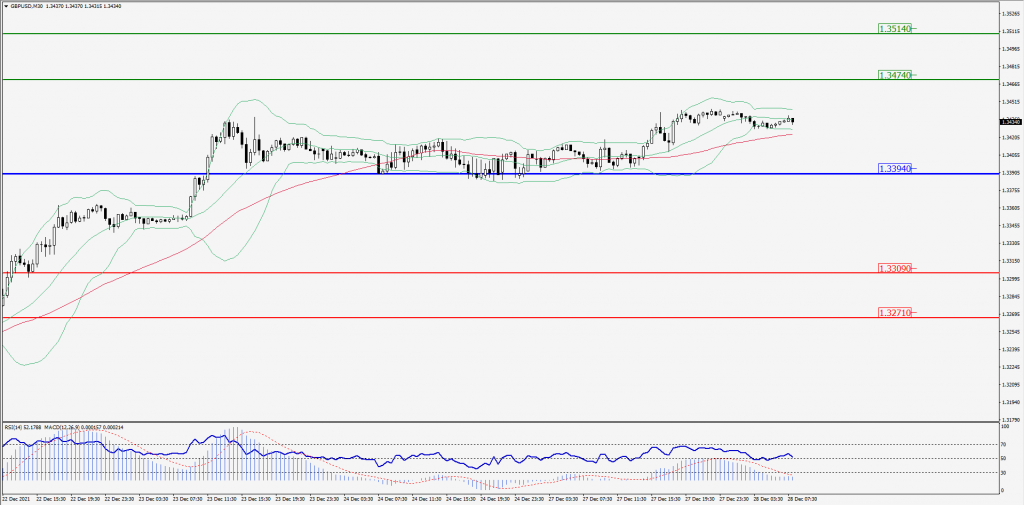
Green Lines Indicate Resistance Levels – Red Lines Indicates Support Levels
Light Blue is a Pivot Point – Black represents the price when the report was produced
USD/JPY Intraday: Break Consolidation Zone
Our pivot point is at 114.760
Preferable Price Action: Buy position Above pivot with the target at 115.020 and 115.180 in extension.
Alternative Price Action: The Downside breakout of the pivot would call for 114.520 and 114.340.
Comment: Price above its 55MA & 20MA and MACD in positive territory.
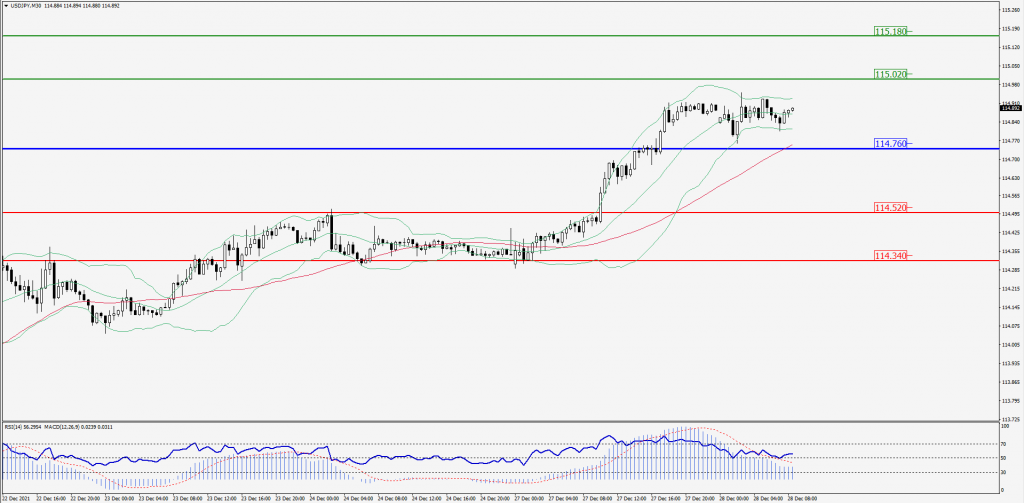
Green Lines Indicate Resistance Levels – Red Lines Indicates Support Levels
Light Blue is a Pivot Point – Black represents the price when the report was produced
AUD/USD Intraday: In Consolidation Zone
Our pivot point is at 0.72290
Preferable Price Action: Buy Positions pivot with targets at 0.72600 & 0.72760 in extension.
Alternative Price Action: Below pivot looks for a further downside with 0.72020 & 0.71830 as targets.
Comment: Pair above its 55MA & 20MA and RSI above 50 levels.
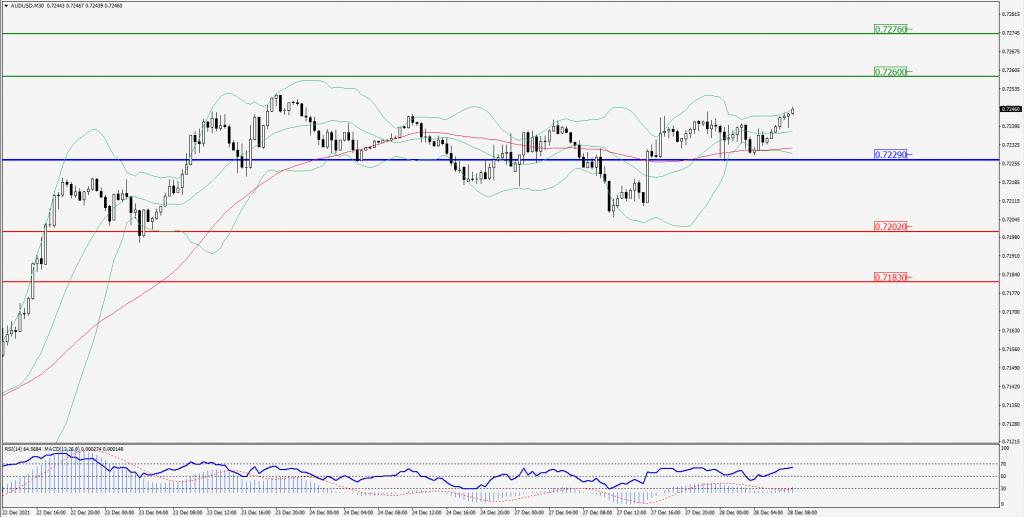
Green Lines Indicate Resistance Levels – Red Lines Indicates Support Levels
Light Blue is a Pivot Point – Black represents the price when the report was produced
CRUDEOIL Intraday: Break Resistance at 74.62
Our pivot point is at 74.62
Preferable Price Action: Above pivots Buy Oil with 76.77 & 78.23 as targets.
Alternative Price Action: Sell crude Below pivot with targets at 72.32 and 70.85 in extension.
Comment: Crude is Above 55MA & 20MA and MACD in the positive territory.
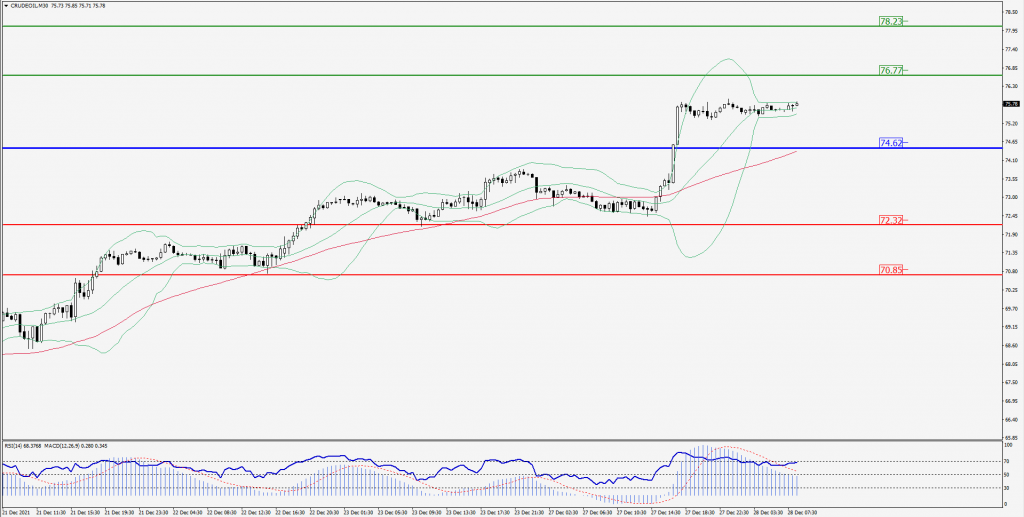
Green Lines Indicate Resistance Levels – Red Lines Indicates Support Levels
Light Blue is a Pivot Point – Black represents the price when the report was produced
XAU/USD Intraday: Major Support at 1808.00
Our pivot point is 1808.00
Preferable Price Action: Further Upside to 1820.00 and 1827.00.
Alternative Price Action: If the price gives a downside breakout of a pivot, then the price extends to 1797.00 and 1788.00.
Comment: MACD in positive territory and price above its 55MA & 20MA.
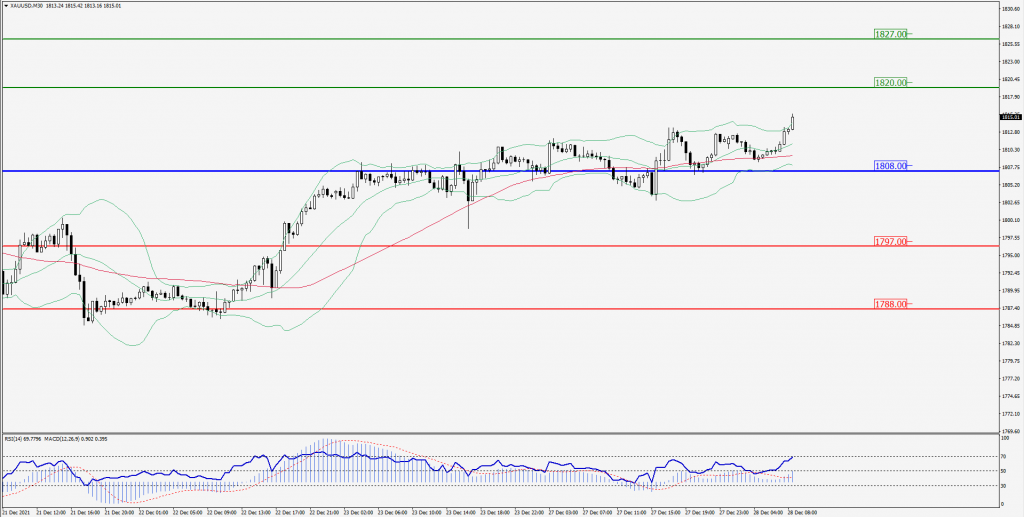
Green Lines Indicate Resistance Levels – Red Lines Indicates Support Levels
Light Blue is a Pivot Point – Black represents the price when the report was produced
Dow Jones Intraday: Strong Trend on the upside
Our pivot point is 36,190.00
Preferable Price Action: Take Long positions above pivot with targets at 36,467.00 & 36,690.00.
Alternative Price Action: Below 35,760.00 looks for further Downside to 35,922.00 & 35,672.00.
Comment: Price above 55MA & 20MA and RSI Above 50 levels.
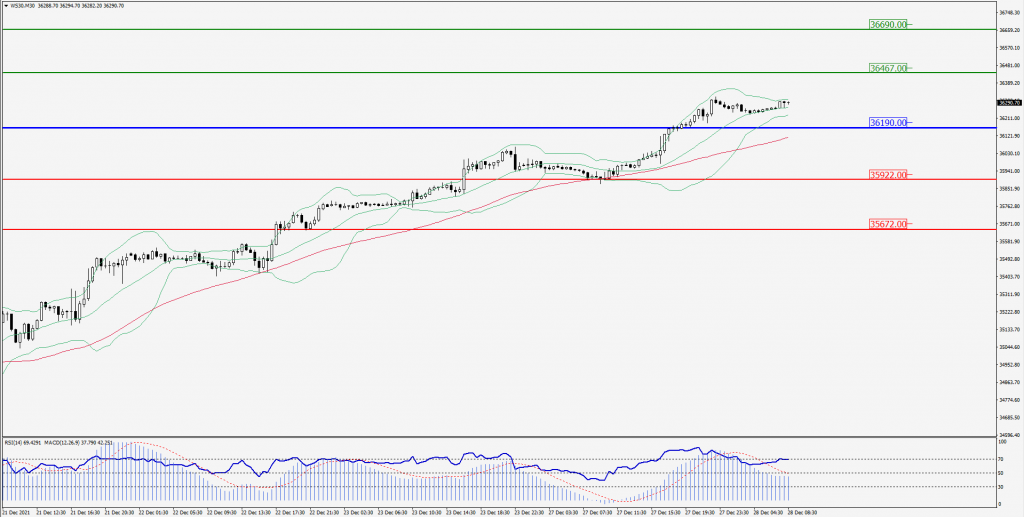
Green Lines Indicate Resistance Levels – Red Lines Indicates Support Levels
Light Blue is a Pivot Point – Black represents the price when the report was produced