Market Wrap: Stocks, Bonds, Commodities
Wall Street’s main indices finished Tuesday’s session with strong gains as investors shook off some anxiety about the latest coronavirus variant and boosted Nasdaq by piling into technology stocks.
The Dow Jones Industrial Average rose 492.4 points (1.40%) to 35,719.43, the S&P 500 gained 95.08 points (2.07%) to 4,686.75 and the Nasdaq Composite added 461.76 points (3.03%) to 15,686.92.
MSCI’s index of Asia-Pacific stocks outside Japan rose 0.49% to 796.49 levels. Australian index gained 1.25% to 7,405.40. Japanese Nikkei Index advances 1.42% to 28,860.62.
European stocks were higher on Wednesday, with the Stoxx Europe 50 Index rose 0.08% to 4,280.15, Germany’s DAX down 0.05% to 15,804.45, and France’s CAC advances 0.41% to 7,093.93, and U.K.’s FTSE 100 rose 0.35% to 7,365.60.
Benchmark 10-year U.S. Treasury rose as demand for safe assets grows again, today 10-year bond yields fell 1.03% to 1.465.
Oil prices edged lower on Wednesday, reversing gains from earlier the week, as investors tried to assess the full impact of the Omicron coronavirus variant on global fuel demand and the effectiveness of existing vaccines.
Spot Brent crude oil lost 0.42% to $75.12 per barrel. US West Texas Intermediate crude fell 0.62% to $71.60 a barrel.
The yellow metal gold is higher rose 0.27% to 1789.45 dollars per ounce.
Market Wrap: Forex
The Australian dollar hit its strongest level in a week on Wednesday amid a pick-up in risk appetite on signs Omicron may be less severe than other COVID-19 variants, but still vulnerable to existing vaccines.
Today, the U.S. dollar index measures the greenback against a trade-weighted basket of six major currencies, which slipped 0.21% to 96.170.
The Euro US Dollar (EUR/USD) is a widely traded pair that is rose 0.24% today. This left the pairing trading around $1.12900.
The Japanese yen rose against the U.S. dollar on Wednesday as the stock pushes higher. Today US/JPY is fell 0.10% to 113.480 level.
Another commodity-related currency higher against the U.S dollar, AUD/USD rose 0.17% to 0.71290, and NZD/USD flat to 0.67870 level.
EUR/USD Intraday: Support at 1.12730
Our pivot point is at 1.12730
Preferable Price Action: Take Long positions Above pivot level with targets at 1.13160 & 1.13330 in extension.
Alternative Price Action: Below pivot looks for a further Downside to 1.12360 & 1.12130.
Comment: Pair above its 55MA & 20MA and RSI above 50 levels.
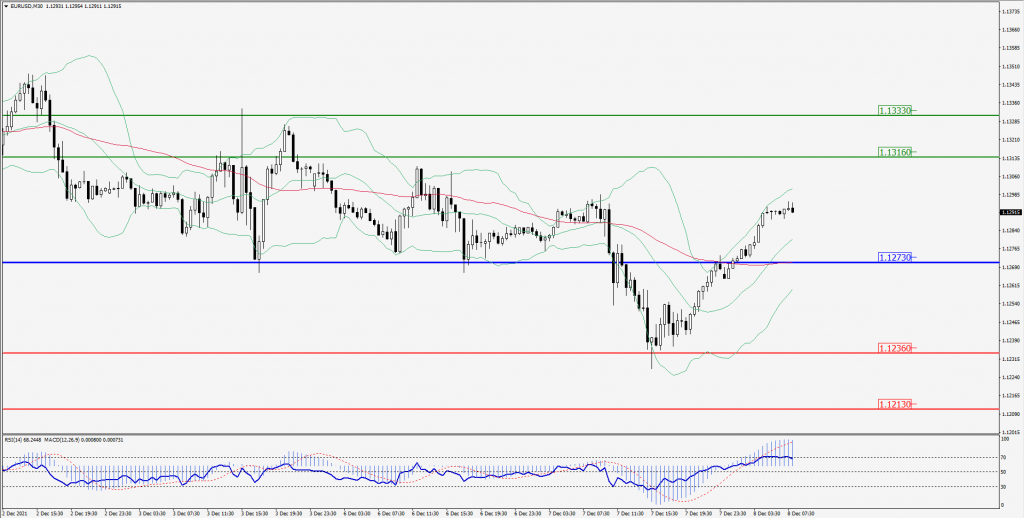
Green Lines Indicate Resistance Levels – Red Lines Indicates Support Levels
Light Blue is a Pivot Point – Black represents the price when the report was produced
GBP/USD Intraday: Support at 1.32390
Our pivot point is at 1.32390
Preferable Price Action: Buy positions above pivot with targets at 1.32930 & 1.33160 in extension.
Alternative Price Action: The price below pivot would call for further downside to 1.31860 & 1.31630.
Comment: Pair above its 55MA & 20MA and RSI above 50 levels.
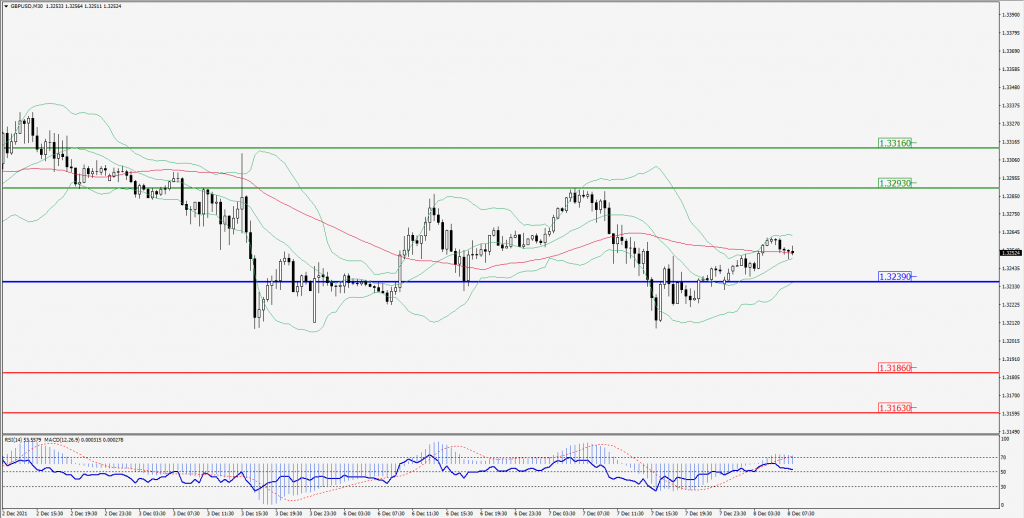
Green Lines Indicate Resistance Levels – Red Lines Indicates Support Levels
Light Blue is a Pivot Point – Black represents the price when the report was produced
USD/JPY Intraday: Trend on the upside
Our pivot point is at 113.330
Preferable Price Action: Buy position Above pivot with the target at 113.860 and 114.090 in extension.
Alternative Price Action: The Downside breakout of the pivot would call for 112.890 and 112.690.
Comment: Price above its 20MA and MACD in positive territory.
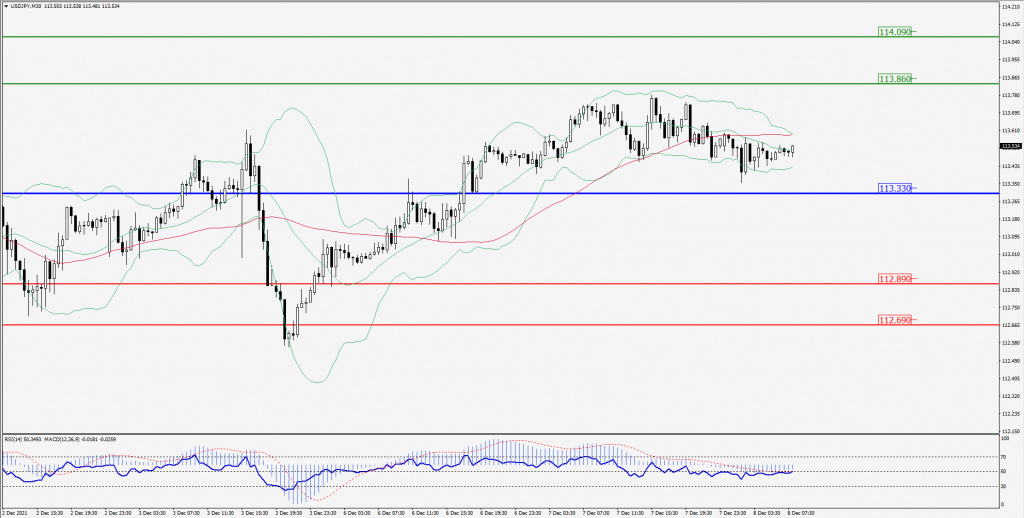
Green Lines Indicate Resistance Levels – Red Lines Indicates Support Levels
Light Blue is a Pivot Point – Black represents the price when the report was produced
AUD/USD Intraday: Trend on the upside
Our pivot point is at 0.71130
Preferable Price Action: Buy Positions above pivot with targets at 0.71590 & 0.71860 in extension.
Alternative Price Action: Below pivot looks for a further downside with 0.70630 & 0.70360 as targets.
Comment: Pair above its 55MA & 20MA and RSI above 50 levels.
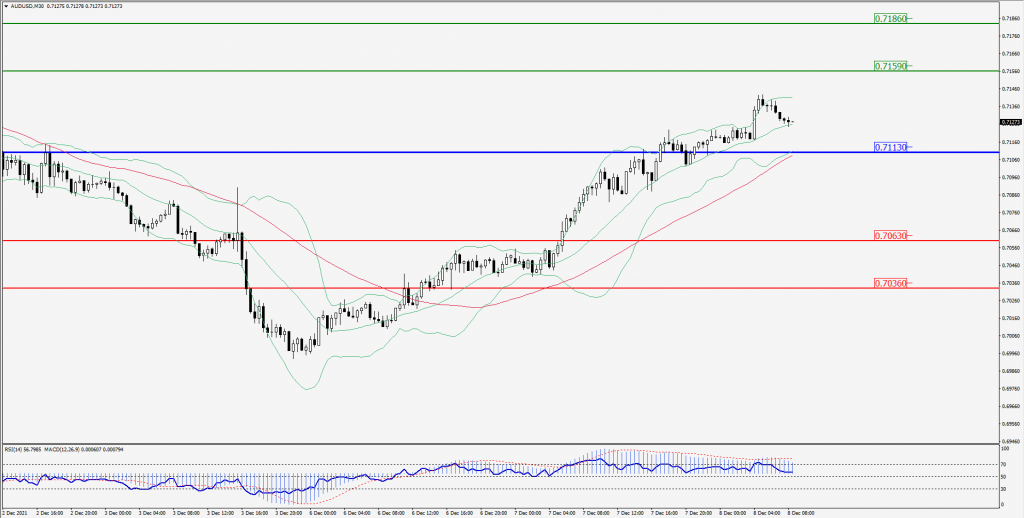
Green Lines Indicate Resistance Levels – Red Lines Indicates Support Levels
Light Blue is a Pivot Point – Black represents the price when the report was produced
CRUDEOIL Intraday: Trend on the upside
Our pivot point is at 70.30
Preferable Price Action: Above pivots Buy Oil with 73.60 & 75.30 as targets.
Alternative Price Action: Sell crude Below pivot with targets at 66.60 and 64.60 in extension.
Comment: Crude is above its 20MA & 55MA and MACD in the positive territory.
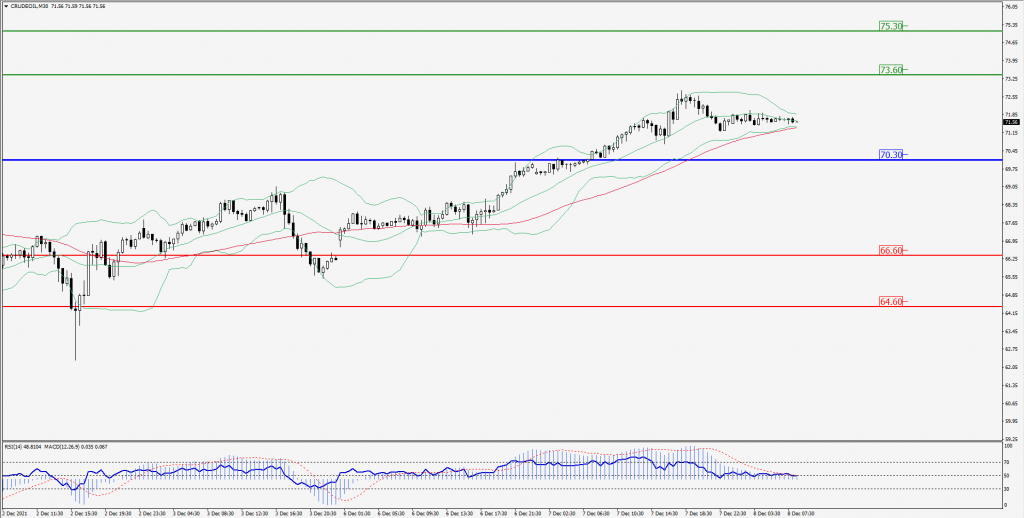
Green Lines Indicate Resistance Levels – Red Lines Indicates Support Levels
Light Blue is a Pivot Point – Black represents the price when the report was produced
XAU/USD Intraday: Support at 1784.60
Our pivot point is 1784.60
Preferable Price Action: Further upside to 1798.30 and 1805.00.
Alternative Price Action: If the price gives a downside breakout of a pivot, then the price extends to 1769.60 and 1763.00.
Comment: MACD in positive territory and price above its 20MA & 55MA.
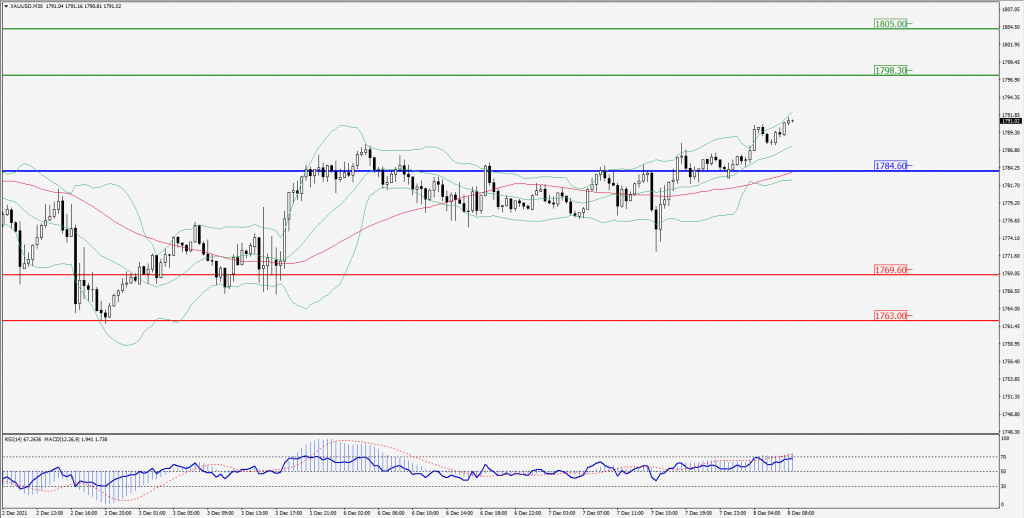
Green Lines Indicate Resistance Levels – Red Lines Indicates Support Levels
Light Blue is a Pivot Point – Black represents the price when the report was produced
Dow Jones Intraday: Trend on the upside
Our pivot point is 35,606.00
Preferable Price Action: Take Long positions above pivot with targets at 36,000.00 & 36,230.00.
Alternative Price Action: Below 35,190.00 looks for further Downside to 35,146.00 & 34,906.00.
Comment: Price above its 55MA & 20MA and RSI above 50 levels.
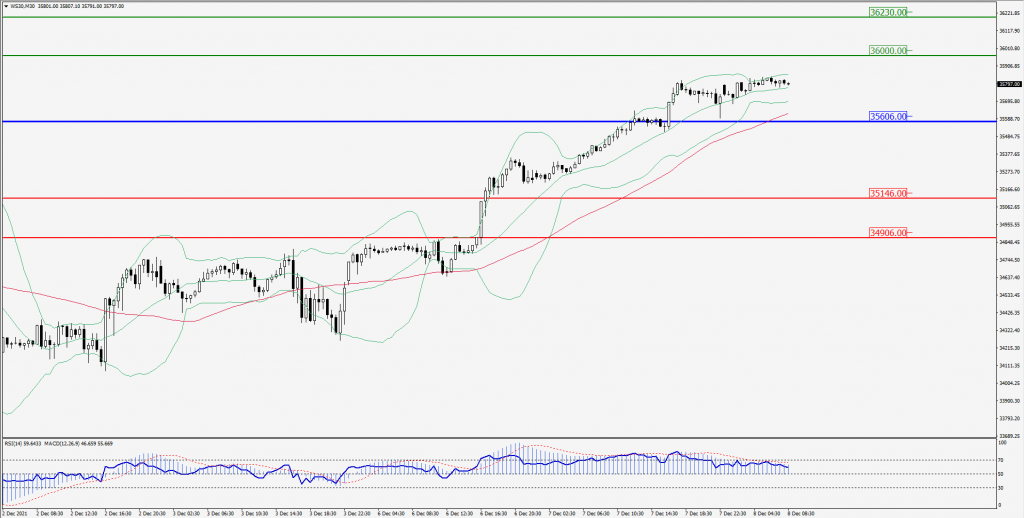
Green Lines Indicate Resistance Levels – Red Lines Indicates Support Levels
Light Blue is a Pivot Point – Black represents the price when the report was produced