Market Wrap: Stocks, Bonds, Commodities
Wall Street’s major indices closed rose on Monday with economically sensitive sectors and travel-related stocks soaring as investors were encouraged by some optimistic comments from a top U.S. official on the latest COVID-19 variant.
The S&P 500 gained 52.37 points (1.15%) to end at 4,590.80 points, while the Nasdaq Composite advance 137.12 points (0.91%) to 15,222.59. The Dow Jones Industrial Average rose 642.29 points (1.87%) to 35,222.37.
MSCI’s index of Asia-Pacific stocks outside Japan rose 1.62% to 790.47 levels. Australian index gained 0.95% to 7,313.90. Japanese Nikkei Index advances 1.89% to 28,455.60.
European stocks were higher on Tuesday, with the Stoxx Europe 50 Index jumping 2.05% to 4,224.75, Germany’s DAX rose 1.74% to 15,650.30, and France’s CAC advances 1.78% to 6,987.79, and U.K.’s FTSE 100 rose 1.13% to 7,312.90.
Benchmark 10-year U.S. Treasury rose as demand for safe assets grows again, today 10-year bond yields advance 1.32% to 1.453.
Oil prices climbed by nearly 5% on Monday on hopes that the Omicron coronavirus variant would have a less damaging economic impact if its symptoms proved mostly mild and as some OPEC member countries signaled confidence in the market.
Spot Brent crude oil gained 1.49% to $74.17 per barrel. US West Texas Intermediate crude rose 1.76% to $70.70 a barrel.
The yellow metal gold is higher rose 0.28% to 1784.45 dollars per ounce.
Market Wrap: Forex
The dollar edged higher against safe-haven currencies such as the yen and Swiss franc after reassuring news on the Omicron COVID-19 variant, while units like the Australian dollar that had weakened in recent weeks on growth worries also advanced.
Today, the U.S. dollar index measures the greenback against a trade-weighted basket of six major currencies, which slipped 0.11% to 96.225.
The Euro US Dollar (EUR/USD) is a widely traded pair that is rose 0.05% today. This left the pairing trading around $1.12890.
The Japanese yen fell against the U.S. dollar on Tuesday as the stock pushes lower. Today US/JPY is rose 0.20% to 113.690 level.
Another commodity-related currency higher against the U.S dollar, AUD/USD rose 0.57% to 0.70890, and NZD/USD gained 0.30% to 0.67680 level.
EUR/USD Intraday: Resistance at 1.13060
Our pivot point is at 1.13090
Preferable Price Action: Take Short positions Below pivot level with targets at 1.12690 & 1.12490 in extension.
Alternative Price Action: Above pivot looks for a further Upside to 1.13530 & 1.13690.
Comment: Pair below its 55MA & 20MA and RSI below 50 levels.
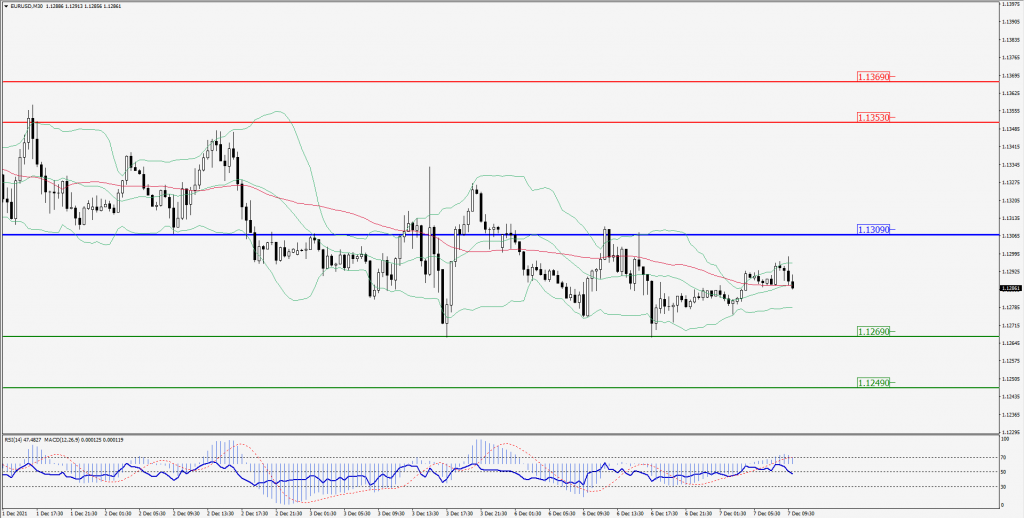
Green Lines Indicate Resistance Levels – Red Lines Indicates Support Levels
Light Blue is a Pivot Point – Black represents the price when the report was produced
GBP/USD Intraday: Support at 1.32560
Our pivot point is at 1.32560
Preferable Price Action: Buy positions above pivot with targets at 1.33230 & 1.33460 in extension.
Alternative Price Action: The price below pivot would call for further downside to 1.31930 & 1.31630.
Comment: Pair above its 55MA and RSI at 50 levels.
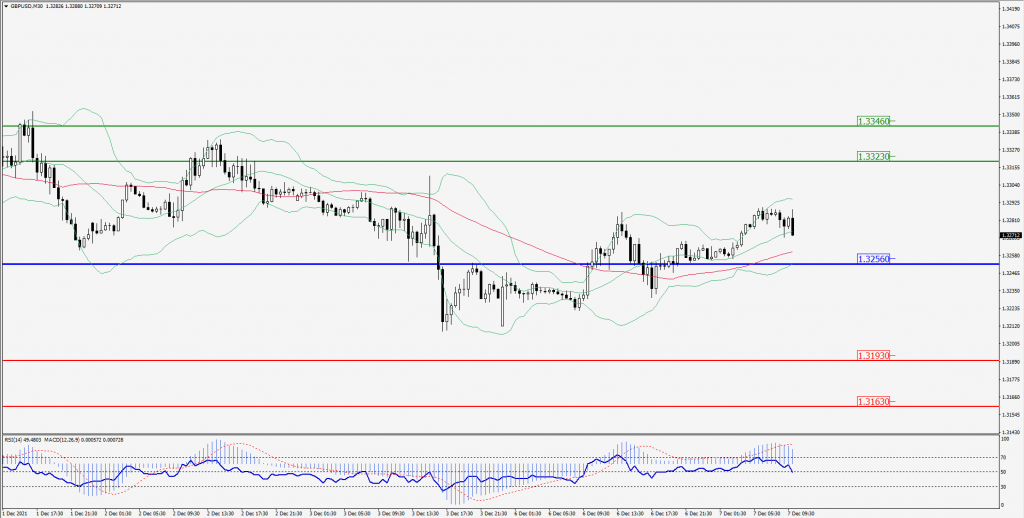
Green Lines Indicate Resistance Levels – Red Lines Indicates Support Levels
Light Blue is a Pivot Point – Black represents the price when the report was produced
USD/JPY Intraday: Break resistance level
Our pivot point is at 113.460
Preferable Price Action: Buy position Above pivot with the target at 113.900 and 114.130 in extension.
Alternative Price Action: The Downside breakout of the pivot would call for 112.960 and 112.790.
Comment: Price above its 55MA & 20MA and MACD in positive territory.
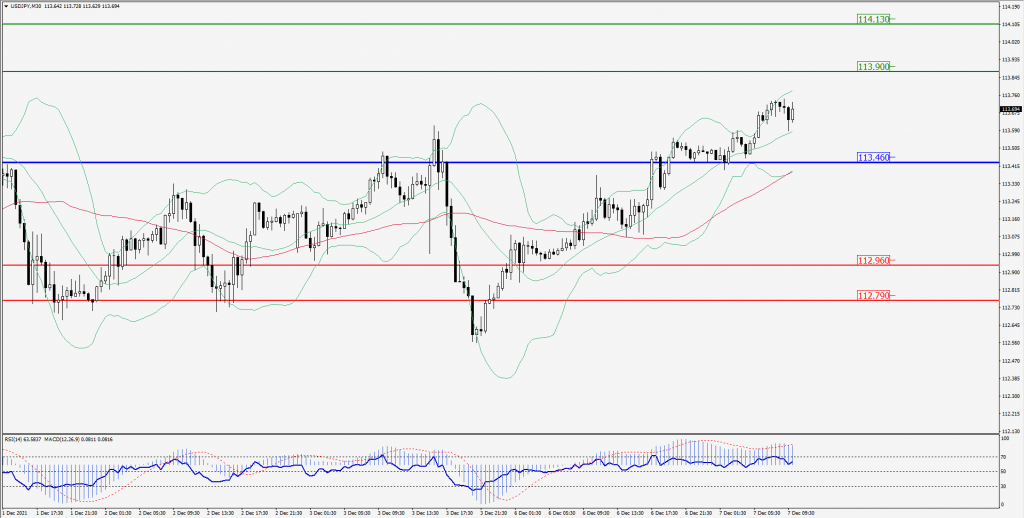
Green Lines Indicate Resistance Levels – Red Lines Indicates Support Levels
Light Blue is a Pivot Point – Black represents the price when the report was produced
AUD/USD Intraday: Trend on the upside
Our pivot point is at 0.70590
Preferable Price Action: Buy Positions above pivot with targets at 0.71230 & 0.71560 in extension.
Alternative Price Action: Below pivot looks for a further downside with 0.70000 & 0.69690 as targets.
Comment: Pair above its 55MA & 20MA and RSI above 50 levels.
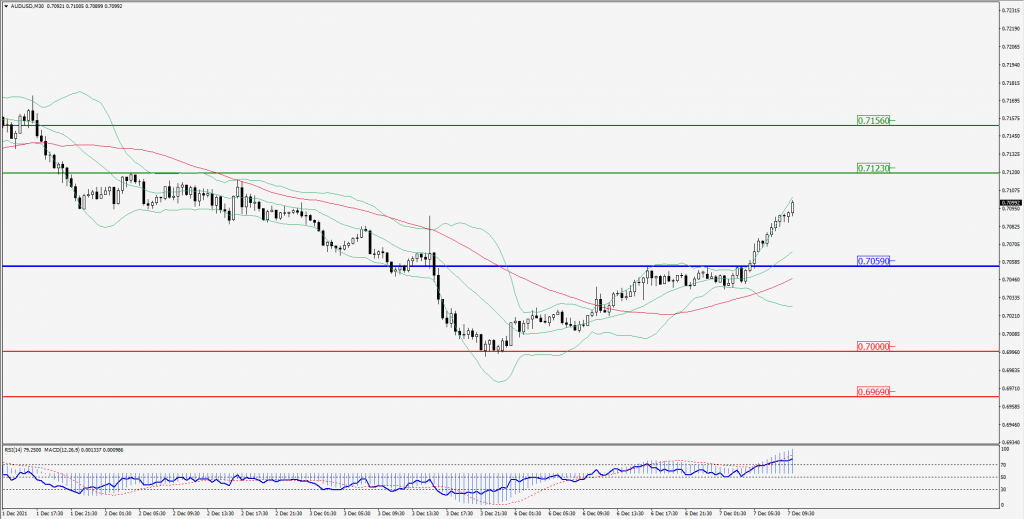
Green Lines Indicate Resistance Levels – Red Lines Indicates Support Levels
Light Blue is a Pivot Point – Black represents the price when the report was produced
CRUDEOIL Intraday: Trend on the upside
Our pivot point is at 67.90
Preferable Price Action: Above pivots Buy Oil with 72.30 & 73.90 as targets.
Alternative Price Action: Sell crude Below pivot with targets at 64.90 and 63.60 in extension.
Comment: Crude is above its 20MA & 55MA and MACD in the positive territory.
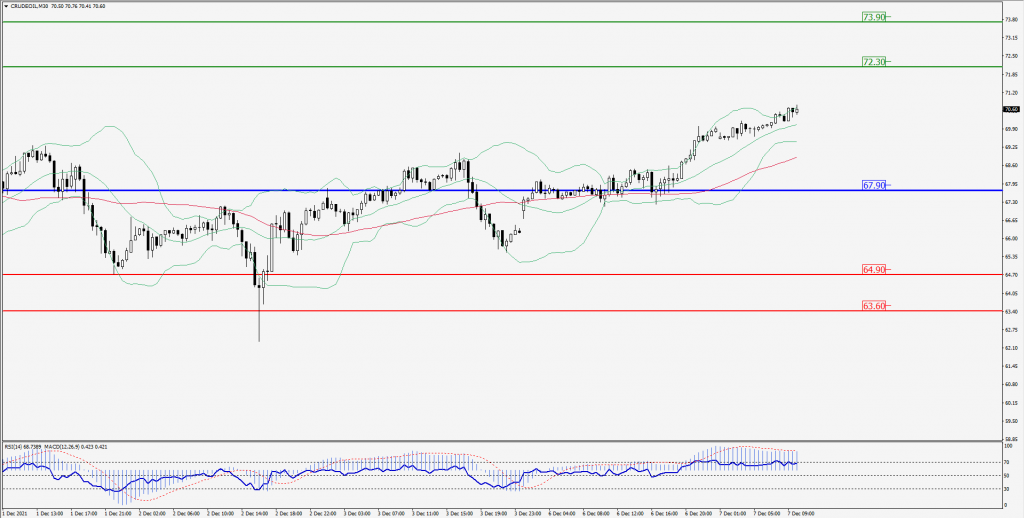
Green Lines Indicate Resistance Levels – Red Lines Indicates Support Levels
Light Blue is a Pivot Point – Black represents the price when the report was produced
XAU/USD Intraday: Support at 1775.20
Our pivot point is 1774.90
Preferable Price Action: Further upside to 1796.00 and 1805.30.
Alternative Price Action: If the price gives a downside breakout of a pivot, then the price extends to 1761.00 and 1752.30.
Comment: MACD in positive territory and price above its 20MA & 55MA.
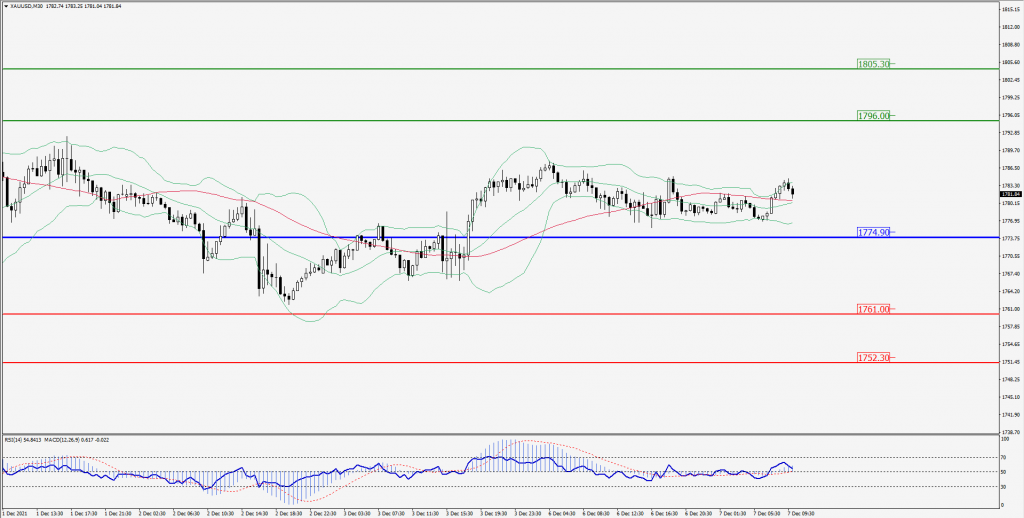
Green Lines Indicate Resistance Levels – Red Lines Indicates Support Levels
Light Blue is a Pivot Point – Black represents the price when the report was produced
Dow Jones Intraday: Trend on the upside
Our pivot point is 35,190.00
Preferable Price Action: Take Long positions above pivot with targets at 35,660.00 & 35,860.00.
Alternative Price Action: Below 35,190.00 looks for further Downside to 34,690.00 & 34,460.00.
Comment: Price above its 55MA & 20MA and RSI above 50 levels.
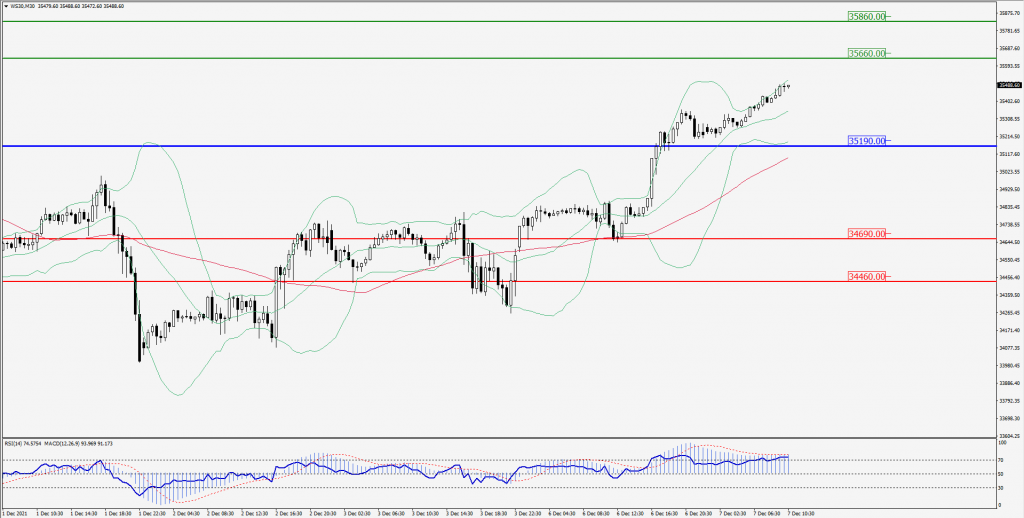
Green Lines Indicate Resistance Levels – Red Lines Indicates Support Levels
Light Blue is a Pivot Point – Black represents the price when the report was produced