Market Wrap: Stocks, Bonds, Commodities
American Major stock indices gained on Friday and the Dow Jones average post its biggest weekly percentage gain since June month, as Goldman Sachs publish strong quarterly earnings for the big banks.
The Dow Jones Industrial Average gained 382.2 points (1.09%) to 35,294.76, the S&P 500 jumped 33.11 points (0.75%) to 4,471.37 and the Nasdaq Composite up 73.91 points (0.50%) to 14,897.34.
MSCI’s index of Asia-Pacific stocks outside Japan is fell 0.39% to 813.72 levels. Australian index gained 0.26% to 7,381.00. Japanese Nikkei Index advances 1.66% to 29,025.46.
European stocks were lower on Monday, with the Stoxx Europe 50 Index fell 0.68% to 4,154.60, Germany’s DAX lost 0.44% to 15,520.90, and France’s CAC slipped 0.80% to 6,674.72, and U.K.’s FTSE 100 down 0.17% to 7,222.25.
Benchmark 10-year U.S. Treasury rose as demand for safe assets grows again, today 10-year bond yields rose 1.54% to 1.600.
Oil prates touched their highest in years as demand continues its recovery from the COVID-19 pandemic, boosted by more custom from power generators turning away from expensive gas and coal to fuel oil and diesel.
Spot Brent crude oil gained 0.77% to $85.50 per barrel. US West Texas Intermediate crude rose 1.08% to $82.62 a barrel.
The yellow metal traded 0.21% lower to 1764.85 dollars per ounce.
Market Wrap: Forex
Today, the U.S. dollar index measures the greenback against a trade-weighted basket of six major currencies, which rose 0.23% to 94.150.
The Euro US Dollar (EUR/USD) is a widely traded pair that is fell 0.20% today. This left the pairing trading around $1.15730.
The Japanese yen flat against the U.S. dollar on Monday as the stock pushes higher. Today US/JPY flat to 114.240 level.
Another commodity-related currency lower against the U.S dollar, AUD/USD slipped 0.36% to 0.73960, and NZD/USD flat to 0.70630 level.
EUR/USD Intraday: Resistance at 1.15962
Our pivot point is at 1.15962
Preferable Price Action: Take short positions Below pivot level with targets at 1.15473 & 1.15226 in extension.
Alternative Price Action: Above pivot looks for a further upside to 1.16391 & 1.16630.
Comment: Pair below its 55MA & 20MA and RSI below 50 levels.
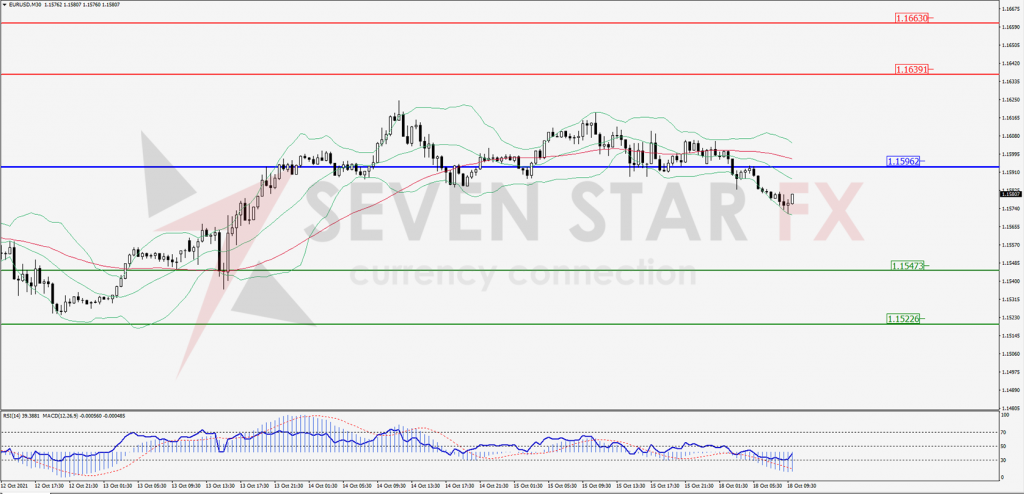
Green Lines Indicate Resistance Levels – Red Lines Indicates Support Levels
Light Blue is a Pivot Point – Black represents the price when the report was produced
GBP/USD Intraday: Trend on the upside
Our pivot point is at 1.37105
Preferable Price Action: Buy positions above pivot with targets at 1.37681 & 1.37985 in extension.
Alternative Price Action: The price below pivot would call for further downside to 1.36561 & 1.36239.
Comment: Pair above its 50MA & 20MA and RSI above 50 levels.
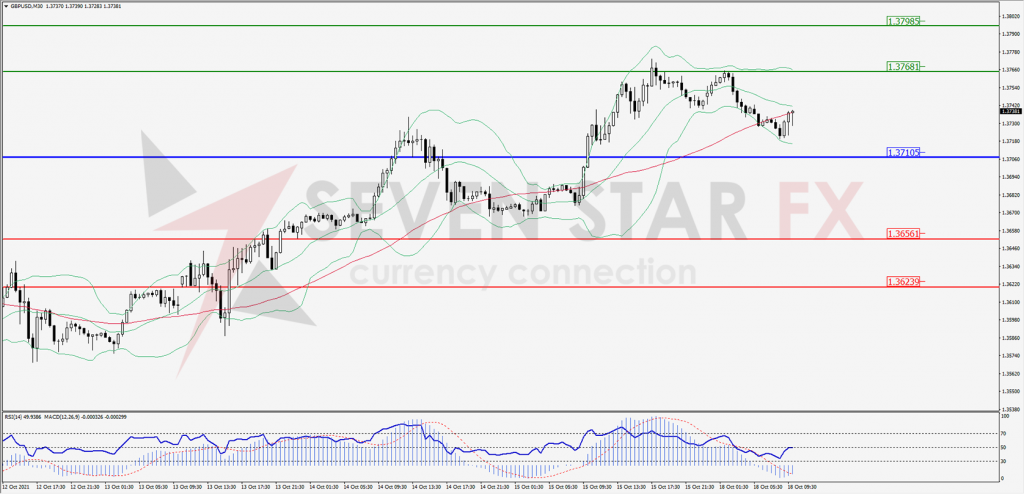
Green Lines Indicate Resistance Levels – Red Lines Indicates Support Levels
Light Blue is a Pivot Point – Black represents the price when the report was produced
USD/JPY Intraday: Support at 114.005
Our pivot point is at 114.005
Preferable Price Action: Buy position above pivot with the target at 114.645 and 114.985 in extension.
Alternative Price Action: The downside breakout of the pivot would call for 113.378 and 113.048.
Comment: Price above its 55MA & 20MA and MACD in positive territory.
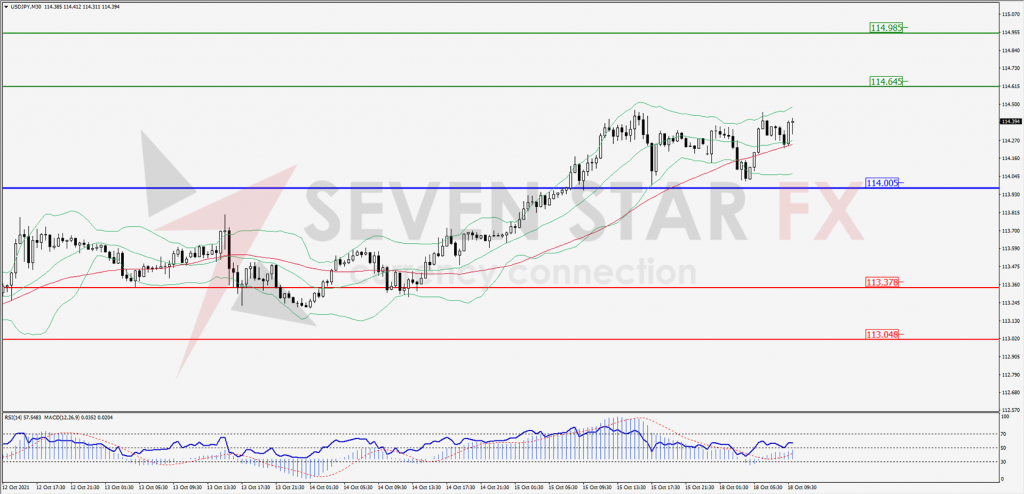
Green Lines Indicate Resistance Levels – Red Lines Indicates Support Levels
Light Blue is a Pivot Point – Black represents the price when the report was produced
AUD/USD Intraday: Resistance at 0.74157
Our pivot point is at 0.74157
Preferable Price Action: Sell Positions below pivot with targets at 0.73755 & 0.73520 in extension.
Alternative Price Action: Above pivot looks for a further upside with 0.74579 & 0.74813 as targets.
Comment: Pair below its 55MA & 20MA and RSI below 50 levels.
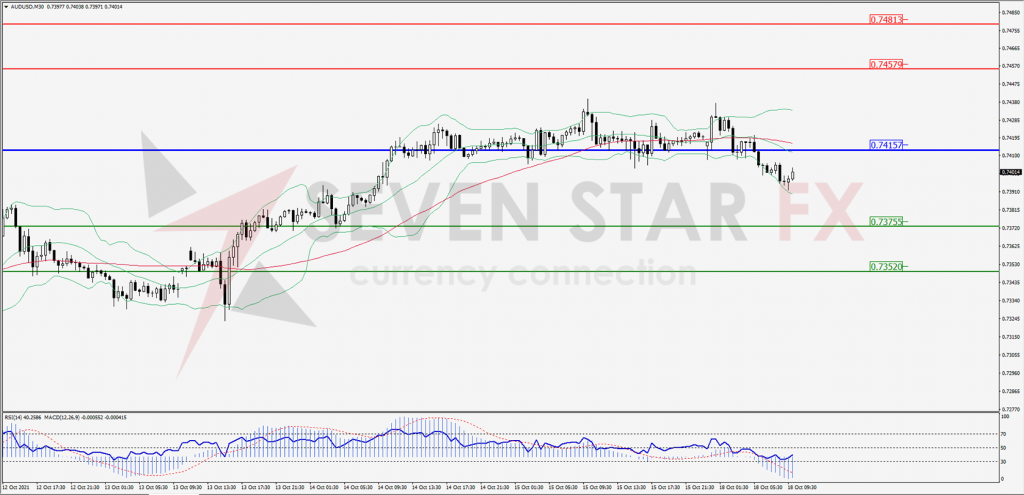
Green Lines Indicate Resistance Levels – Red Lines Indicates Support Levels
Light Blue is a Pivot Point – Black represents the price when the report was produced
CRUDEOIL Intraday: Support at 80.60
Our pivot point is at 80.60
Preferable Price Action: Above pivots buy Oil with 83.39 & 84.33 as targets.
Alternative Price Action: Sell crude below pivot with targets at 80.23 and 79.30 in extension.
Comment: Crude is above its 55MA and MACD in the positive territory.
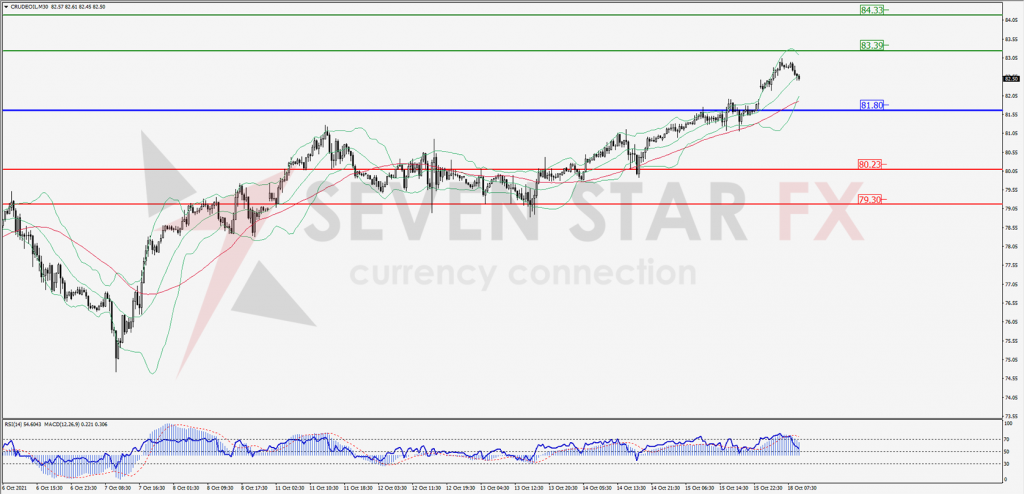
Green Lines Indicate Resistance Levels – Red Lines Indicates Support Levels
Light Blue is a Pivot Point – Black represents the price when the report was produced
XAU/USD Intraday: Resistance at 1777.40
Our pivot point is 1777.40
Preferable Price Action: Further downside to 1755.65 and 1745.00.
Alternative Price Action: If the price gives an upside breakout of a pivot, then the price extends to 1797.50 and 1809.50.
Comment: MACD in positive territory and price below its 20MA & 55MA.
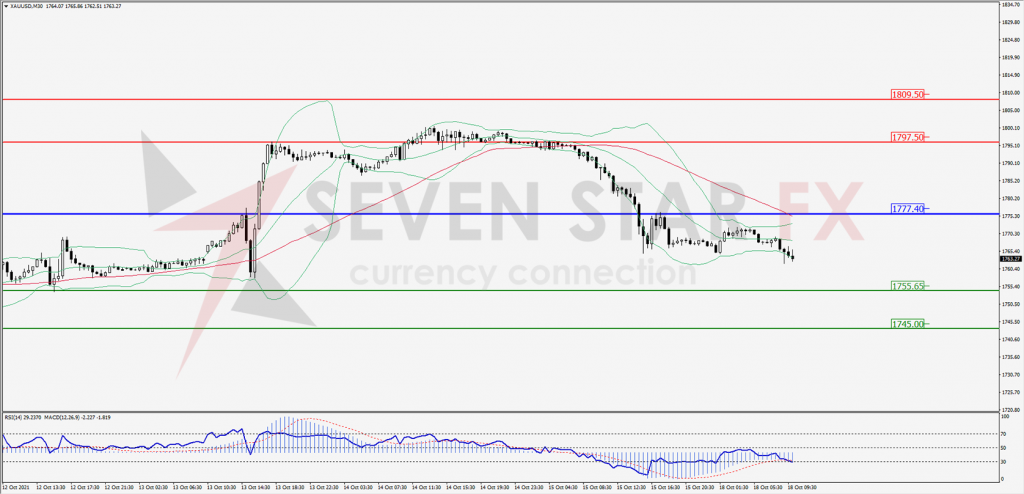
Green Lines Indicate Resistance Levels – Red Lines Indicates Support Levels
Light Blue is a Pivot Point – Black represents the price when the report was produced
Dow Jones Intraday: Trend on the upside
Our pivot point is 34,980.00
Preferable Price Action: Take long positions above pivot with targets at 35,386.26 & 35,568.54.
Alternative Price Action: Below 34,980.00 looks for further downside to 34,568.00 & 34,353.43.
Comment: Price above its 55MA & 20MA and RSI above 50 levels.
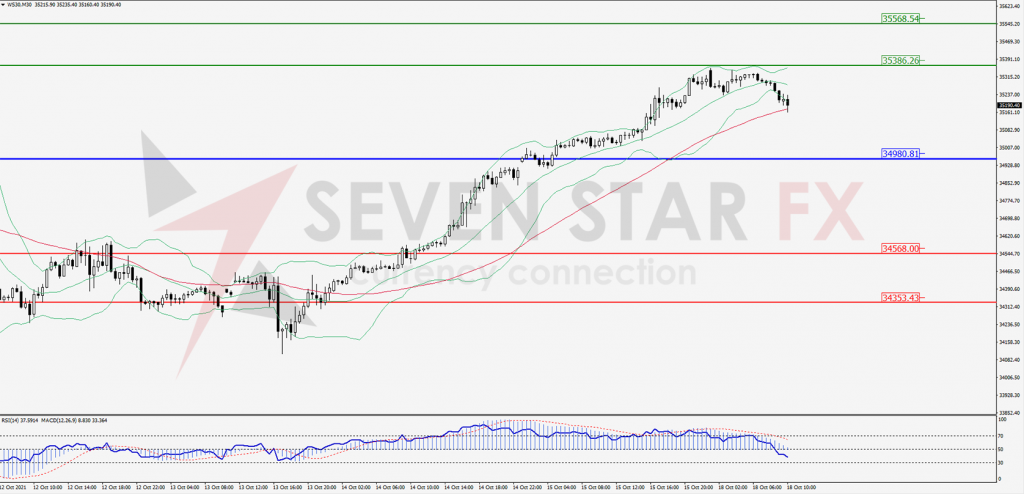
Green Lines Indicate Resistance Levels – Red Lines Indicates Support Levels
Light Blue is a Pivot Point – Black represents the price when the report was produced