Market Wrap: Stocks, Bonds, Commodities
Soaring energy prices retreated and stocks on Wall Street rebounded on Wednesday after the top US Senate Republican-backed an extension of the U.S. debt ceiling and Russia calmed volatile natural gas markets in Europe.
The Dow Jones Industrial Average advanced 0.30% to 34,416.99, the S&P 500 jumped 0.41% to 4,363.55 and the Nasdaq Composite gained 0.47% to 14,501.90.
Asian shares rallied on Thursday, supported by a possible easing in U.S.-China tensions, and weaker energy prices, as oil edged down from multi-year highs.
MSCI’s index of Asia-Pacific stocks outside Japan rose 1.86% to 795.94 levels. Australian index advance 0.70% to 7,256.70. Japanese Nikkei Index gained 0.54% to 27,678.12.
European stocks were higher on Thursday, with the Stoxx Europe 50 Index advance 1.30% to 4,064.99, Germany’s DAX rose 1.14% to 15,144.65, and France’s CAC gained 1.01% to 6,558.49, and U.K.’s FTSE 100 rose 0.92% to 7,059.20.
Benchmark 10-year U.S. Treasury rose as demand for safe assets grows again, today 10-year bond yields jumped 0.24% to 1.528.
Oil prices dropped for a second session Thursday, under pressure from an unexpected rise in U.S. crude stocks that raised concerns over demand after prices rallied to multi-year highs.
Spot Brent crude oil slipped 0.17% to $80.94 per barrel. US West Texas Intermediate crude lost 0.77% to $76.83 a barrel.
The yellow metal traded 0.13% higher to 1764.05 dollars per ounce.
Market Wrap: Forex
The safe-haven dollar held close to a 14-month high against the euro on Thursday as a surge in energy prices fuelled worries that inflation could crimp economic growth while also prodding the Federal Reserve to act sooner to normalize policy.
Today, the U.S. dollar index measures the greenback against a trade-weighted basket of six major currencies, which fell 0.13% to 94.150.
The Euro US Dollar (EUR/USD) is a widely traded pair that is rose 0.08% today. This left the pairing trading around $1.15640.
The Japanese yen fell against the U.S. dollar on Thursday as the stock pushes higher. Today US/JPY is flat to 111.370 level.
Another commodity-related currency higher against the U.S dollar, AUD/USD rose 0.30% to 0.72930, and NZD/USD gained 0.26% to 0.69260 level.
EUR/USD Intraday: Support at 1.15527
Our pivot point is at 1.15527
Preferable Price Action: Take long positions above pivot level with targets at 1.15886 & 1.16097 in extension.
Alternative Price Action: Below pivot looks for a further downside to 1.15160 & 1.14980.
Comment: Pair above its 55MA & 20MA and RSI above 50 levels.
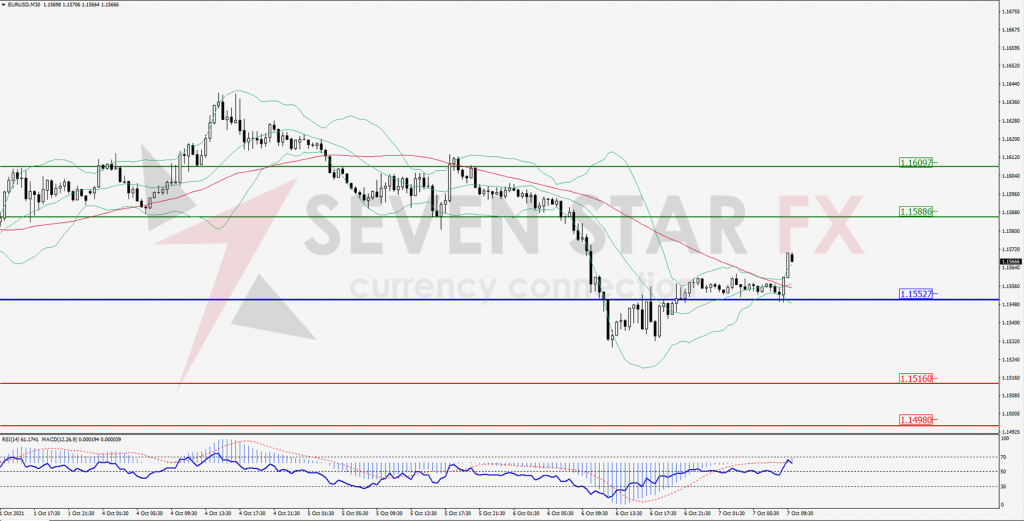
Green Lines Indicate Resistance Levels – Red Lines Indicates Support Levels
Light Blue is a Pivot Point – Black represents the price when the report was produced
GBP/USD Intraday: In a consolidation zone
Our pivot point is at 1.35725
Preferable Price Action: Buy positions above pivot with targets at 1.36485 & 1.36894 in extension.
Alternative Price Action: The price below pivot would call for further downside to 1.34970 & 1.34610.
Comment: Pair above its 55MA and RSI above 50 levels.
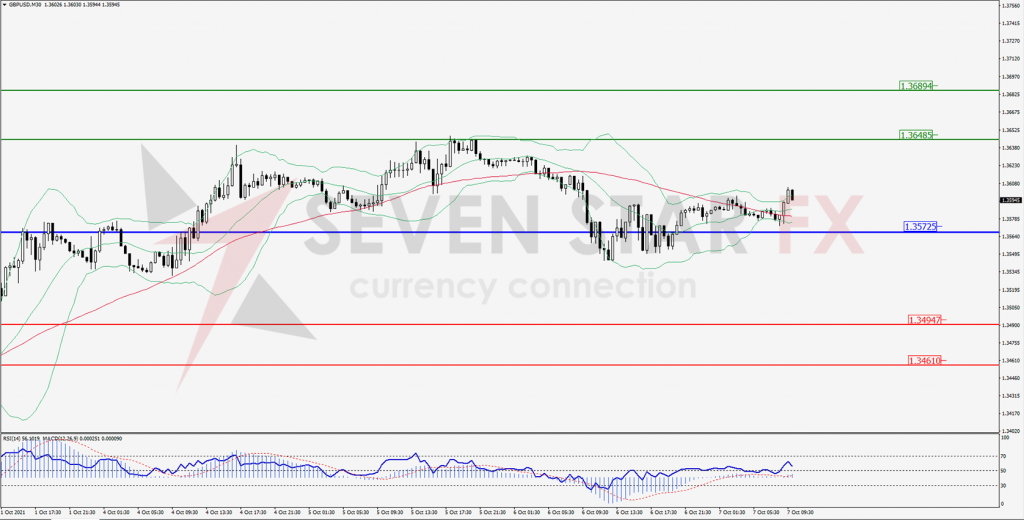
Green Lines Indicate Resistance Levels – Red Lines Indicates Support Levels
Light Blue is a Pivot Point – Black represents the price when the report was produced
USD/JPY Intraday: Resistance level at 111.537
Our pivot point is at 111.537
Preferable Price Action: Sell position below pivot with the target at 111.186 and 110.973 in extension.
Alternative Price Action: The upside breakout of the pivot would call for 111.907 and 112.146.
Comment: Price below its 55MA & 20MA and MACD in positive territory.
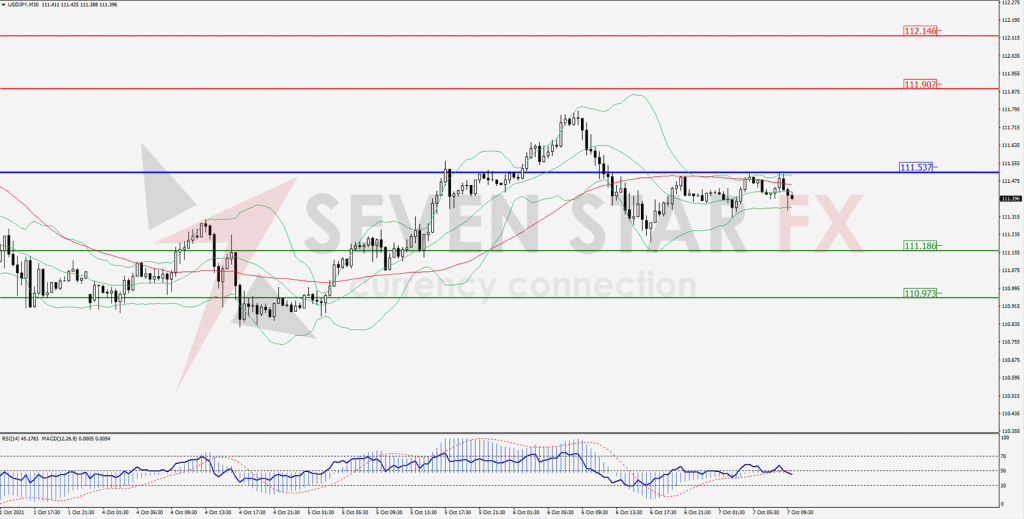
Green Lines Indicate Resistance Levels – Red Lines Indicates Support Levels
Light Blue is a Pivot Point – Black represents the price when the report was produced
AUD/USD Intraday: Break Resistance level
Our pivot point is at 0.72846
Preferable Price Action: Buy Positions above pivot with targets at 0.73247 & 0.73492 in extension.
Alternative Price Action: Below pivot looks for a further downside with 0.72410 & 0.72180 as targets.
Comment: Pair above its 55MA & 20MA and RSI above 50 levels.
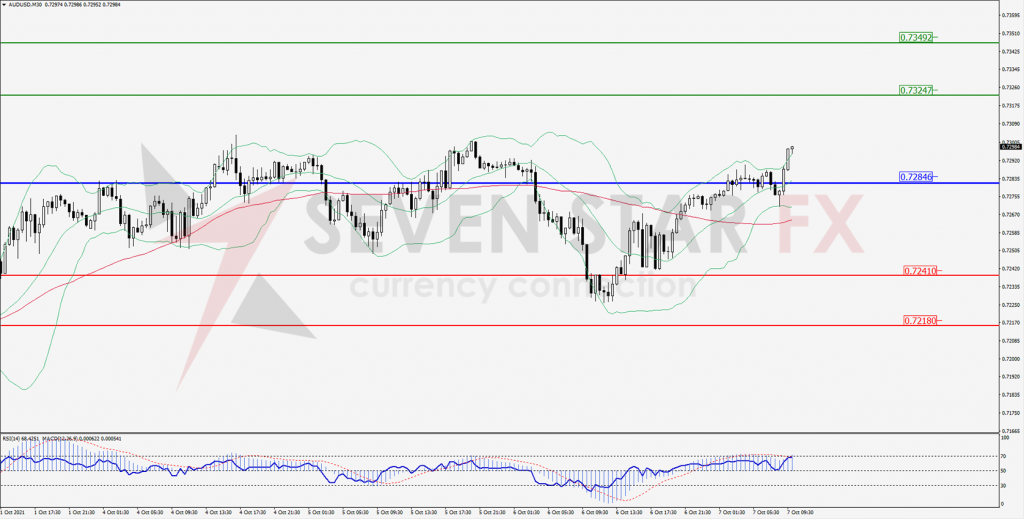
Green Lines Indicate Resistance Levels – Red Lines Indicates Support Levels
Light Blue is a Pivot Point – Black represents the price when the report was produced
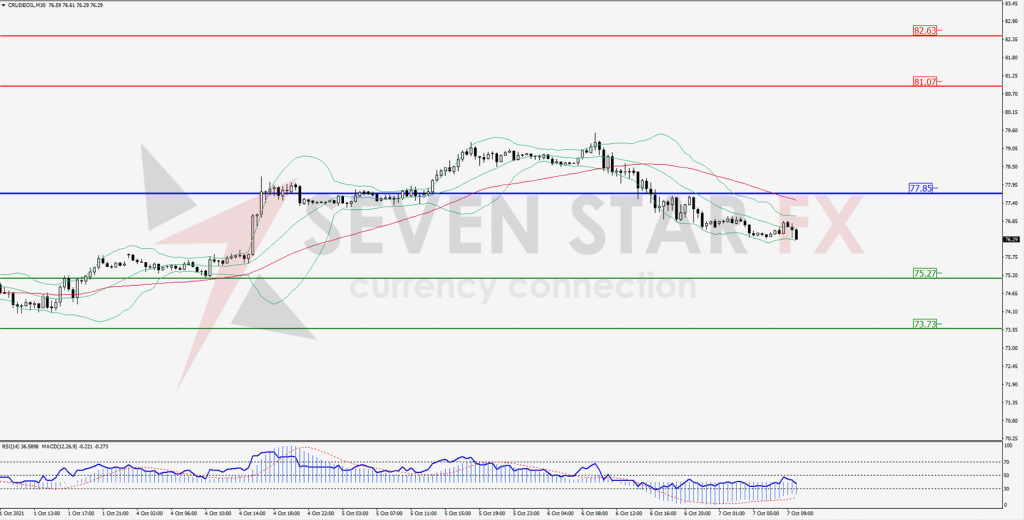
CRUDEOIL Intraday: Resistance at 77.85
Our pivot point is at 77.85
Preferable Price Action: Below pivots sell Oil with 75.27 & 73.73 as targets.
Alternative Price Action: Buy crude above pivot with targets at 81.07 and 82.63 in extension.
Comment: Crude is below its 55MA and MACD in the negative territory.
Green Lines Indicate Resistance Levels – Red Lines Indicates Support Levels
Light Blue is a Pivot Point – Black represents the price when the report was produced
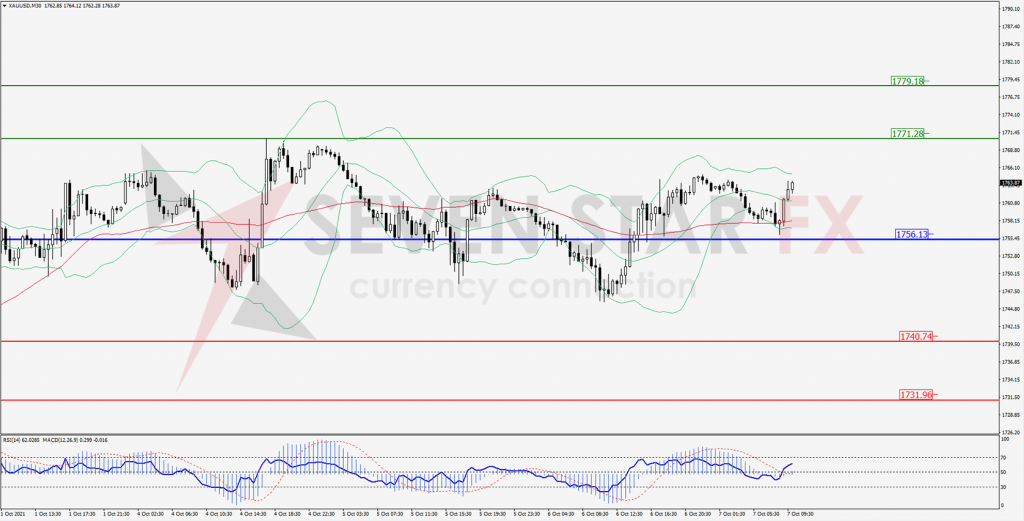
XAU/USD Intraday: Support at 1756.13
Our pivot point is 1756.13
Preferable Price Action: Further upside to 1771.28 and 1779.18.
Alternative Price Action: If the price gives a downside breakout of a pivot, then the price extends to 1740.74 and 1731.96.
Comment: MACD in positive territory and price above its 20MA & 55MA.
Green Lines Indicate Resistance Levels – Red Lines Indicates Support Levels
Light Blue is a Pivot Point – Black represents the price when the report was produced
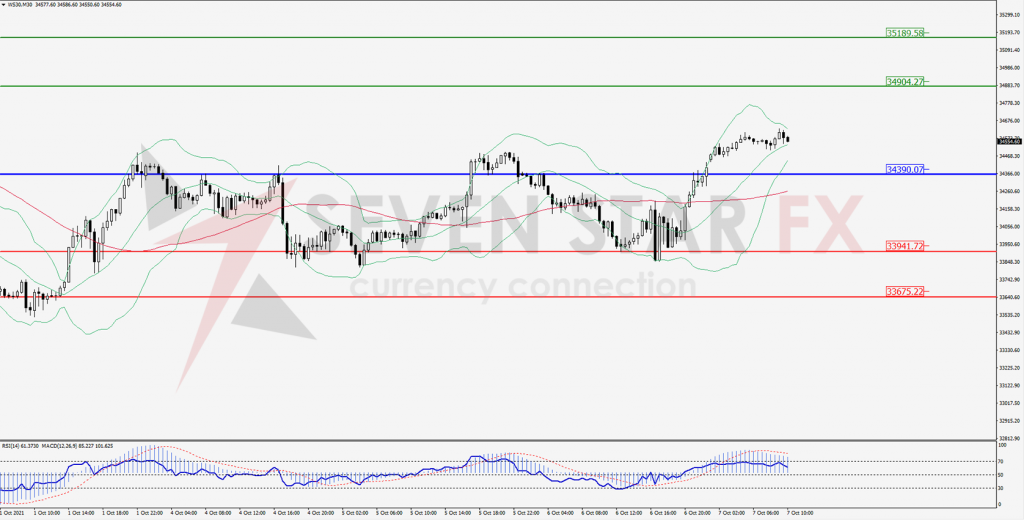
Dow Jones Intraday: Break resistance level
Our pivot point is 34,390.00
Preferable Price Action: Take long positions above pivot with targets at 34,904.00 & 35,189.00.
Alternative Price Action: below 33,390.00 looks for further downside to 33,941.00 & 33,675.00.
Comment: Price above its 55MA and RSI above 50 levels.
Green Lines Indicate Resistance Levels – Red Lines Indicates Support Levels
Light Blue is a Pivot Point – Black represents the price when the report was produced