Market Wrap: Stocks, Bonds, Commodities
Worldwide stock market indices gained on Tuesday as American and European shares rise after shart fall and the US dollar strong before of U.S. payrolls data on Friday.
The Dow Jones Industrial Average advanced 0.92% to 34,314.67, the S&P 500 jumped 1.05% to 4,345.72 and the Nasdaq Composite gained 1.25% to 14,433.80.
MSCI’s index of Asia-Pacific stocks outside Japan fell 0.45% to 783.94 levels. Australian index decline 0.71% to 7,197.20. Japanese Nikkei Index plunged 1.20% to 27,490.50.
European stocks were lower on Wednesday, with the Stoxx Europe 50 Index lost 1.43% to 4,006.45, Germany’s DAX fell 1.31% to 14,994.50, and France’s CAC declined 1.34% to 6,488.45, and U.K.’s FTSE 100 slipped 1.00% to 7,005.50.
Benchmark 10-year U.S. Treasury rose as demand for safe assets grows again, today 10-year bond yields jumped 2.28% to 1.566.
Oil strengthened on Tuesday, with US crude touched its highest since in 7 years, after the OPEC+ group of producers stay to its planned output increase rather than raising it further.
Spot Brent crude oil slipped 0.11% to $82.62 per barrel. US West Texas Intermediate crude gained 0.05% to $78.97 a barrel.
The yellow metal traded 0.43% lower to 1753.25 dollars per ounce.
Market Wrap: Forex
The US dollar index gained on Tuesday ahead of key payrolls report at the end of the week that could provide signs to the U.S. Federal Reserve’s next move.
Today, the U.S. dollar index measures the greenback against a trade-weighted basket of six major currencies, which rose 0.14% to 94.120.
The Euro US Dollar (EUR/USD) is a widely traded pair that is fell 0.10% today. This left the pairing trading around $1.15840.
The Japanese yen fell against the U.S. dollar on Wednesday as the stock pushes higher. Today US/JPY is rose 0.26% to 111.740 level.
Another commodity-related currency lower against the U.S dollar, AUD/USD fell 0.45% to 0.72570, and NZD/USD slipped 0.54% to 0.69230 level.
EUR/USD Intraday: Resistance at 1.16070
Our pivot point is at 1.16070
Preferable Price Action: Take short positions below pivot level with targets at 1.15640 & 1.15460 in extension.
Alternative Price Action: above pivot looks for a further upside to 1.16460 & 1.16640.
Comment: Pair below its 55MA & 20MA and RSI below 50 levels.
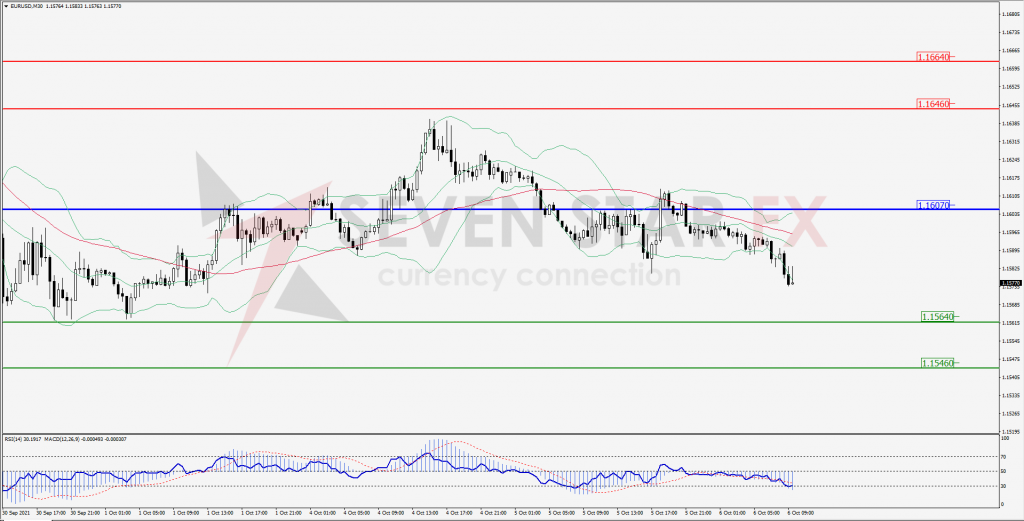
Green Lines Indicate Resistance Levels – Red Lines Indicates Support Levels
Light Blue is a Pivot Point – Black represents the price when the report was produced
GBP/USD Intraday: Trend on the upside
Our pivot point is at 1.35710
Preferable Price Action: Buy positions above pivot with targets at 1.36480 & 1.36800 in extension.
Alternative Price Action: The price below pivot would call for further downside to 1.34940 & 1.34600.
Comment: Pair below its 55MA and RSI below 50 levels.
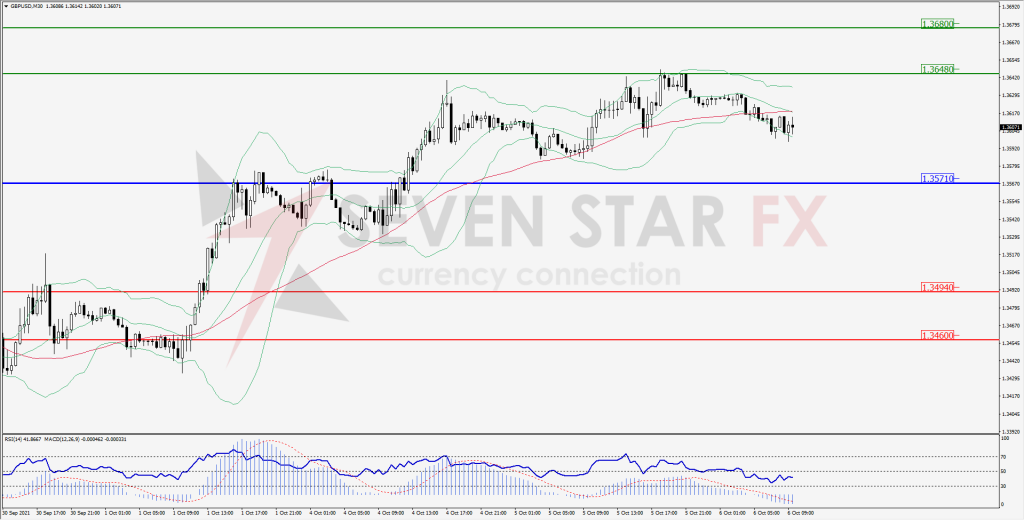
Green Lines Indicate Resistance Levels – Red Lines Indicates Support Levels
Light Blue is a Pivot Point – Black represents the price when the report was produced
USD/JPY Intraday: Break resistance level
Our pivot point is at 111.500
Preferable Price Action: Buy position above pivot with the target at 111.880 and 112.050 in extension.
Alternative Price Action: The downside breakout of the pivot would call for 111.140 and 110.960.
Comment: Price above its 55MA & 20MA and MACD in positive territory.
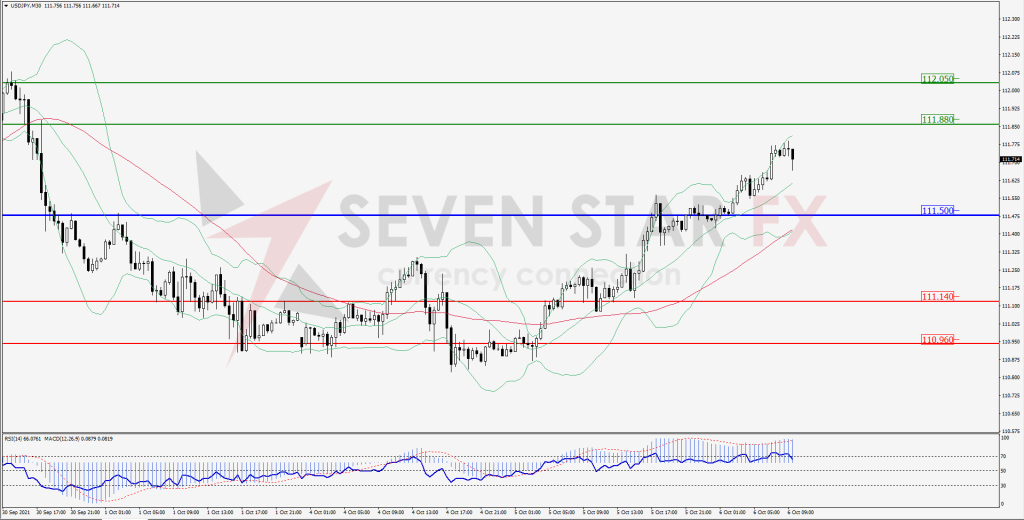
Green Lines Indicate Resistance Levels – Red Lines Indicates Support Levels
Light Blue is a Pivot Point – Black represents the price when the report was produced
AUD/USD Intraday: Resistance at 0.72850
Our pivot point is at 0.72850
Preferable Price Action: Sell Positions below pivot with targets at 0.72350 & 0.72030 in extension.
Alternative Price Action: Above pivot looks for a further upside with 0.73320 & 0.73630as targets.
Comment: Pair below its 55MA & 20MA and RSI below 50 levels.
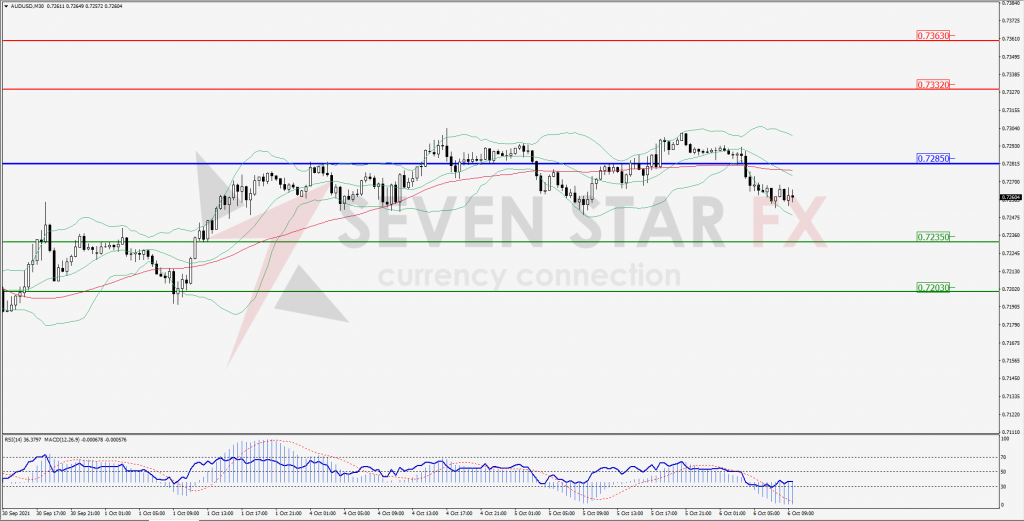
Green Lines Indicate Resistance Levels – Red Lines Indicates Support Levels
Light Blue is a Pivot Point – Black represents the price when the report was produced
CRUDEOIL Intraday: Strong trend on the upside
Our pivot point is at 77.80
Preferable Price Action: Above pivots buy Oil with 80.03 & 81.25 as targets.
Alternative Price Action: Sell crude below pivot with targets at 75.36 and 73.96 in extension.
Comment: Crude is above its 55MA and MACD in the positive territory.
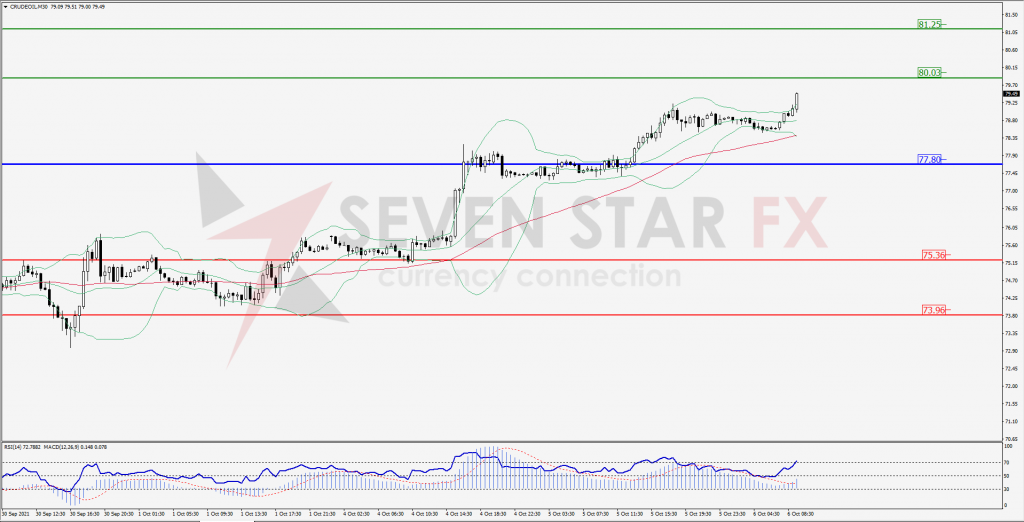
Green Lines Indicate Resistance Levels – Red Lines Indicates Support Levels
Light Blue is a Pivot Point – Black represents the price when the report was produced
XAU/USD Intraday: Resistance at 1766.00
Our pivot point is 1766.00
Preferable Price Action: Further downside to 1744.80 and 1731.80
Alternative Price Action: If the price gives a upside breakout of a pivot, then the price extends to 1787.20 and 1798.20.
Comment: MACD in negative territory and price below its 20MA & 55MA.
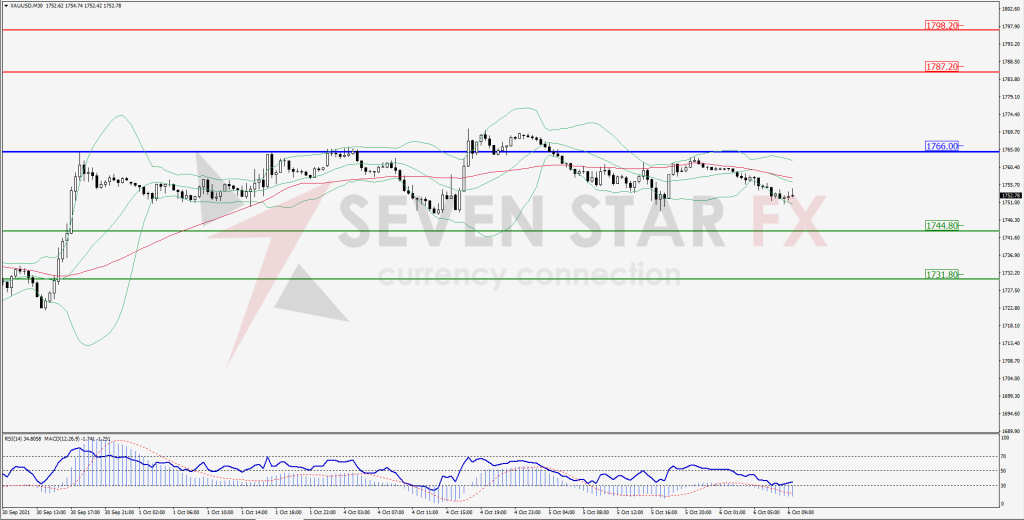
Green Lines Indicate Resistance Levels – Red Lines Indicates Support Levels
Light Blue is a Pivot Point – Black represents the price when the report was produced
Dow Jones Intraday: In a consolidation zone
Our pivot point is 33,873.00
Preferable Price Action: Take long positions above pivot with targets at 34,444.00 & 34,770.00.
Alternative Price Action: below 33,873.00 looks for further downside to 33,288.00 & 33,989.00.
Comment: Price above its 55MA and RSI at 50 levels.
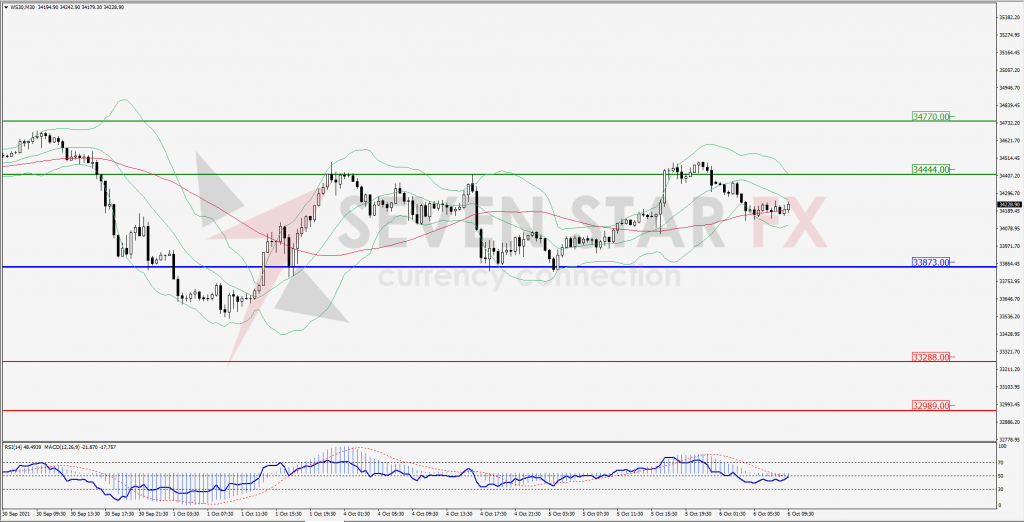
Green Lines Indicate Resistance Levels – Red Lines Indicates Support Levels
Light Blue is a Pivot Point – Black represents the price when the report was produced