Market Wrap: Stocks, Bonds, Commodities
The S&P 500 and Nasdaq composite indexes slipped on Monday with traders run for a value stock, affected by rising Treasury yields, weighed on equities in the quarter’s final week.
The Dow Jones Industrial Average fell 71.37 points (0.21%) to 34,869.37; the S&P 500 down 12.37 points (0.28%) at 4,443.11; and the Nasdaq Composite slipped 77.73 points (0.52%) to 14,969.97.
Asian stock indices lower on Tuesday as traders continued to fear over China property company Evergrande’s debt problem and focus on the potential impact of a widening power shortage in China.
MSCI’s index of Asia-Pacific stocks outside Japan flat to 809.59 levels. Australian index slipped 1.47% to 7,275.60. Japanese market lost 0.19% to 30,183.96.
European stocks were lower on Tuesday, with the Stoxx Europe 50 Index fell 0.84% to 4,130.75, Germany’s DAX lost 0.62% to 15,475.20, and France’s CAC down 0.67% to 6,606.11, and U.K.’s FTSE 100 lost 0.33% to 7,040.50.
Benchmark 10-year U.S. Treasury rose as demand for safe assets grows again, today 10-year bond yields jumped 3.60% to 1.537.
Oil prices rose on Monday for a fifth straight day, with Brent oil at its highest point since October 2018 and heading for $80, as traders feared about tighter oil supply because of rising demand in parts of the world.
Spot Brent crude oil rose 0.88% to $79.42 per barrel. US West Texas Intermediate crude gained 0.98% to $76.20 a barrel.
The yellow metal traded lower 0.61% to 1741.60 dollars per ounce.
Market Wrap: Forex
Today, the U.S. dollar index measures the greenback against a trade-weighted basket of six major currencies, which gained 0.23% to 93.593.
The Euro US Dollar (EUR/USD) is a widely traded pair that slipped 0.16% today. This left the pairing trading around $1.16730.
The Japanese yen fell against the U.S. dollar on Tuesday as the stock pushes higher. Today US/JPY gained 0.25% to 111.260 level.
Another commodity-related currency lower against the U.S dollar, AUD/USD fell 0.27% to 0.72650, and NZD/USD down 0.50% to 0.69810 level.
EUR/USD Intraday: Resistance at 1.16990
Our pivot point is at 1.16990
Preferable Price Action: Take short positions below pivot level with targets at 1.16650 & 1.16460 in extension.
Alternative Price Action: above pivot looks for a further upside to 1.17340 & 1.17530.
Comment: Pair below its 20MA & 55MA and RSI below 50 levels.
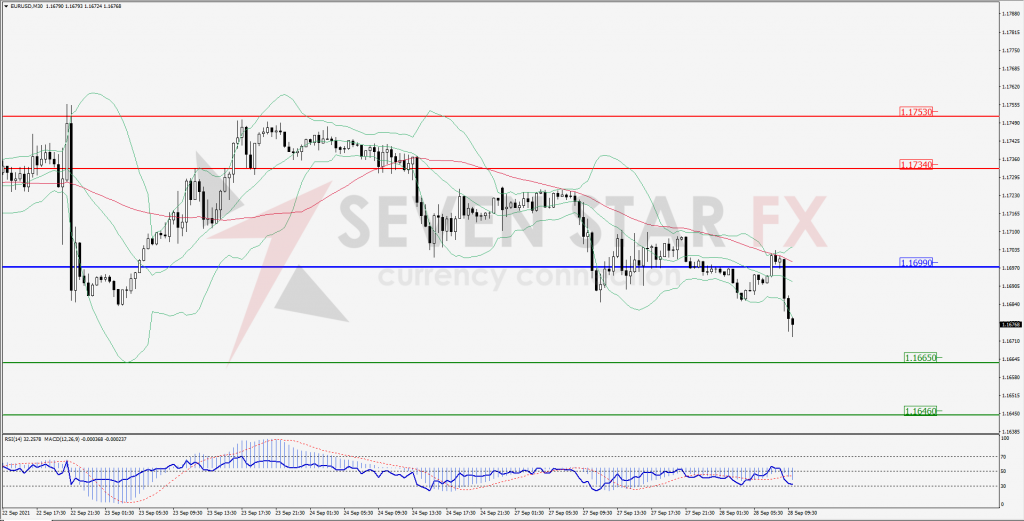
Green Lines Indicate Resistance Levels – Red Lines Indicates Support Levels
Light Blue is a Pivot Point – Black represents the price when the report was produced
GBP/USD Intraday: Resistance at 1.37170
Our pivot point is at 1.37170
Preferable Price Action: Sell positions below pivot with targets at 1.36620 & 1.36360 in extension.
Alternative Price Action: The price above pivot would call for further upside to 1.37720 & 1.37970.
Comment: Pair below its 55MA and RSI below 50 levels.
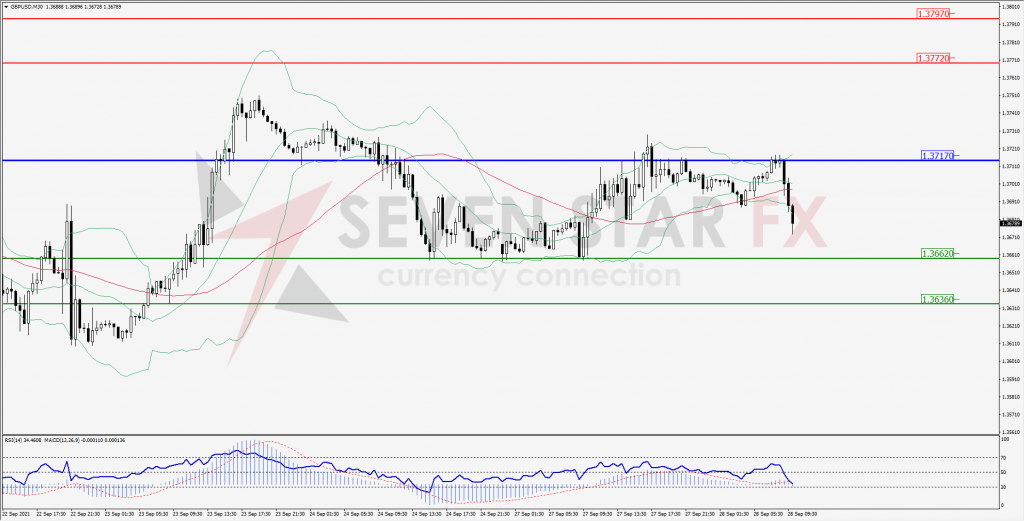
Green Lines Indicate Resistance Levels – Red Lines Indicates Support Levels
Light Blue is a Pivot Point – Black represents the price when the report was produced
USD/JPY Intraday: Strong trend on the upside
Our pivot point is at 111.000
Preferable Price Action: Buy position above pivot with the target at 111.620 and 111.930 in extension.
Alternative Price Action: The downside breakout of the pivot would call for 110.330 and 109.960.
Comment: Price above its 55MA & 20MA and MACD in positive territory.
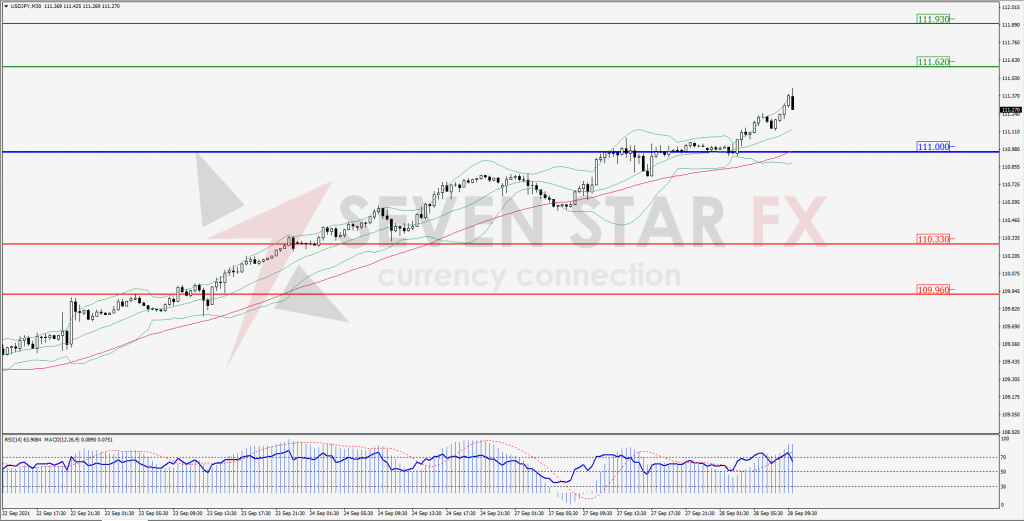
Green Lines Indicate Resistance Levels – Red Lines Indicates Support Levels
Light Blue is a Pivot Point – Black represents the price when the report was produced
AUD/USD Intraday: Major resistance at 0.72890
Our pivot point is at 0.72950
Preferable Price Action: Sell Positions below pivot with targets at 0.72520 & 0.72310 in extension.
Alternative Price Action: Above pivot looks for a further upside with 0.73350 & 0.73530 as targets.
Comment: Pair below its 55MA & 20MA and RSI at 50 levels.
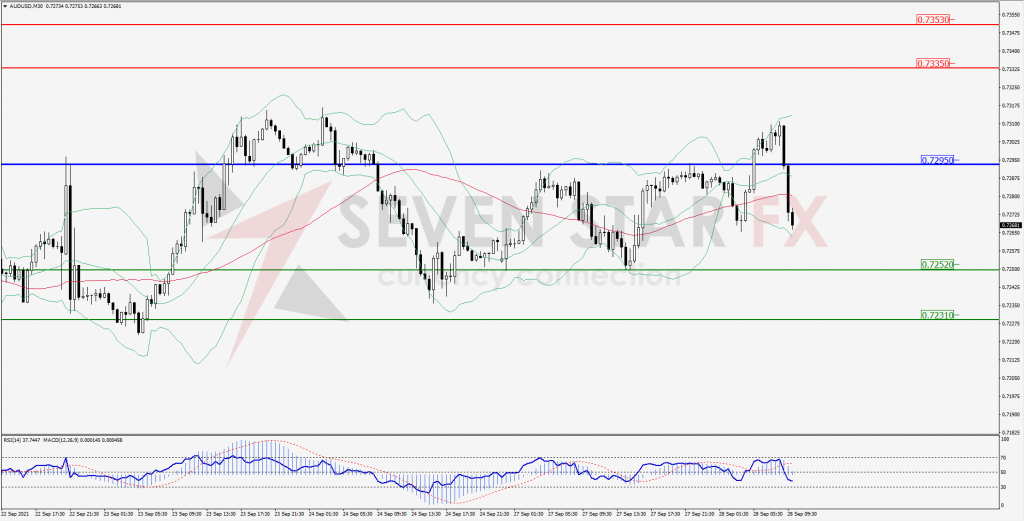
Green Lines Indicate Resistance Levels – Red Lines Indicates Support Levels
Light Blue is a Pivot Point – Black represents the price when the report was produced
CRUDEOIL Intraday: Trend on the upside
Our pivot point is at 75.08
Preferable Price Action: Above pivots buy Oil with 77.03 & 77.81 as targets.
Alternative Price Action: Sell crude below pivot with targets at 73.31 and 72.46 in extension.
Comment: Crude is above its 55MA & 20MA and MACD in the positive territory.
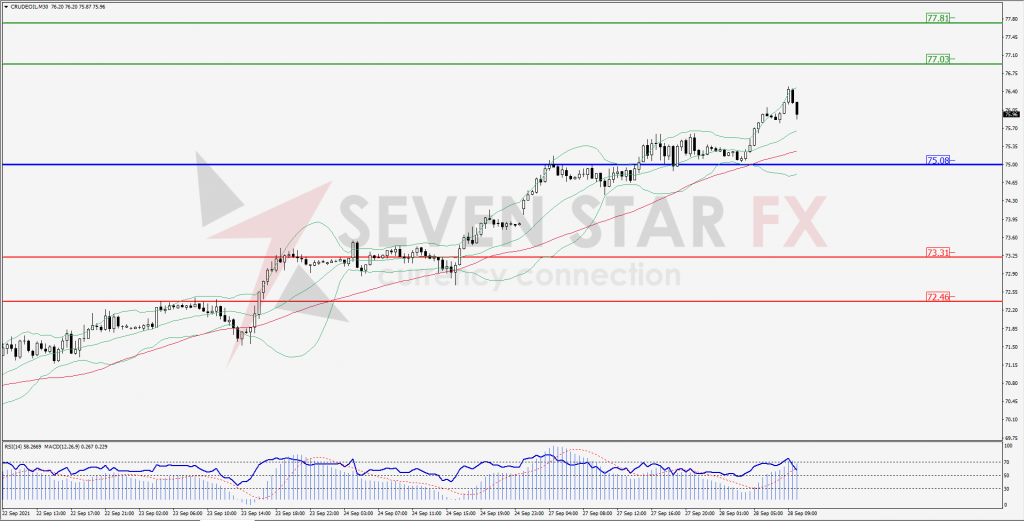
Green Lines Indicate Resistance Levels – Red Lines Indicates Support Levels
Light Blue is a Pivot Point – Black represents the price when the report was produced
XAU/USD Intraday: Resistance at 1753.00 level
Our pivot point is 1753.00
Preferable Price Action: Further downside to 1734.00 and 1725.20.
Alternative Price Action: If the price gives an upside breakout of a pivot, then the price extends to 1772.50 and 1782.30.
Comment: MACD in negative territory and price below its 20MA & 55MA.
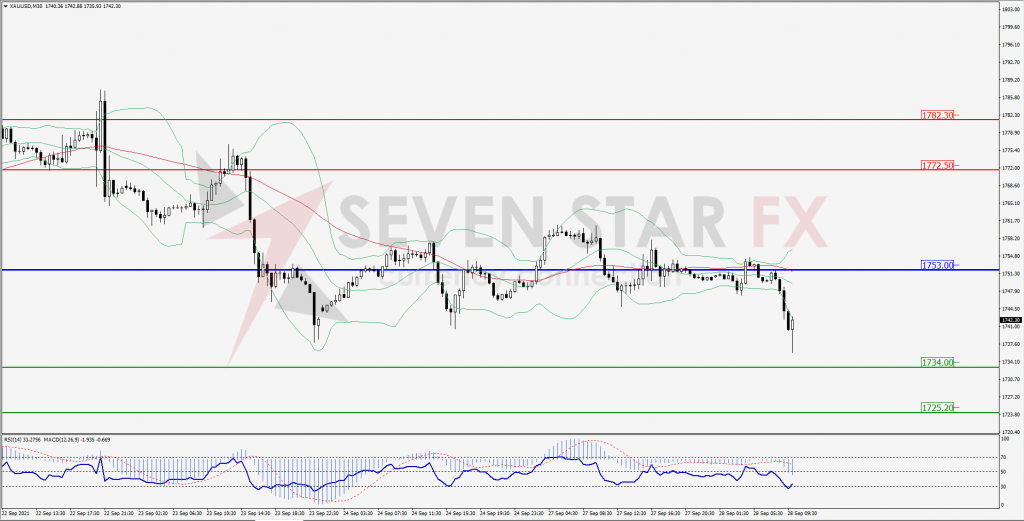
Green Lines Indicate Resistance Levels – Red Lines Indicates Support Levels
Light Blue is a Pivot Point – Black represents the price when the report was produced
Dow Jones Intraday: Support at 34,723.00
Our pivot point is 34,723.00
Preferable Price Action: Take long positions above pivot with targets at 35,117.00 & 35,316.00.
Alternative Price Action: Below 34,723.00 looks for further downside to 34,341.00 & 34,140.00.
Comment: Price below it 20MA & 55MA and RSI below 50 levels.
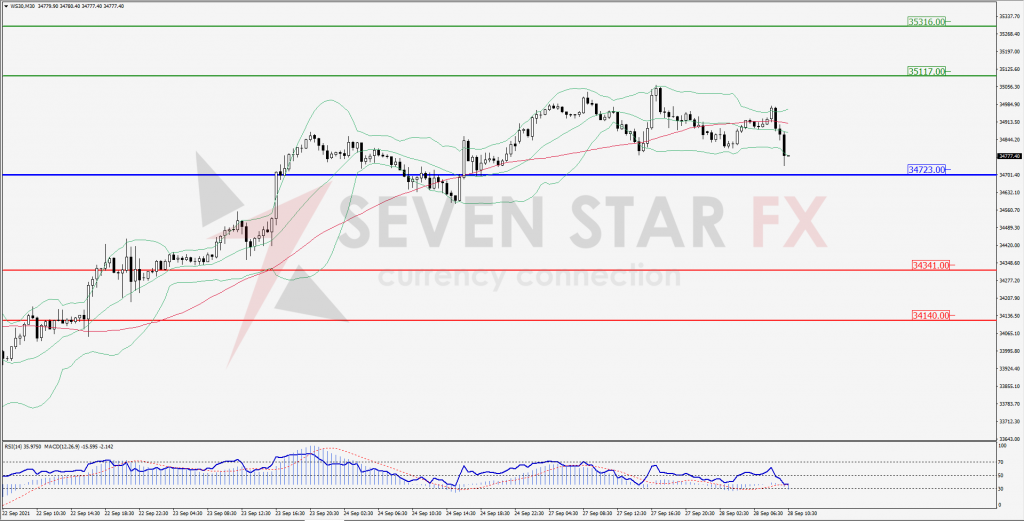
Green Lines Indicate Resistance Levels – Red Lines Indicates Support Levels
Light Blue is a Pivot Point – Black represents the price when the report was produced