Market Wrap: Stocks, Bonds, Commodities
American major stock indices ended falling on Tuesday in a broad sell-off driven by the gaining of US Treasury yields, and contentious debt burden problem on the US government in Washington.
The Dow Jones Industrial Average lost 569.38 points (1.63%) to 34,299.99; the S&P 500 decline 90.48 points (2.04%) at 4,352.63; and the Nasdaq Composite slipped 423.29 points (2.83%) to 14,546.68.
Asian major index fell on Tuesday as traders continued to fear over China Evergrande Group’s unsolved debt problem and eyed the potential impact of a widening power shortage in China.
MSCI’s index of Asia-Pacific stocks outside Japan fell 0.75% to 801.05 levels. Australian index slipped 1.08% to 7,275.60. Japanese market lost 2.12% to 29,544.29.
European stocks were higher on Wednesday, with the Stoxx Europe 50 Index rose 0.84% to 4,096.75, Germany’s DAX gained 0.92% to 15,386.10, and France’s CAC up 0.75% to 6,566.43, and U.K.’s FTSE 100 advance 0.72% to 7,079.85.
Benchmark 10-year U.S. Treasury rose as demand for safe assets grows again, today 10-year bond yields lost 0.58% to 1.527.
Crude oil declined on Tuesday after making a high of $80 per barrel for the first time in nearly three years, as a five-day rally ran out of steam with traders locking in profits.
Spot Brent crude oil fell 2.00% to $76.78 per barrel. US West Texas Intermediate crude slipped 2.05% to $73.75 a barrel.
The yellow metal traded higher 0.10% to 1739.25 dollars per ounce.
Market Wrap: Forex
The US dollar gained on Tuesday, while other pears currencies fell, as a rise in US 10 year Treasury yields made the greenback more attractive to traders.
Today, the U.S. dollar index measures the greenback against a trade-weighted basket of six major currencies, which lost 0.06% to 93.722.
The Euro US Dollar (EUR/USD) is a widely traded pair that is flat today. This left the pairing trading around $1.16770.
The Japanese yen rose against the U.S. dollar on Wednesday as the stock pushes higher. Today US/JPY down 0.10% to 111.380 level.
Another commodity-related currency mixed against the U.S dollar, AUD/USD up 0.21% to 0.72500, and NZD/USD down 0.05% to 0.69520 level.
EUR/USD Intraday: Resistance at 1.17000
Our pivot point is at 1.17000
Preferable Price Action: Take short positions below pivot level with targets at 1.16650 & 1.16460 in extension.
Alternative Price Action: above pivot looks for a further upside to 1.17360 & 1.17560.
Comment: Pair below its 20MA & 55MA and RSI below 50 levels.
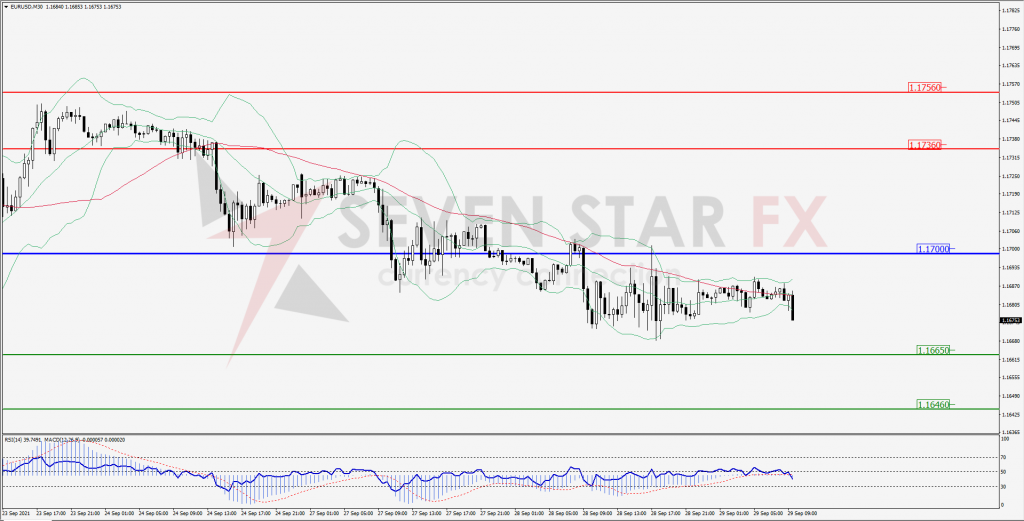
Green Lines Indicate Resistance Levels – Red Lines Indicates Support Levels
Light Blue is a Pivot Point – Black represents the price when the report was produced
GBP/USD Intraday: Trend on the downside
Our pivot point is at 1.35900
Preferable Price Action: Sell positions below pivot with targets at 1.35080 & 1.34650 in extension.
Alternative Price Action: The price above pivot would call for further upside to 1.36680 & 1.37140.
Comment: Pair below its 55MA & 20MA and RSI below 50 levels.
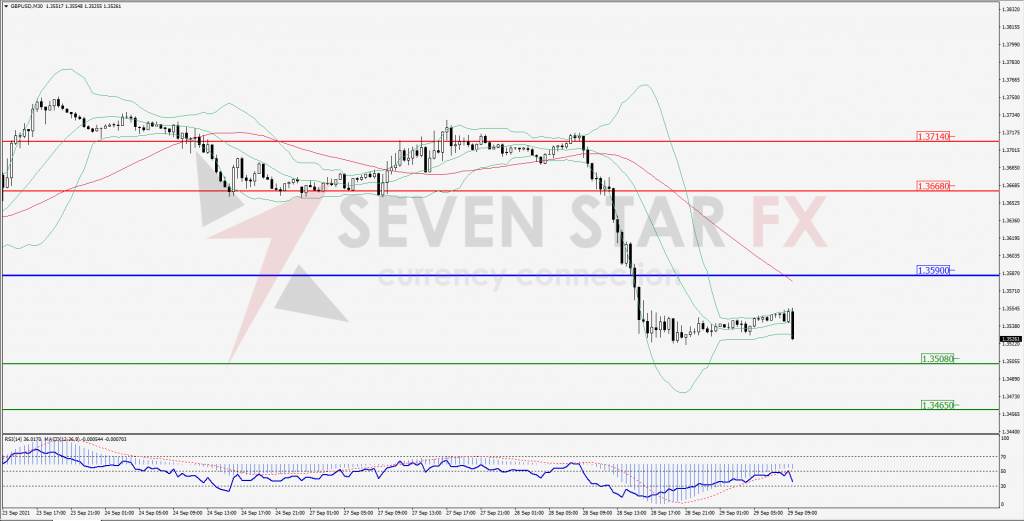
Green Lines Indicate Resistance Levels – Red Lines Indicates Support Levels
Light Blue is a Pivot Point – Black represents the price when the report was produced
USD/JPY Intraday: Strong trend on the upside
Our pivot point is at 111.100
Preferable Price Action: Buy position above pivot with the target at 111.840 and 112.210 in extension.
Alternative Price Action: The downside breakout of the pivot would call for 110.350 and 109.980.
Comment: Price above its 55MA & 20MA and MACD in positive territory.
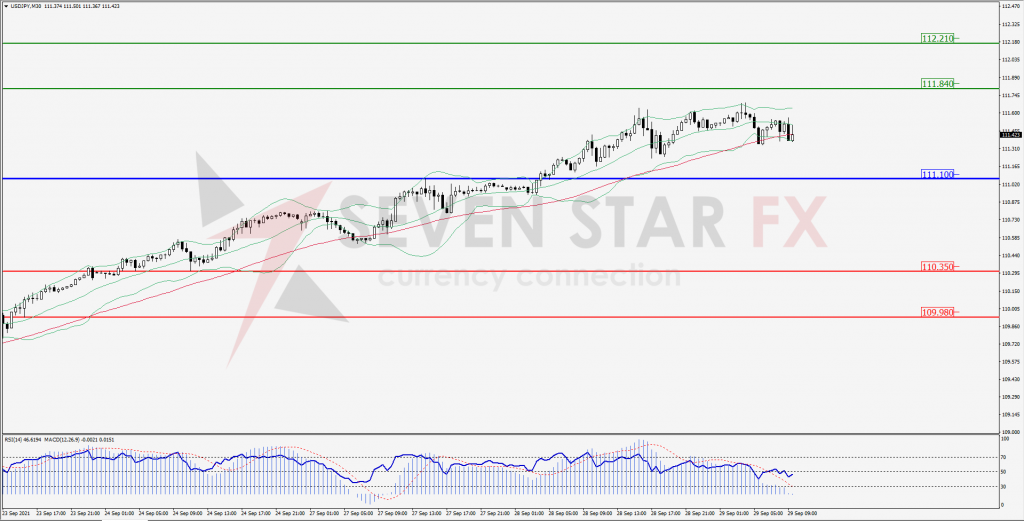
Green Lines Indicate Resistance Levels – Red Lines Indicates Support Levels
Light Blue is a Pivot Point – Black represents the price when the report was produced
AUD/USD Intraday: Resistance at 0.72650
Our pivot point is at 0.72650
Preferable Price Action: Sell Positions below pivot with targets at 0.72310 & 0.72110 in extension.
Alternative Price Action: Above pivot looks for a further upside with 0.72980 & 0.73160 as targets.
Comment: Pair below its 55MA & 20MA and RSI below 50 levels.
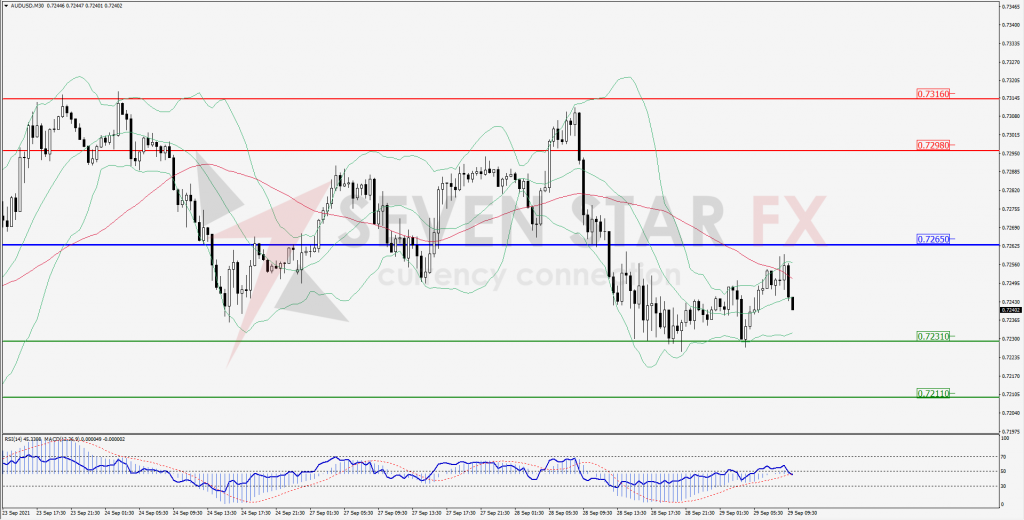
Green Lines Indicate Resistance Levels – Red Lines Indicates Support Levels
Light Blue is a Pivot Point – Black represents the price when the report was produced
CRUDEOIL Intraday: Resistance at 74.74
Our pivot point is at 74.74
Preferable Price Action: Below pivots sell Oil with 72.70 & 71.75 as targets.
Alternative Price Action: Buy crude above pivot with targets at 76.72 and 77.75 in extension.
Comment: Crude is below its 55MA & 20MA and MACD in the negative territory.
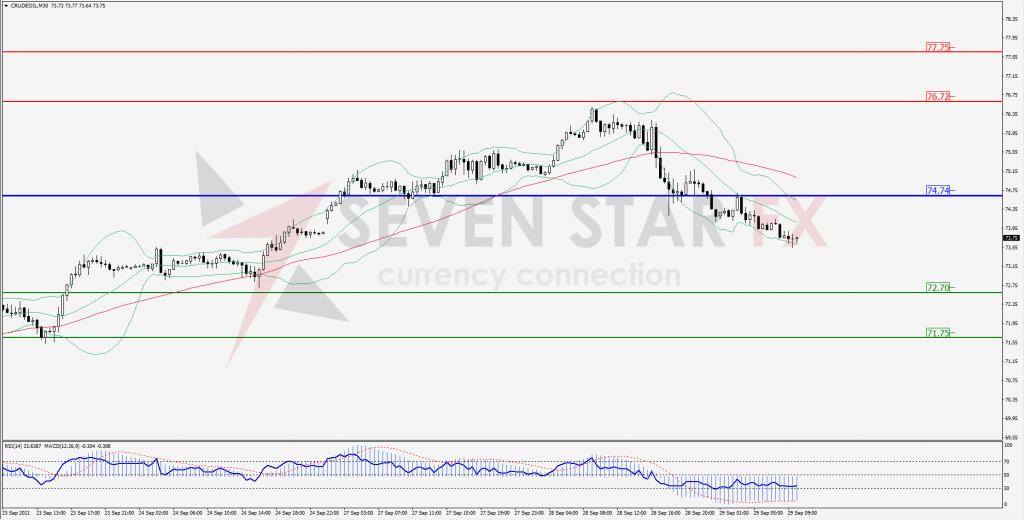
Green Lines Indicate Resistance Levels – Red Lines Indicates Support Levels
Light Blue is a Pivot Point – Black represents the price when the report was produced
XAU/USD Intraday: Trend may reverse to upside
Our pivot point is 1732.80
Preferable Price Action: Further upside to 1752.80 and 1764.20.
Alternative Price Action: If the price gives an downside breakout of a pivot, then the price extends to 1713.80 and 1702.70.
Comment: MACD in positive territory and price above its 20MA & 55MA.
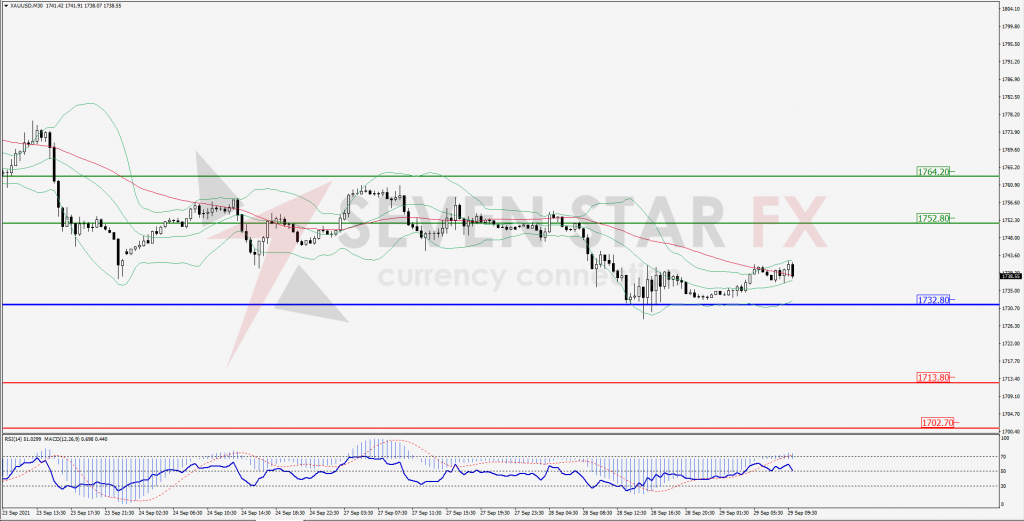
Green Lines Indicate Resistance Levels – Red Lines Indicates Support Levels
Light Blue is a Pivot Point – Black represents the price when the report was produced
Dow Jones Intraday: Break support level
Our pivot point is 34,657.00
Preferable Price Action: Take short positions below pivot with targets at 34,322.00 & 34,17000.
Alternative Price Action: Above 34,657.00 looks for further upside to 34,965.00 & 35,120.00.
Comment: Price below it 55MA and RSI below 50 levels.
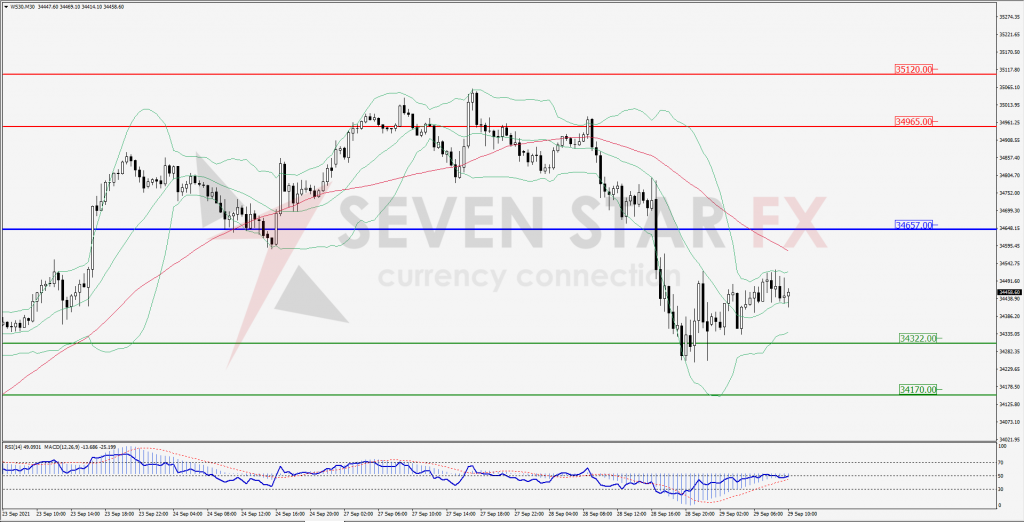
Green Lines Indicate Resistance Levels – Red Lines Indicates Support Levels
Light Blue is a Pivot Point – Black represents the price when the report was produced