Market Wrap: Stocks, Bonds, Commodities
The S&P 500 and Nasdaq closed out record finishes on Thursday, while the Dow jones also posted a modest gain, as higher commodity prices helped energy names recover ground and the latest jobs data left traders unfazed about existing positions.
The Dow Jones Industrial Average rose 131.29 points (0.37%) to 35,443.82, the S&P 500 gained 12.86 points (0.28%) to 4,536.95 and the Nasdaq Composite added 21.80 points (0.14%) to 15,331.18.
Japanese Prime Minister Yoshihide Suga said he plans to resign, a surprise decision just ahead of a vote for party leader as a general election looms.
Asian shares held their gains on Friday while the dollar was at a month low against major peers as traders awaited U.S. employment data with global shares at record highs.
MSCI’s index of Asia-Pacific stocks outside Japan rose 0.07% to 842.00 levels. Australian index gained 0.50% to 7,522.90. Japanese Nikkei jumped 2.05% to 29,128.11.
European stocks were higher on Friday, with the Stoxx Europe 50 Index fell 0.10% to 4,228.80, Germany’s DAX rose 0.07% to 15,851.40, and France’s CAC lost 0.25% to 6,746.16, and U.K.’s FTSE 100 up 0.17% to 7,175.18.
Benchmark 10-year U.S. Treasury rose as demand for safe assets grows again, today 10-year bond yields lost 0.15% to 1.292.
Oil prices rose more than USD 1 a barrel on Thursday, rebounding on optimism about the pace of global economic growth despite the coronavirus pandemic, as well as on a sharp decline in U.S. crude inventories.
Spot Brent crude oil advance 0.18% to $73.16 per barrel. US West Texas Intermediate crude fell 0.05% to $69.97 a barrel.
The yellow metal traded higher 0.20% to 1815.05 dollars per ounce.
Market Wrap: Forex
The dollar sank to its lowest in almost a month against major rivals on Friday, ahead of a crucial U.S. jobs report that could spur the Federal Reserve to an earlier tapering of stimulus.
Today, the U.S. dollar index measures the greenback against a trade-weighted basket of six major currencies, which flat to 92.227.
The Euro US Dollar (EUR/USD) is a widely traded pair flat today. This left the pairing trading around $1.18760.
The Japanese yen fell against the U.S. dollar on Friday as the stock pushes higher. Today US/JPY gained 0.10% to 110.000 level.
Another commodity-related currency higher against the U.S dollar, AUD/USD rose 0.31% to 0.74210, and NZD/USD gained 0.24% to 0.71200 level.
EUR/USD Intraday: Break Resistance level
Our pivot point is at 1.18580
Preferable Price Action: Take long positions above pivot level with targets at 1.18960 & 1.19150 in extension.
Alternative Price Action: Below pivot looks for a further downside to 1.18190 & 1.17970.
Comment: Pair above its 55MA & 20MA and RSI above 50 levels.
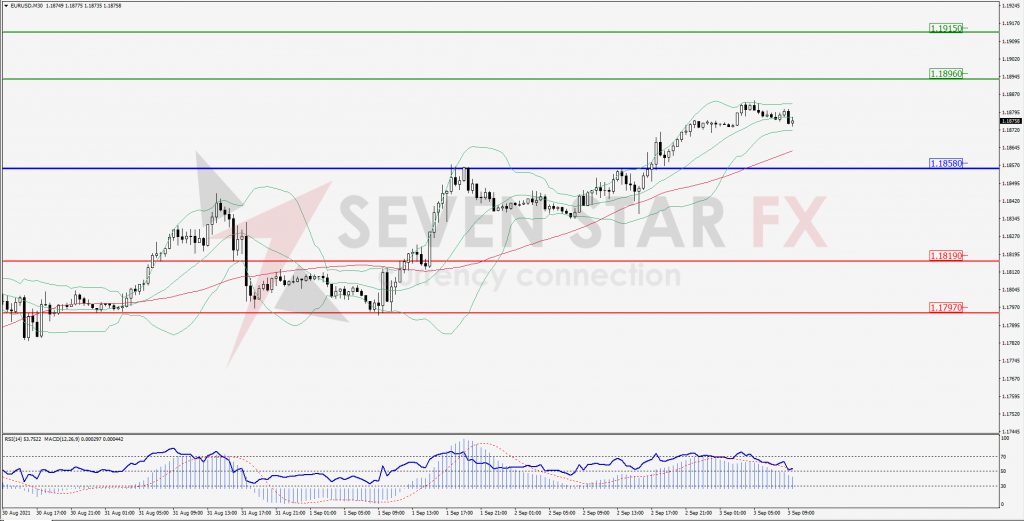
Green Lines Indicate Resistance Levels – Red Lines Indicates Support Levels
Light Blue is a Pivot Point – Black represents the price when the report was produced
GBP/USD Intraday: Support at 1.37670
Our pivot point is at 1.38080
Preferable Price Action: Buy positions above pivot with targets at 1.38550 & 1.38760 in extension.
Alternative Price Action: The price below pivot would call for further downside to 1.37650 & 1.37430.
Comment: Pair above its 55MA and RSI below 50 levels.
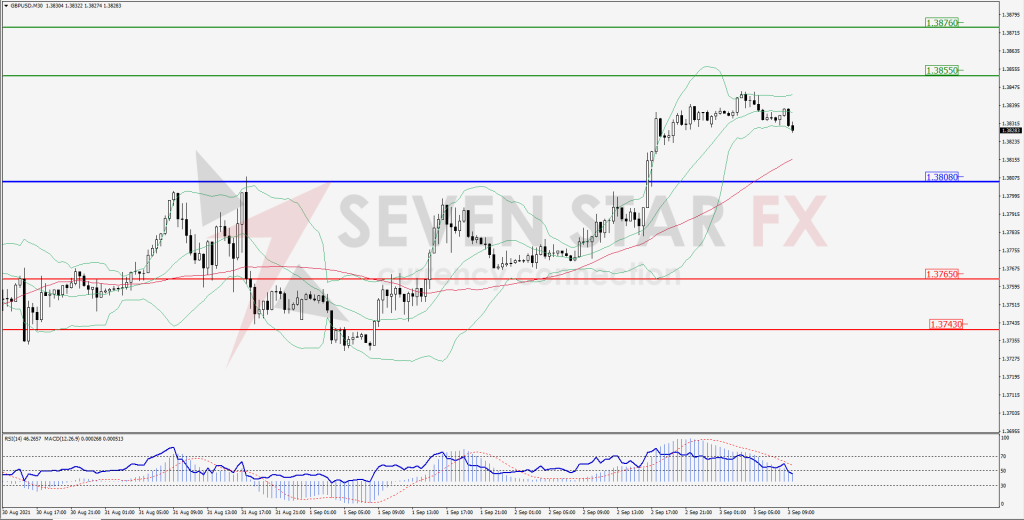
Green Lines Indicate Resistance Levels – Red Lines Indicates Support Levels
Light Blue is a Pivot Point – Black represents the price when the report was produced
USD/JPY Intraday: Support at 109.930
Our pivot point is at 109.930
Preferable Price Action: Buy position above pivot with the target at 110.130 and 110.280 in extension.
Alternative Price Action: The downside breakout of the pivot would call for 109.720 and 109.560.
Comment: Price above its 55MA & 20MA and MACD in positive territory.
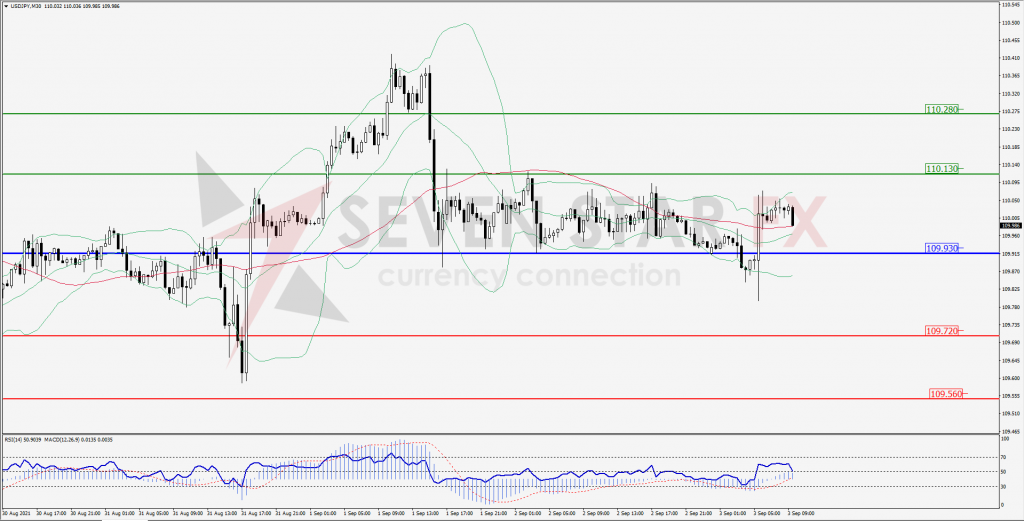
Green Lines Indicate Resistance Levels – Red Lines Indicates Support Levels
Light Blue is a Pivot Point – Black represents the price when the report was produced
AUD/USD Intraday: Strong Trend on the upside
Our pivot point is at 0.73930
Preferable Price Action: Buy Positions above pivot with targets at 0.74500 & 0.74820 in extension.
Alternative Price Action: Below pivot looks for a further downside with 0.73370 & 0.73030 as targets.
Comment: Pair above its 20MA & 55MA and RSI at overbought levels.
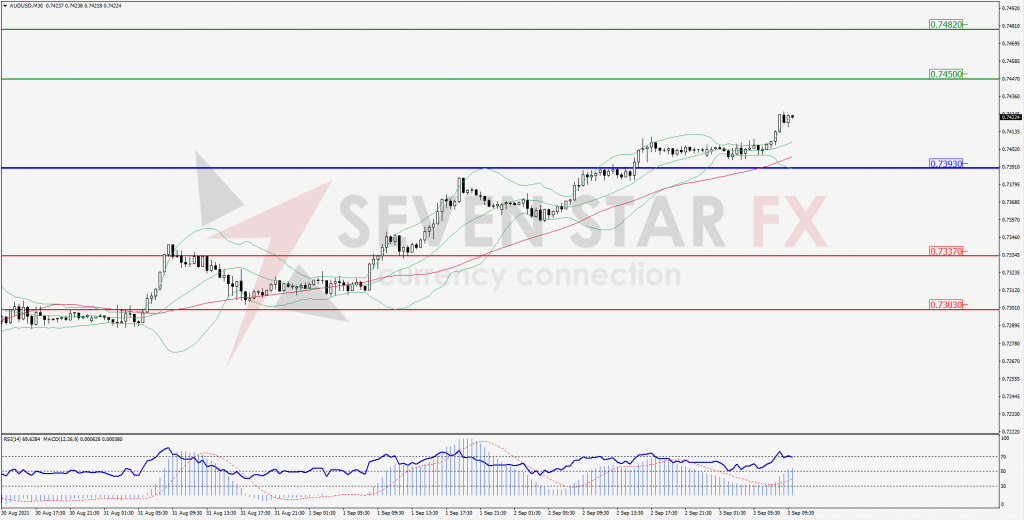
Green Lines Indicate Resistance Levels – Red Lines Indicates Support Levels
Light Blue is a Pivot Point – Black represents the price when the report was produced
CRUDEOIL Intraday: Break resistance level
Our pivot point is at 69.28
Preferable Price Action: Above pivots buy Oil with 70.43 & 71.06 as targets.
Alternative Price Action: Sell crude below pivot with targets at 68.17 and 67.51 in extension.
Comment: Crude is above its 55MA & 20MA and MACD in the positive territory.
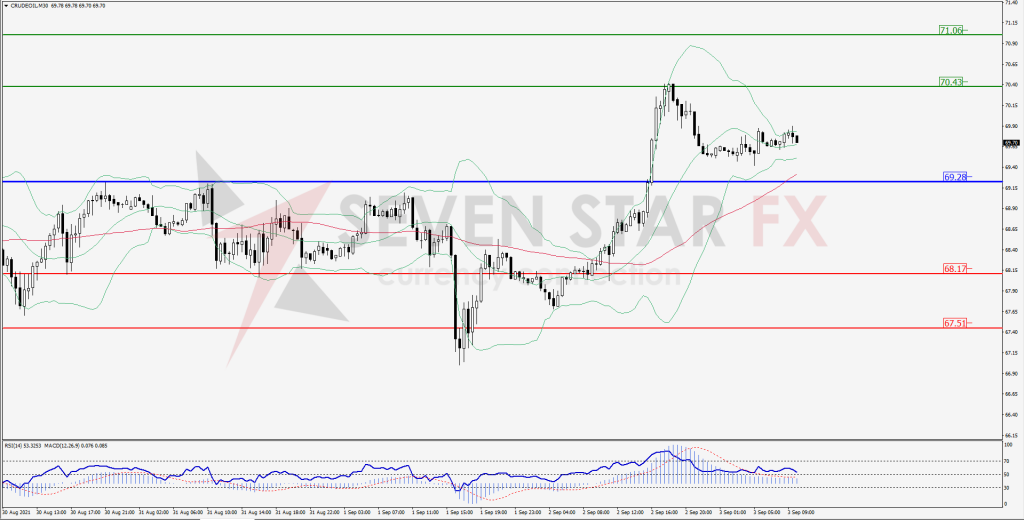
Green Lines Indicate Resistance Levels – Red Lines Indicates Support Levels
Light Blue is a Pivot Point – Black represents the price when the report was produced
XAU/USD Intraday: Support at 1809.00
Our pivot point is 1809.00
Preferable Price Action: Further upside to 1818.80 & 1824.10.
Alternative Price Action: If the price gives a downside breakout of a pivot, then the price extends to 1799.70 and 1794.60.
Comment: MACD in positive territory and price above its 55MA & 20MA.
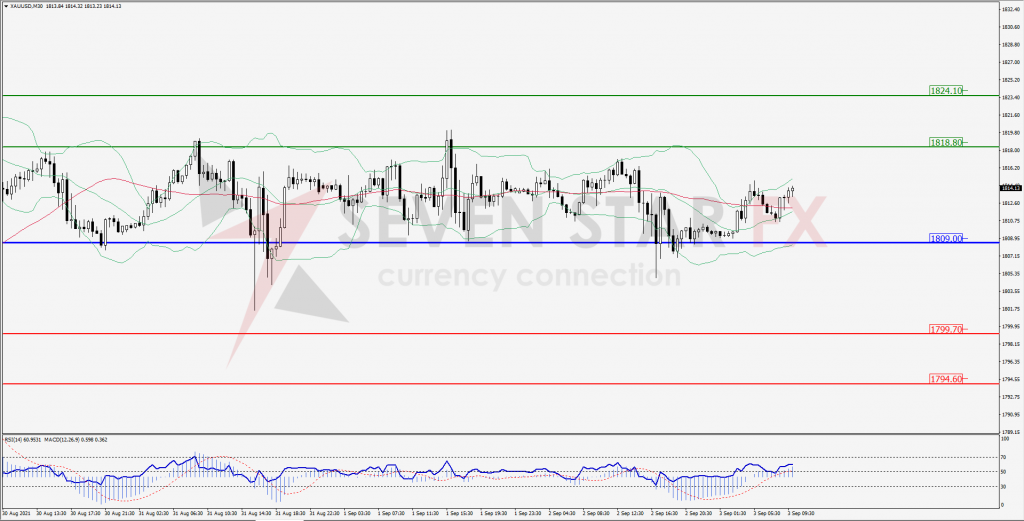
Green Lines Indicate Resistance Levels – Red Lines Indicates Support Levels
Light Blue is a Pivot Point – Black represents the price when the report was produced
Dow Jones Intraday: In a consolidation zone
Our pivot point is 35,439.00
Preferable Price Action: Take long positions above pivot with targets at 35,584.00 & 35,665.00.
Alternative Price Action: below 35,439.00 looks for further downside to 35,317.00 & 35,228.00.
Comment: Price above it 55MA and RSI above 50 levels.
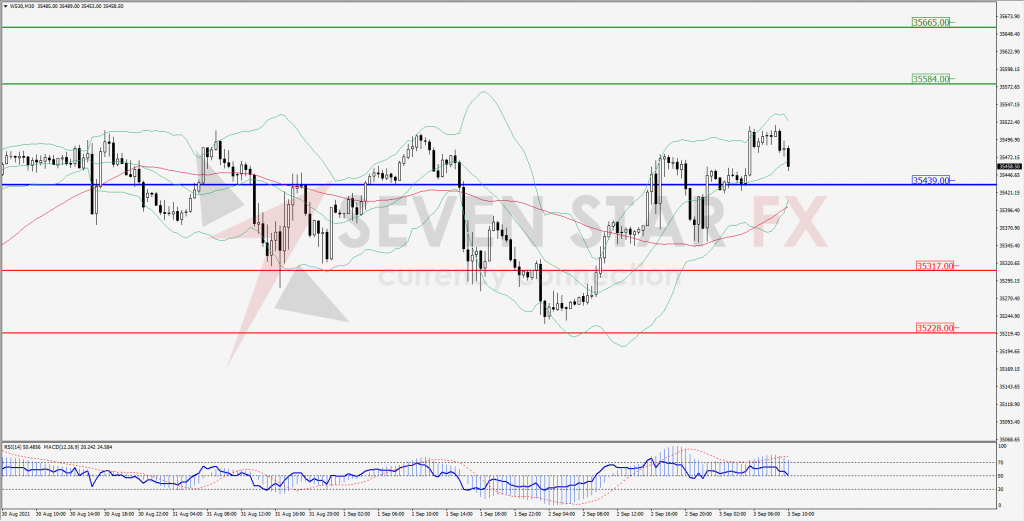
Green Lines Indicate Resistance Levels – Red Lines Indicates Support Levels
Light Blue is a Pivot Point – Black represents the price when the report was produced