Market Wrap: Stocks, Bonds, Commodities
The Nasdaq closed Wednesday at a record high, and the S&P 500 rose but just missed a fresh peak, as September kicked off with renewed buying of technology stocks and private payrolls data, which supported the case for dovish monetary policy.
The Dow Jones Industrial Average fell 48.2 points (0.14%) to 35,312.53, the S&P 500 flat to 4,524.09 and the Nasdaq Composite added 50.15 points (0.33%) to 15,309.38.
The National Weather Service issued a Flash Flood Emergency for New York City and Northeast New Jersey on Wednesday night as the remnants of Hurricane Ida pummeled the region with heavy rain.
Asian share markets were in a cautious mood on Thursday as concerns grew over the Chinese economy after a run of soft data, while the risk of a sub-par U.S. payrolls report kept the dollar on the defensive.
MSCI’s index of Asia-Pacific stocks outside Japan lost 0.07% to 840.16 levels. Australian index lost 0.55% to 7,485.70. Japanese Nikkei traded 0.33% higher to 28,543.51.
European stocks were higher on Wednesday, with the Stoxx Europe 50 Index advance 1.22% to 4,247.61, Germany’s DAX rose 0.73% to 15,951.35, and France’s CAC gained 1.39% to 6,773.24, and U.K.’s FTSE 100 up 0.95% to 7,187.05.
Benchmark 10-year U.S. Treasury rose as demand for safe assets grows again, today 10-year bond yields lost 0.25% to 1.299.
Oil prices fell on Thursday after OPEC+ agreed to keep its policy of gradually returning supply to the market at a time when coronavirus cases around the world are surging and many U.S. refiners, a key source of crude demand, remained offline.
Spot Brent crude oil slipped 0.21% to $71.45 per barrel. US West Texas Intermediate crude fell 0.30% to $68.39 a barrel.
The yellow metal traded higher 0.05% to 1816.75 dollars per ounce.
Market Wrap: Forex
The dollar lower around multi-week lows on Thursday, pressured by softer-than-expected U.S. labour data as traders awaited a fuller jobs report, which is expected to guide the timing of the Federal Reserve’s pullback in bond buying.
Today, the U.S. dollar index measures the greenback against a trade-weighted basket of six major currencies, which flat to 92.468.
The Euro US Dollar (EUR/USD) is a widely traded pair that rose 0.07% today. This left the pairing trading around $1.18440.
The Japanese yen fell against the U.S. dollar on Thursday as the stock pushes higher. Today US/JPY gained 0.05% to 110.020 level.
Another commodity-related currency higher against the U.S dollar, AUD/USD rose 0.29% to 0.73820, and NZD/USD gained 0.16% to 0.70780 level.
EUR/USD Intraday: Break Resistance level
Our pivot point is at 1.18300
Preferable Price Action: Take long positions above pivot level with targets at 1.18600 & 1.18780 in extension.
Alternative Price Action: Below pivot looks for a further downside to 1.17960 & 1.17760.
Comment: Pair above its 55MA & 20MA and RSI above 50 levels.
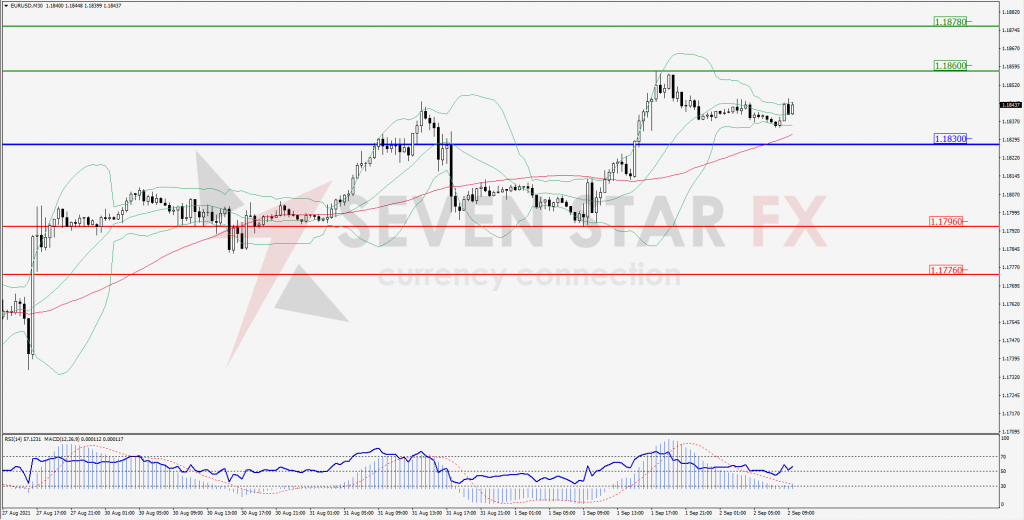
Green Lines Indicate Resistance Levels – Red Lines Indicates Support Levels
Light Blue is a Pivot Point – Black represents the price when the report was produced
GBP/USD Intraday: Support at 1.37670
Our pivot point is at 1.37670
Preferable Price Action: Buy positions above pivot with targets at 1.38020 & 1.38220 in extension.
Alternative Price Action: The price below pivot would call for further downside to 1.37330 & 1.37140.
Comment: Pair above its 20MA & 55MA and RSI above 50 levels.
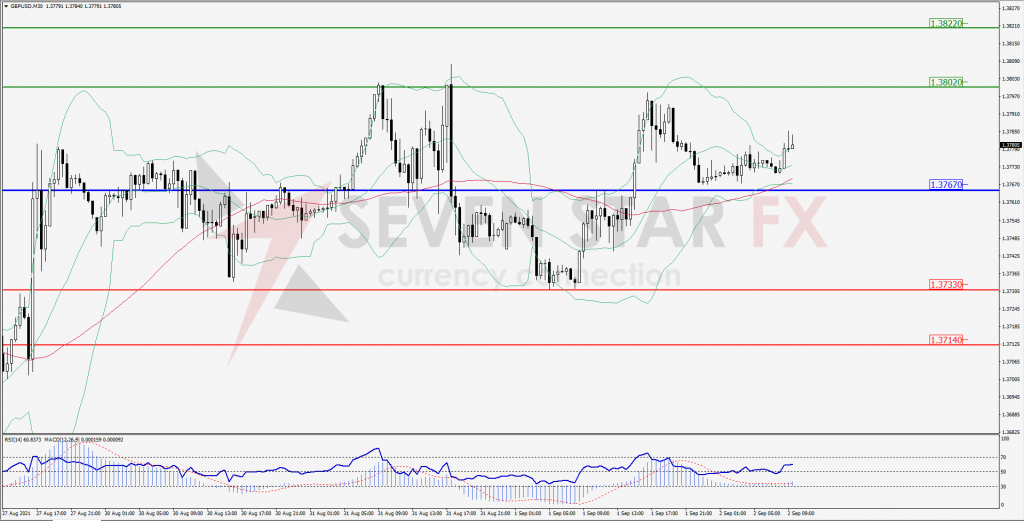
Green Lines Indicate Resistance Levels – Red Lines Indicates Support Levels
Light Blue is a Pivot Point – Black represents the price when the report was produced
USD/JPY Intraday: Resistance at 110.180
Our pivot point is at 110.180
Preferable Price Action: Sell position below pivot with the target at 109.880 and 109.710 in extension.
Alternative Price Action: The upside breakout of the pivot would call for 110.460 and 110.620.
Comment: Price below its 55MA and MACD in negative territory.
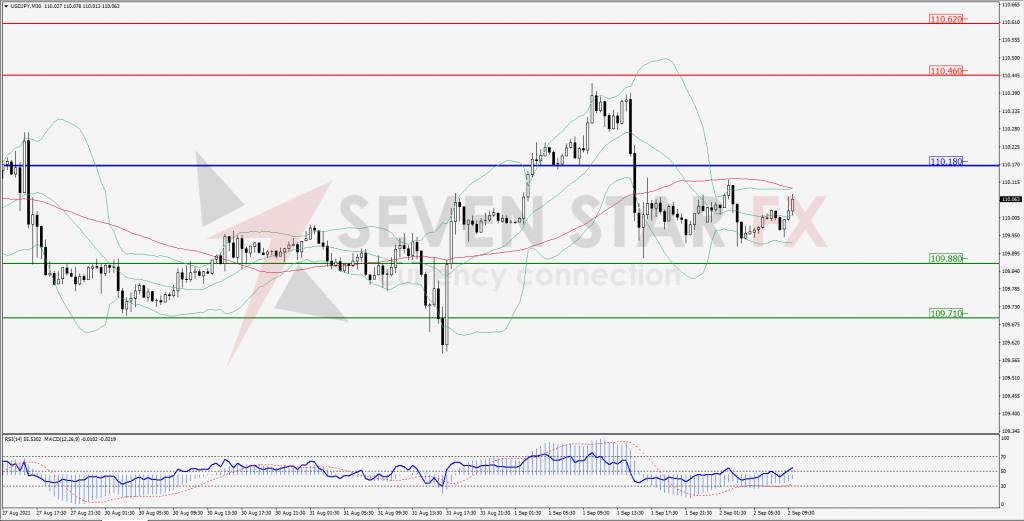
Green Lines Indicate Resistance Levels – Red Lines Indicates Support Levels
Light Blue is a Pivot Point – Black represents the price when the report was produced
AUD/USD Intraday: Strong Trend on the upside
Our pivot point is at 0.73490
Preferable Price Action: Buy Positions above pivot with targets at 0.74030 & 0.74310 in extension.
Alternative Price Action: Below pivot looks for a further downside with 0.72960 & 0.72670 as targets.
Comment: Pair above its 20MA & 55MA and RSI at overbought levels.
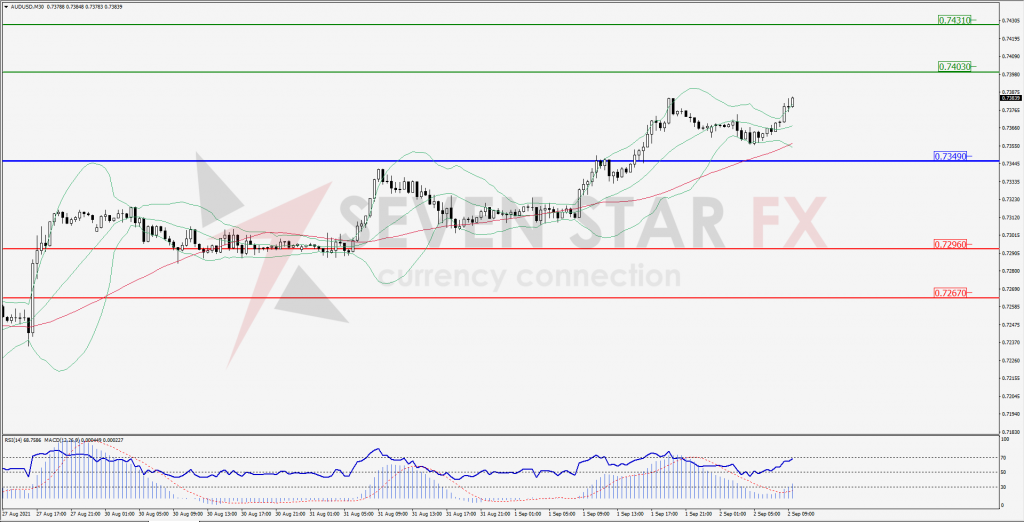
Green Lines Indicate Resistance Levels – Red Lines Indicates Support Levels
Light Blue is a Pivot Point – Black represents the price when the report was produced
CRUDEOIL Intraday: In a consolidation zone
Our pivot point is at 67.68
Preferable Price Action: Above pivots buy Oil with 69.13 & 69.94 as targets.
Alternative Price Action: Sell crude below pivot with targets at 66.27 and 65.52 in extension.
Comment: Crude is above its 55MA & 20MA and MACD in the positive territory.
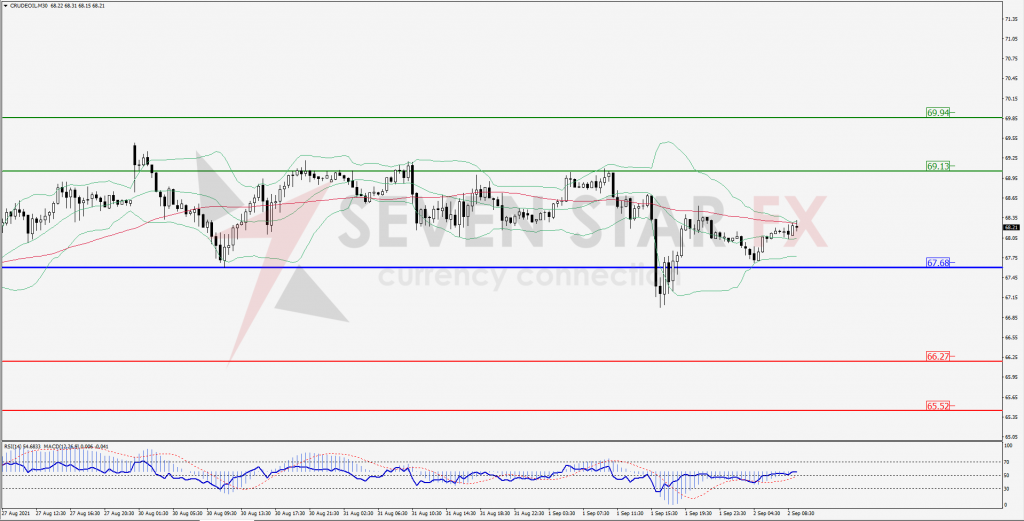
Green Lines Indicate Resistance Levels – Red Lines Indicates Support Levels
Light Blue is a Pivot Point – Black represents the price when the report was produced
XAU/USD Intraday: Support at 1809.00
Our pivot point is 1809.00
Preferable Price Action: Further upside to 1821.20 & 1827.50.
Alternative Price Action: If the price gives a downside breakout of a pivot, then the price extends to 1797.50 and 1790.80.
Comment: MACD in flat territory and price above its 55MA & 20MA.
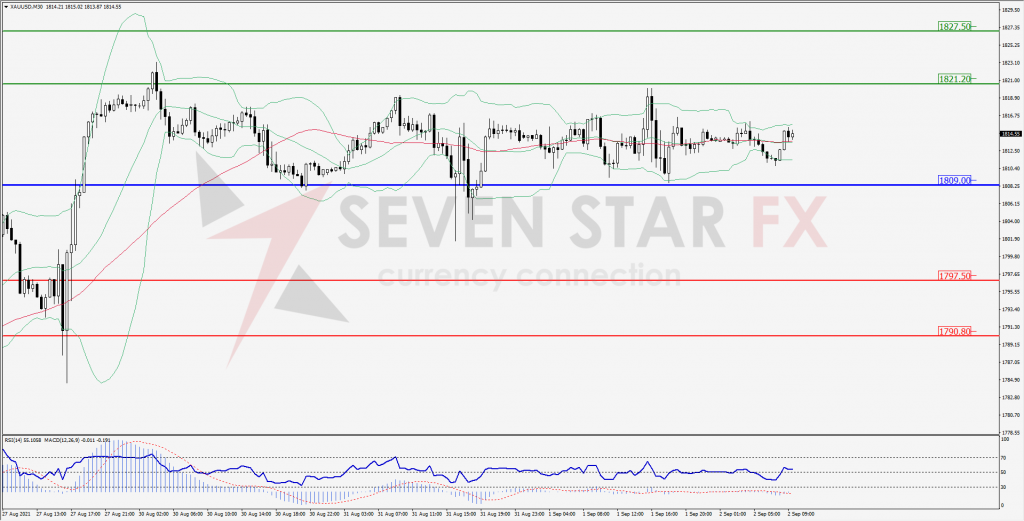
Green Lines Indicate Resistance Levels – Red Lines Indicates Support Levels
Light Blue is a Pivot Point – Black represents the price when the report was produced
Dow Jones Intraday: In a consolidation zone
Our pivot point is 35,352.00
Preferable Price Action: Take short positions below pivot with targets at 35,216.00 & 35,143.00.
Alternative Price Action: above 35,352.00 looks for further upside to 35,486.00 & 35,561.00.
Comment: Price above its 20MA & 55MA and RSI above 50 levels.
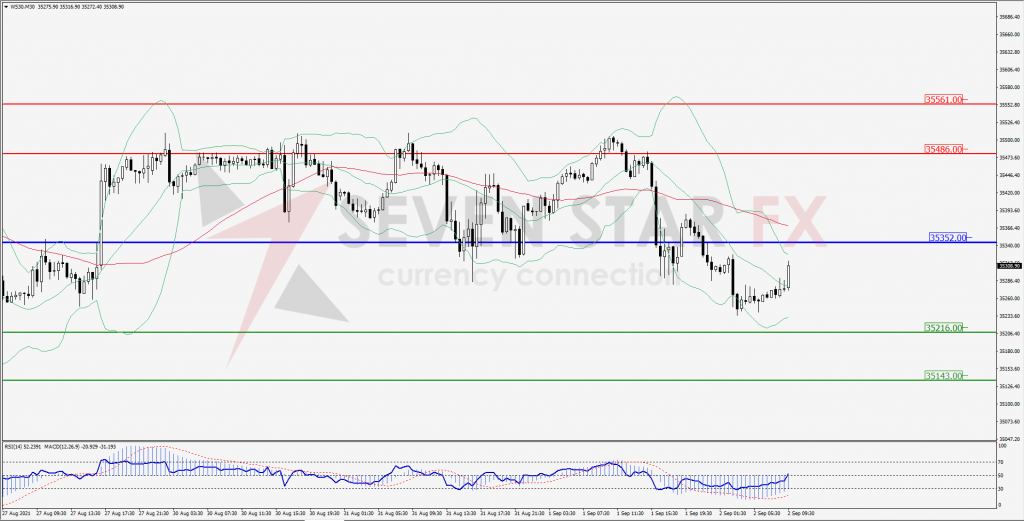
Green Lines Indicate Resistance Levels – Red Lines Indicates Support Levels
Light Blue is a Pivot Point – Black represents the price when the report was produced