Market Wrap: Stocks, Bonds, Commodities
The Nasdaq closed Friday at a fresh record but Wall Street’s main indexes headed into the Labor Day weekend in mixed fashion, reacting to a disappointing U.S. jobs report which raised fears about the pace of economic recovery but weakened the argument for near-term tapering.
The Dow Jones Industrial Average fell 74.47 points (0.21%) to 35,369.35, the S&P 500 index flat to 4,535.54 and the Nasdaq Composite added 32.34 points (0.21%) to 15,363.52.
Asian shares got off to a mixed start on Monday as a disappointing U.S. payrolls report promised to keep policy there super-loose for longer, but also clouded the outlook for global growth and inflation.
MSCI’s index of Asia-Pacific stocks outside Japan rose 0.07% to 842.00 levels. Australian index gained 0.50% to 7,522.90. Japanese Nikkei jumped 2.05% to 29,128.11.
European stocks were higher on Monday, with the Stoxx Europe 50 Index fell 0.10% to 4,228.80, Germany’s DAX rose 0.07% to 15,851.40, and France’s CAC lost 0.25% to 6,746.16, and U.K.’s FTSE 100 up 0.17% to 7,175.18.
Benchmark 10-year U.S. Treasury rose as demand for safe assets grows again, today 10-year bond yields lost 0.15% to 1.292.
Oil prices extended losses on Monday, falling more than 1%, after the world’s top exporter Saudi Arabia slashed crude prices for Asia over the weekend, signaling demand concerns and that global markets are well supplied.
Spot Brent crude oil advance 0.18% to $73.16 per barrel. US West Texas Intermediate crude fell 0.05% to $69.97 a barrel.
The yellow metal traded lower 0.35% to 1827.30 dollars per ounce.
Market Wrap: Forex
The dollar languished near a one-month low versus major peers on Monday, as investors pushed back expectations for when the Federal Reserve will begin tapering its massive stimulus.
Today, the U.S. dollar index measures the greenback against a trade-weighted basket of six major currencies, which rose 0.22% to 92.240.
The Euro US Dollar (EUR/USD) is a widely traded pair fell today. This left the pairing trading around $1.18650.
The Japanese yen fell against the U.S. dollar on Monday as the stock pushes higher. Today US/JPY gained 0.13% to 109.860 level.
Another commodity-related currency lower against the U.S dollar, AUD/USD lost 0.30% to 0.74360, and NZD/USD fell 0.26% to 0.71390 level.
EUR/USD Intraday: Resistance at 1.18900
Our pivot point is at 1.18900
Preferable Price Action: Take short positions below pivot level with targets at 1.18560 & 1.18380 in extension.
Alternative Price Action: Above pivot looks for a further upside to 1.19230 & 1.19410.
Comment: Pair below its 55MA & 20MA and RSI below 50 levels.
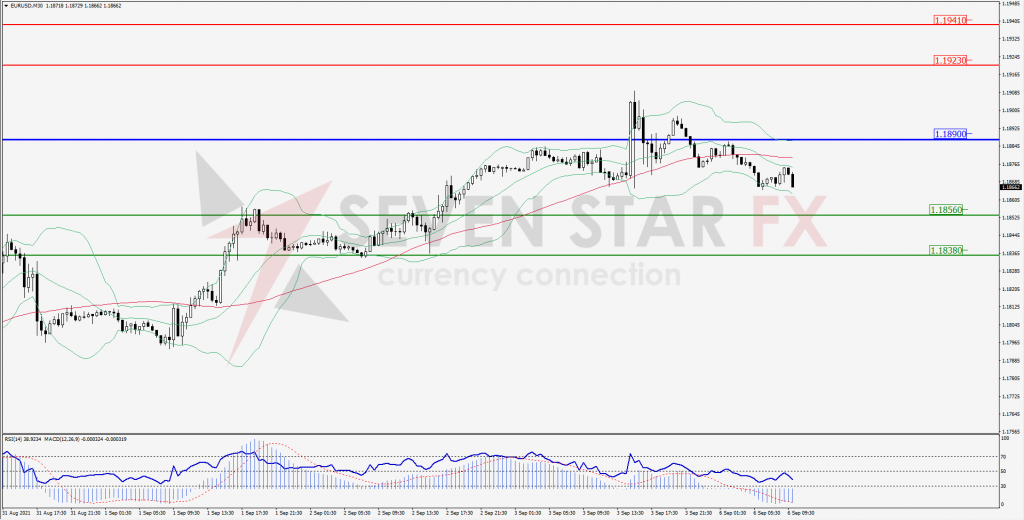
Green Lines Indicate Resistance Levels – Red Lines Indicates Support Levels
Light Blue is a Pivot Point – Black represents the price when the report was produced
GBP/USD Intraday: Support at 1.38240
Our pivot point is at 1.38240
Preferable Price Action: Buy positions above pivot with targets at 1.38690 & 1.38880 in extension.
Alternative Price Action: The price below pivot would call for further downside to 1.37790 & 1.37600.
Comment: Pair below its 55MA and RSI below 50 levels.
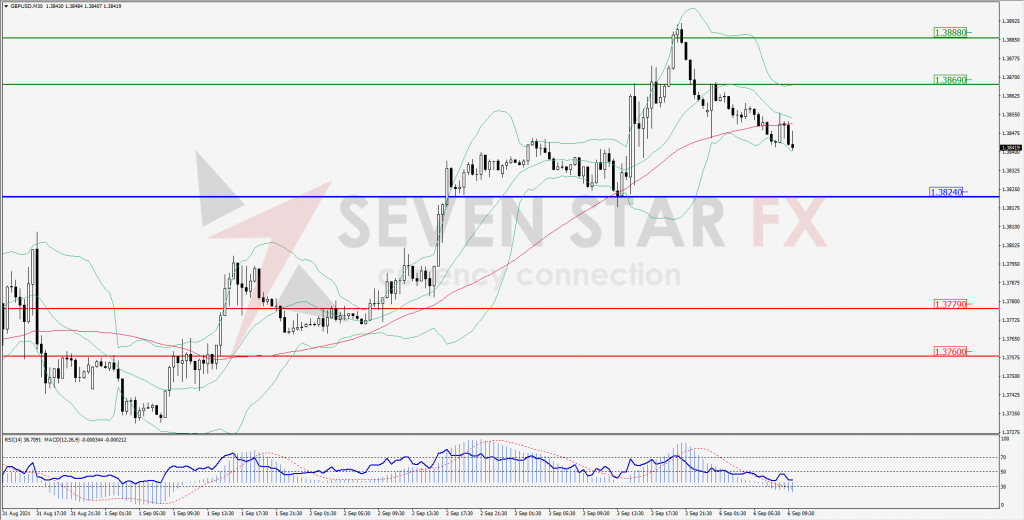
Green Lines Indicate Resistance Levels – Red Lines Indicates Support Levels
Light Blue is a Pivot Point – Black represents the price when the report was produced
USD/JPY Intraday: In a consolidation zone
Our pivot point is at 109.700
Preferable Price Action: Buy position above pivot with the target at 110.000 and 110.190 in extension.
Alternative Price Action: The downside breakout of the pivot would call for 109.390 and 109.200.
Comment: Price above its 55MA & 20MA and MACD in positive territory.
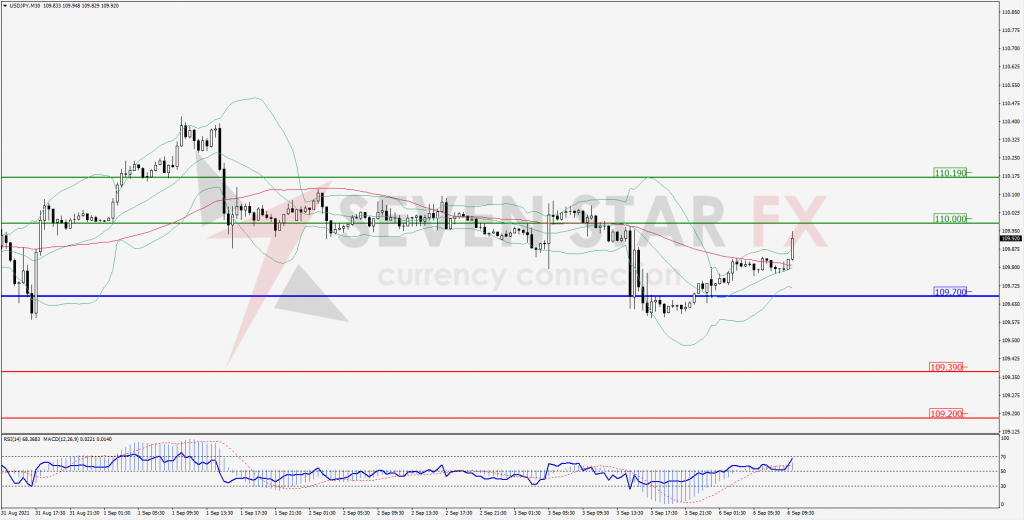
Green Lines Indicate Resistance Levels – Red Lines Indicates Support Levels
Light Blue is a Pivot Point – Black represents the price when the report was produced
AUD/USD Intraday: Strong Trend on the upside
Our pivot point is at 0.74080
Preferable Price Action: Buy Positions above pivot with targets at 0.74590 & 0.74780 in extension.
Alternative Price Action: Below pivot looks for a further downside with 0.73610 & 0.73420 as targets.
Comment: Pair above its 20MA & 55MA and RSI at 50 levels.
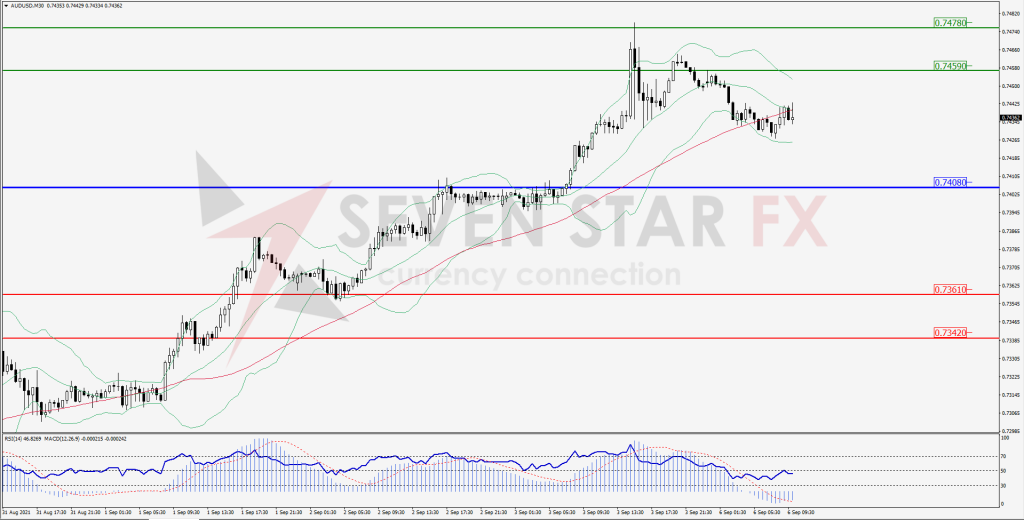
Green Lines Indicate Resistance Levels – Red Lines Indicates Support Levels
Light Blue is a Pivot Point – Black represents the price when the report was produced
CRUDEOIL Intraday: Resistance at 68.96
Our pivot point is at 68.96
Preferable Price Action: Below pivots sell Oil with 67.58 & 66.80 as targets.
Alternative Price Action: Buy crude above pivot with targets at 70.32 and 71.12 in extension.
Comment: Crude is below its 55MA & 20MA and MACD in the negative territory.
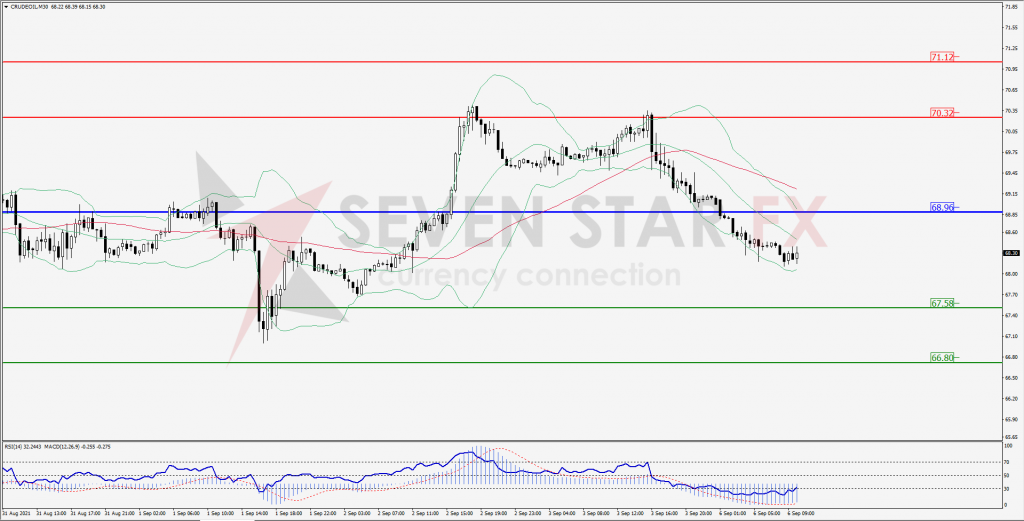
Green Lines Indicate Resistance Levels – Red Lines Indicates Support Levels
Light Blue is a Pivot Point – Black represents the price when the report was produced
XAU/USD Intraday: Break resistance levels
Our pivot point is 1823.30
Preferable Price Action: Further upside to 182.80 & 1838.50.
Alternative Price Action: If the price gives a downside breakout of a pivot, then the price extends to 1813.50 and 1808.10.
Comment: MACD in positive territory and price above its 55MA & 20MA.
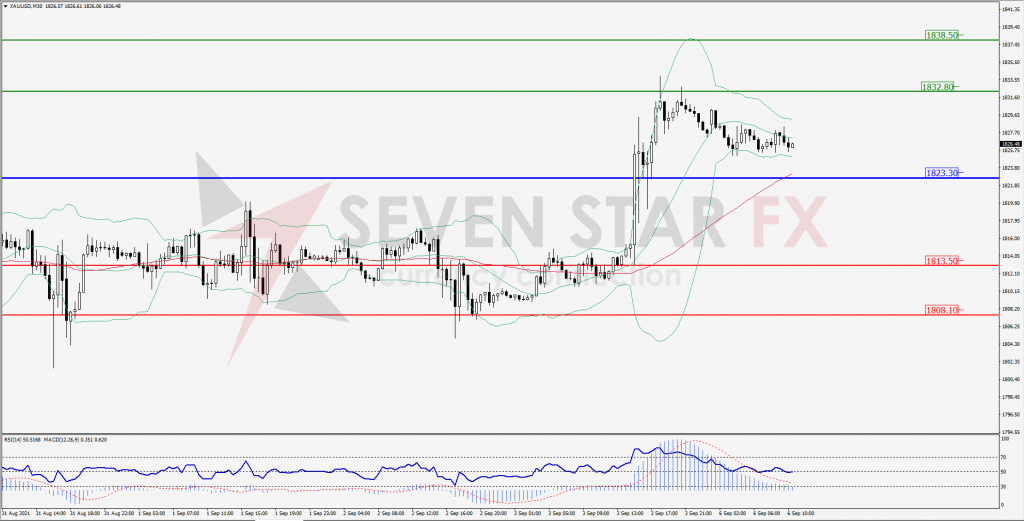
Green Lines Indicate Resistance Levels – Red Lines Indicates Support Levels
Light Blue is a Pivot Point – Black represents the price when the report was produced
Dow Jones Intraday: In a consolidation zone
Our pivot point is 35,362.00
Preferable Price Action: Take long positions above pivot with targets at 35,476.00 & 35,534.00.
Alternative Price Action: below 35,362.00 looks for further downside to 35,254.00 & 35,196.00.
Comment: Price above it 20MA & 55MA and RSI above 50 levels.
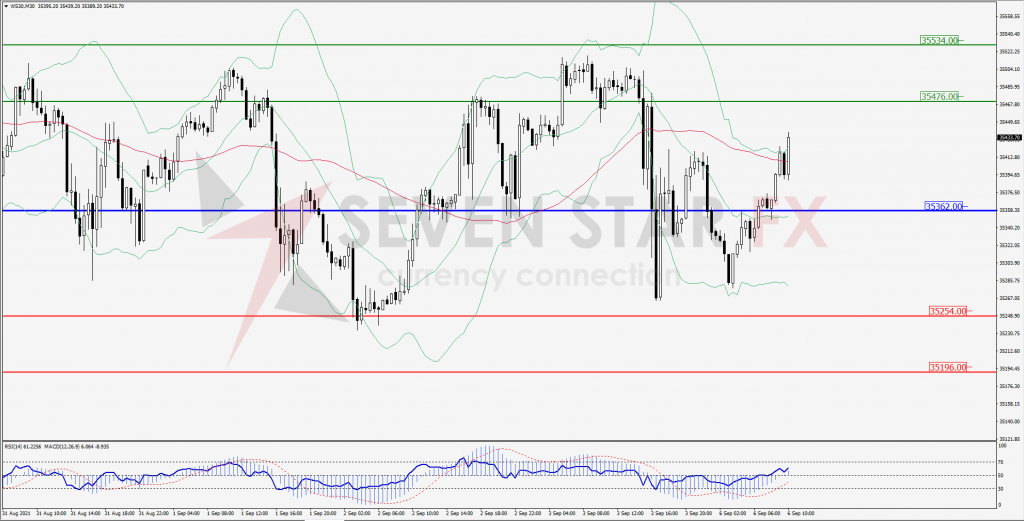
Green Lines Indicate Resistance Levels – Red Lines Indicates Support Levels
Light Blue is a Pivot Point – Black represents the price when the report was produced