Market Wrap: Stocks, Bonds, Commodities
The Dow Jones and S&P 500 jumped to record closes for a third straight day on Thursday, with mega-cap technology stocks driving the market higher as investors warmed to jobs data showing a steady U.S. economic recovery.
The Dow Jones Industrial Average rose 14.88 points (0.04%) to 35,499.85, the S&P 500 gained 13.14 points (0.30%) to 4,460.84 and the Nasdaq Composite up 51.1 points (0.35%) to 14,816.30.
Global stock markets hit record highs on Thursday while the dollar and U.S. Treasury yields edged higher, building on recent strength, as the debate continued over when the Federal Reserve will start to ease stimulus.
MSCI’s index of Asia-Pacific stocks outside Japan lost 1.02% to 820.25 levels. Australian index gained 0.54% to 7,628.90. Japanese Nikkei traded 0.14% lower to 27,977.15.
European stocks were higher on Friday, with the Stoxx Europe 50 Index flat to 4,226.15, Germany’s DAX rose 0.08% to 15,950.85, and France’s CAC up 0.16% to 6,893.73, and U.K.’s FTSE 100 up 0.29% to 7,214.15.
Benchmark 10-year U.S. Treasury rose as demand for safe assets grows again, today 10-year bond yields lost 2.19% to 1.337.
U.S. investment bank Goldman Sachs said a recent call by the United States to OPEC+ to boost oil output is unlikely to result in higher production over the short-term given the threat to demand from the coronavirus Delta variant.
Spot Brent crude oil lost 0.52% to $70.94 per barrel. US West Texas Intermediate crude slipped 0.68% to $68.62 a barrel.
The yellow metal traded 0.52% higher to 1760.85 dollars per ounce.
Market Wrap: Forex
The dollar held firm on Friday, staying near its highest level in four months against a basket of currencies as investors looked for more hints from the Federal Reserve on its plans to reduce monetary stimulus.
Today, the U.S. dollar index measures the greenback against a trade-weighted basket of six major currencies, which fell 0.07% to 92.972.
The Euro US Dollar (EUR/USD) is a widely traded pair that gained 0.06% today. This left the pairing trading around $1.17130
The Japanese yen fell against the U.S. dollar on Wednesday as the stock pushes higher. Today US/JPY rose 0.21% to 110.770 level.
Another commodity-related currency lower against the U.S dollar, AUD/USD lost 0.30% to 0.73280, and NZD/USD slipped 0.11% to 0.69970.
EUR/USD Intraday: Resistance at 1.17480
Our pivot point is at 1.17480
Preferable Price Action: Take short positions below pivot level with targets at 1.17187 & 1.17033 in extension.
Alternative Price Action: Above pivot looks for a further upside to 1.17725 & 1.17867.
Comment: Pair below its 20MA and RSI below 50 levels.
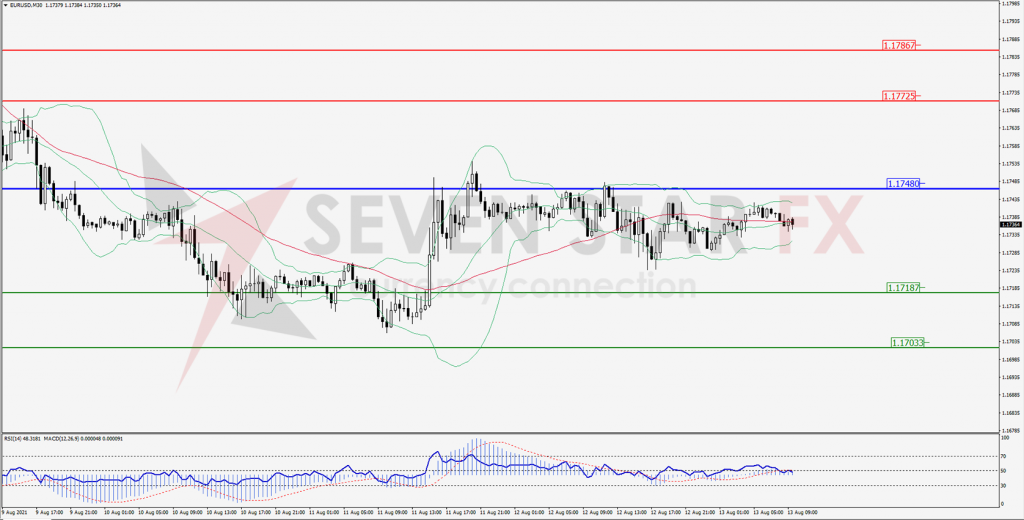
Green Lines Indicate Resistance Levels – Red Lines Indicates Support Levels
Light Blue is a Pivot Point – Black represents the price when the report was produced
GBP/USD Intraday: Trend on the downside
Our pivot point is at 1.38250
Preferable Price Action: Sell positions below pivot with targets at 1.378210 & 1.37613 in extension.
Alternative Price Action: The price above pivot would call for further upside to 1.38629 & 1.38850.
Comment: Price below its 20MA and RSI at oversold levels.
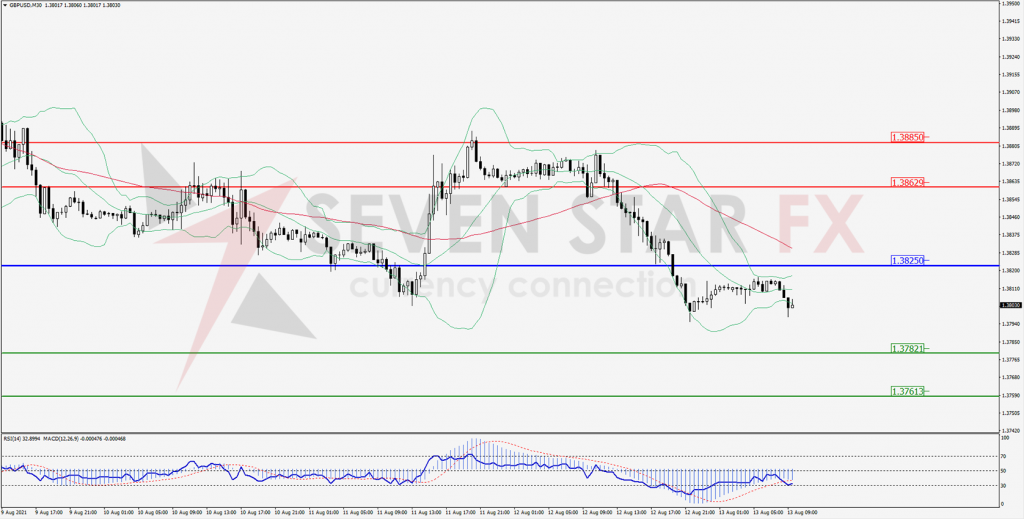
Green Lines Indicate Resistance Levels – Red Lines Indicates Support Levels
Light Blue is a Pivot Point – Black represents the price when the report was produced
USD/JPY Intraday: Resistance at 110.470
Our pivot point is at 110.470
Preferable Price Action: Sell position below pivot with the target at 110.258 and 110.157 in extension.
Alternative Price Action: The upside breakout of the pivot would call for 110.668 and 110.767.
Comment: price below its 20MA & 55MA and MACD in negative territory.
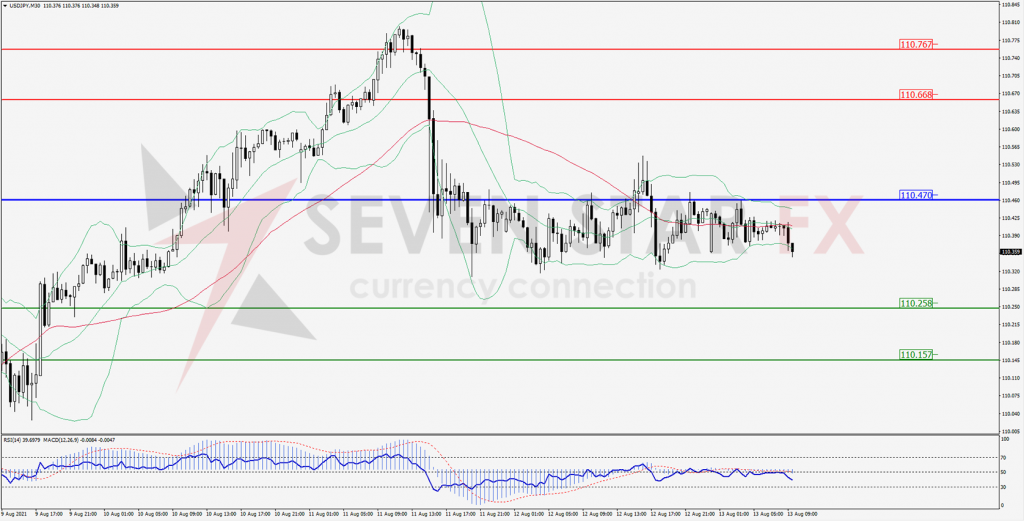
Green Lines Indicate Resistance Levels – Red Lines Indicates Support Levels
Light Blue is a Pivot Point – Black represents the price when the report was produced
AUD/USD Intraday: Support at 0.73300
Our pivot point is at 0.73300
Preferable Price Action: Buy Positions above pivot with targets at 0.73644 & 0.73869 in extension.
Alternative Price Action: Below pivot looks for a further downside with 0.72902 & 0.72720 as targets.
Comment: Pair above its 20MA and RSI at 50 levels.
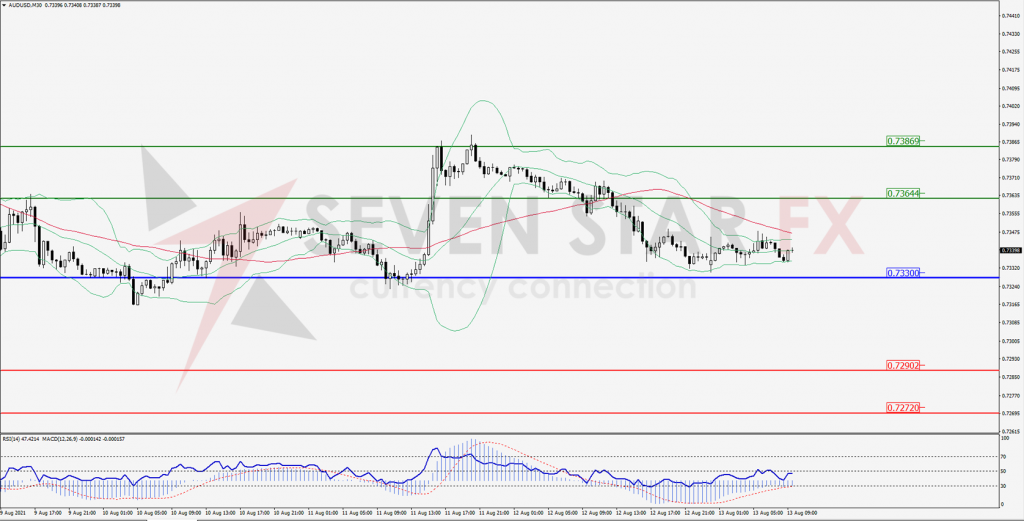
Green Lines Indicate Resistance Levels – Red Lines Indicates Support Levels
Light Blue is a Pivot Point – Black represents the price when the report was produced
CRUDEOIL Intraday: Trend may reverse to downside
Our pivot point is at 68.88
Preferable Price Action: Below pivots sell Oil with 67.23 & 66.18 as targets.
Alternative Price Action: Buy crude above pivot with targets at 70.30 and 71.26 in extension.
Comment: Crude is below its 55MA & 20MA and MACD in the negative territory.
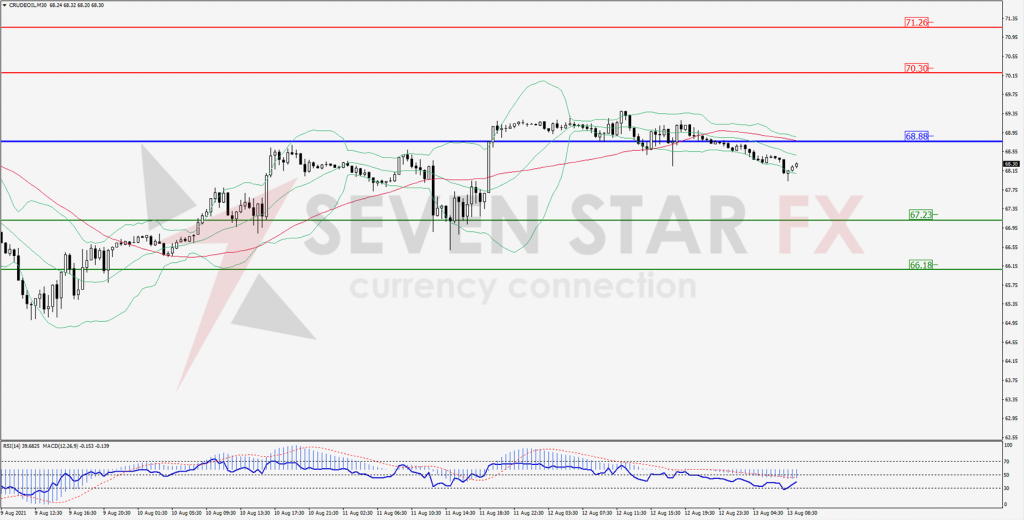
Green Lines Indicate Resistance Levels – Red Lines Indicates Support Levels
Light Blue is a Pivot Point – Black represents the price when the report was produced
XAU/USD Intraday: Support at 1749.70
Our pivot point is 1749.70
Preferable Price Action: Further upside to 1768.85 & 1778.82.
Alternative Price Action: If the price gives a downside breakout of a pivot, then the price extends to 1733.62 and 1723.32.
Comment: MACD in positive territory and price above it’s 20MA & 55MA.
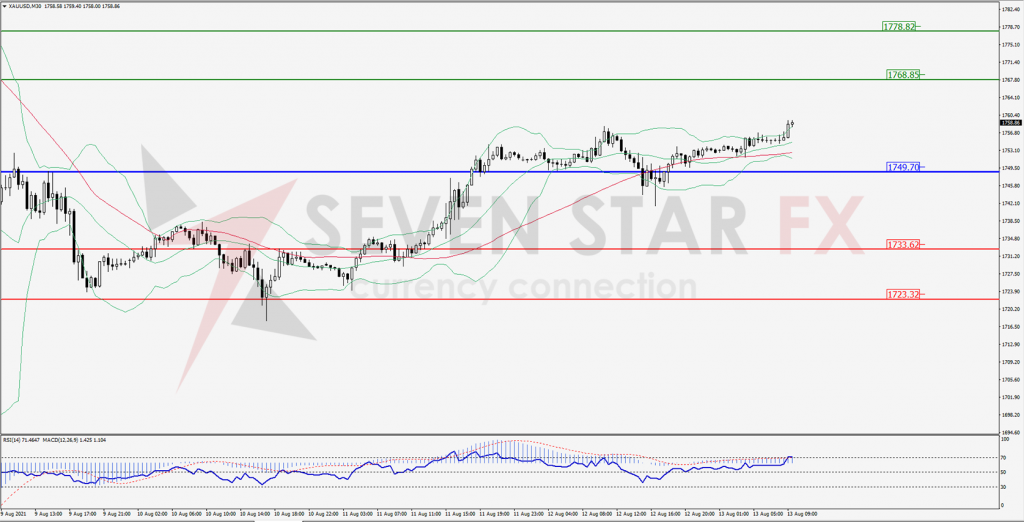
Green Lines Indicate Resistance Levels – Red Lines Indicates Support Levels
Light Blue is a Pivot Point – Black represents the price when the report was produced
Dow Jones Intraday: Trend on the upside
Our pivot point is 35,465.00
Preferable Price Action: Take long positions above pivot with targets at 35,625.00 & 35,724.00.
Alternative Price Action: below 35,465.00 looks for further downside to 35,291.00 & 35,181.00.
Comment: Price above its 55MA & 20MA and RSI above 50 levels.
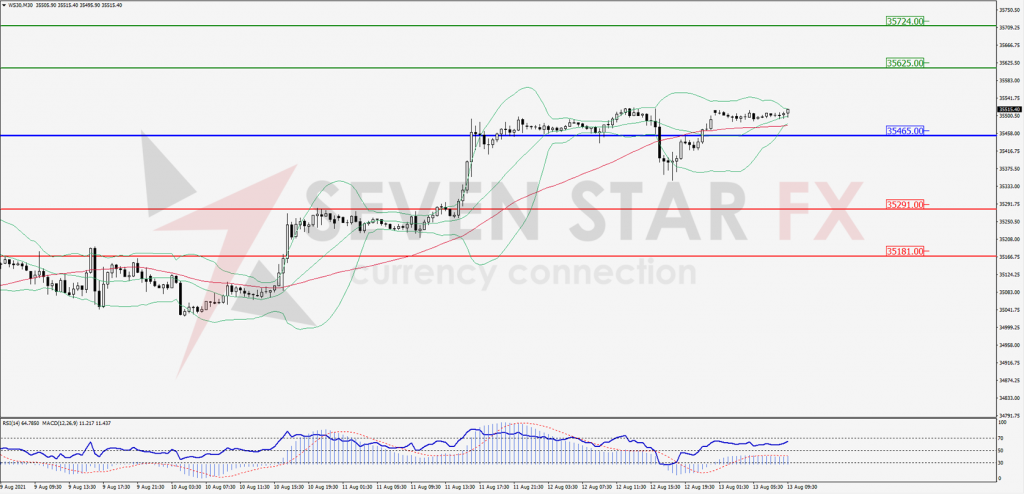
Green Lines Indicate Resistance Levels – Red Lines Indicates Support Levels
Light Blue is a Pivot Point – Black represents the price when the report was produced