Market Wrap: Stocks, Bonds, Commodities
Global shares hit record highs Wednesday after data showed U.S. consumer price increases slowed in July, easing concerns that the Federal Reserve will imminently signal a scaling back of bond purchases.
The Dow Jones Industrial Average rose 220.30 points (0.46%) to 35,264.67, the S&P 500 gained 4.40 points (0.10%) to 4,436.75 and the Nasdaq Composite droped 72.1 points (0.49%) to 14,788.10.
Asian shares failed to follow a strong close on Wall Street with fears about the spread of the Delta variant of the coronavirus weighing on sentiment even as tame U.S. inflation eased fears the Federal Reserve would rush to reduce its economic support.
MSCI’s index of Asia-Pacific stocks outside Japan lost 0.36% to 833.19 levels. Australian index gained 0.29% to 7,584.30. Japanese Nikkei traded 0.65% higher to 28,080.50.
European stocks were higher on Wednesday, with the Stoxx Europe 50 Index gained 0.10% to 4,192.13, Germany’s DAX rose 0.05% to 15,773.30, and France’s CAC up 0.18% to 6,832.50, and U.K.’s FTSE 100 up 0.27% to 7,180.50.
Benchmark 10-year U.S. Treasury rose as demand for safe assets grows again, today 10-year bond yields gained 2.28% to 1.373.
Oil prices were steady on Thursday following two days of gains after a call from the United States, the world’s top oil consumer, for major producers to boost output reinforced supply concerns as economies ease their coronavirus restrictions.
Spot Brent crude oil advance 0.10% to $70.72 per barrel. US West Texas Intermediate crude gained 0.06% to $68.33 a barrel.
The yellow metal traded 0.06% higher to 1732.85 dollars per ounce.
Market Wrap: Forex
The dollar held near a four-month peak against major peers on Thursday after retreating overnight as a cooling in consumer inflation tempered bets for an earlier tightening of U.S. monetary policy.
Today, the U.S. dollar index measures the greenback against a trade-weighted basket of six major currencies, gained 0.10% to 93.148.
The Euro US Dollar (EUR/USD) is a widely traded pair that lost 0.03% today. This left the pairing trading around $1.17130
The Japanese yen fell against the U.S. dollar on Wednesday as the stock pushes higher. Today US/JPY rose 0.21% to 110.770 level.
Another commodity-related currency lower against the U.S dollar, AUD/USD lost 0.30% to 0.73280, and NZD/USD slipped 0.11% to 0.69970.
EUR/USD Intraday: Resistance at 1.17540
Our pivot point is at 1.17540
Preferable Price Action: Take short positions below pivot level with targets at 1.17090 & 1.16840 in extension.
Alternative Price Action: Above pivot looks for a further upside to 1.18000 & 1.18260.
Comment: Pair below its 20MA and RSI below 50 levels.
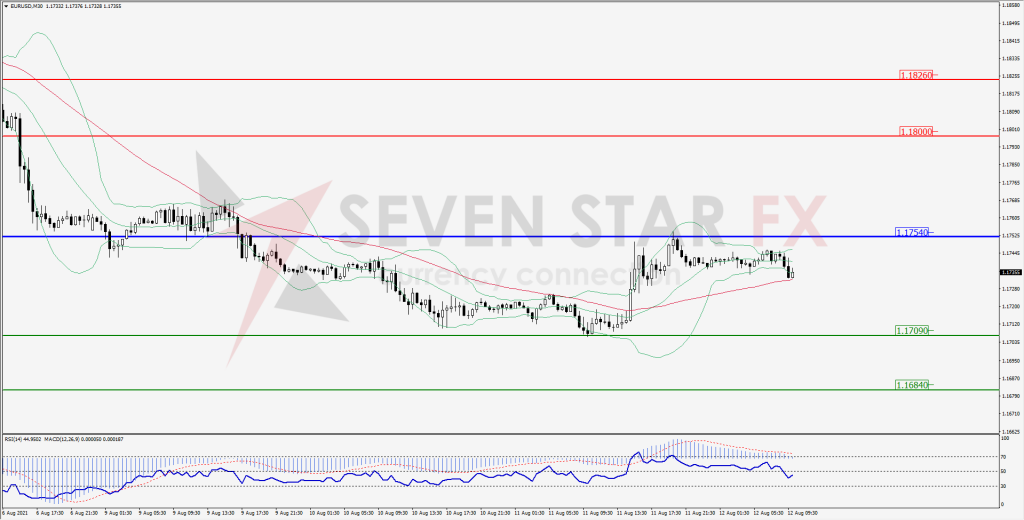
Green Lines Indicate Resistance Levels – Red Lines Indicates Support Levels
Light Blue is a Pivot Point – Black represents the price when the report was produced
GBP/USD Intraday: Support at 1.38490
Our pivot point is at 1.38490
Preferable Price Action: Buy positions above pivot with targets at 1.38910 & 1.39170 in extension.
Alternative Price Action: The price below pivot would call for further downside to 1.38070 & 1.37820.
Comment: Price below its 20MA and RSI at 50 levels.
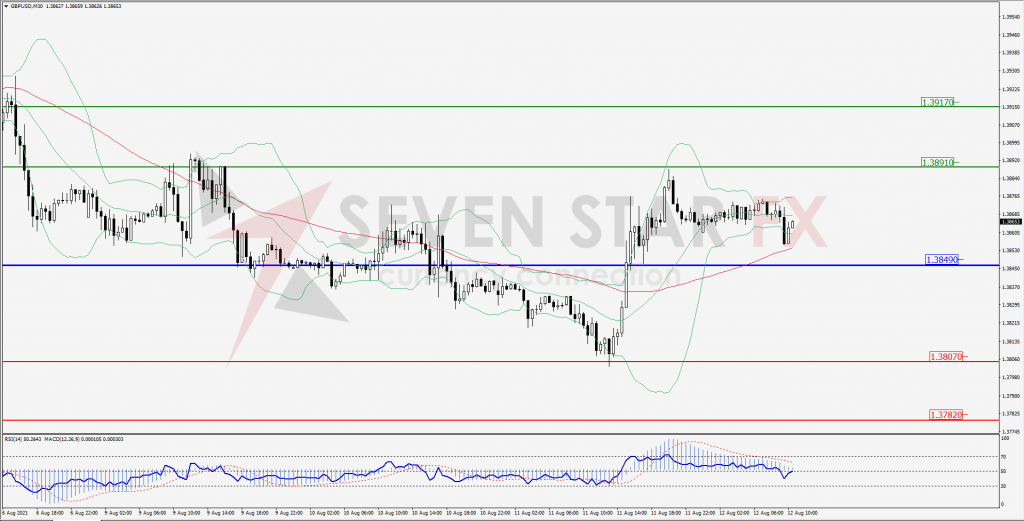
Green Lines Indicate Resistance Levels – Red Lines Indicates Support Levels
Light Blue is a Pivot Point – Black represents the price when the report was produced
USD/JPY Intraday: Trend on the upside
Our pivot point is at 110.310
Preferable Price Action: Buy position above pivot with the target at 110.640 and 110.820 in extension.
Alternative Price Action: The downside breakout of the pivot would call for 109.980 and 109.780.
Comment: price above its 20MA & 55MA and MACD in negative territory.
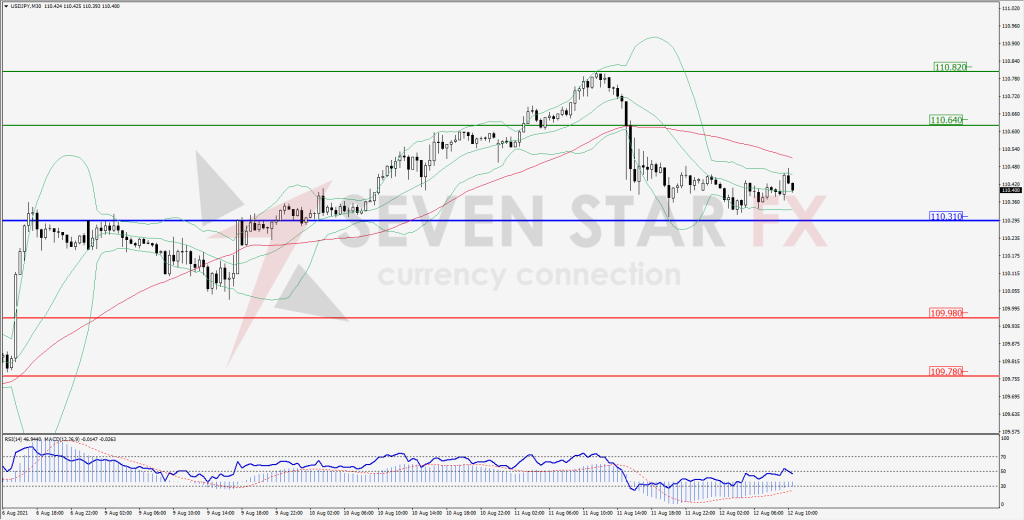
Green Lines Indicate Resistance Levels – Red Lines Indicates Support Levels
Light Blue is a Pivot Point – Black represents the price when the report was produced
AUD/USD Intraday: Trend may reverse to downside
Our pivot point is at 0.73750
Preferable Price Action: Sell Positions below pivot with targets at 0.73420 & 0.73180 in extension.
Alternative Price Action: above pivot looks for a further upside with 0.74120 & 0.74350 as targets.
Comment: Pair below its 20MA and RSI below 50 levels.
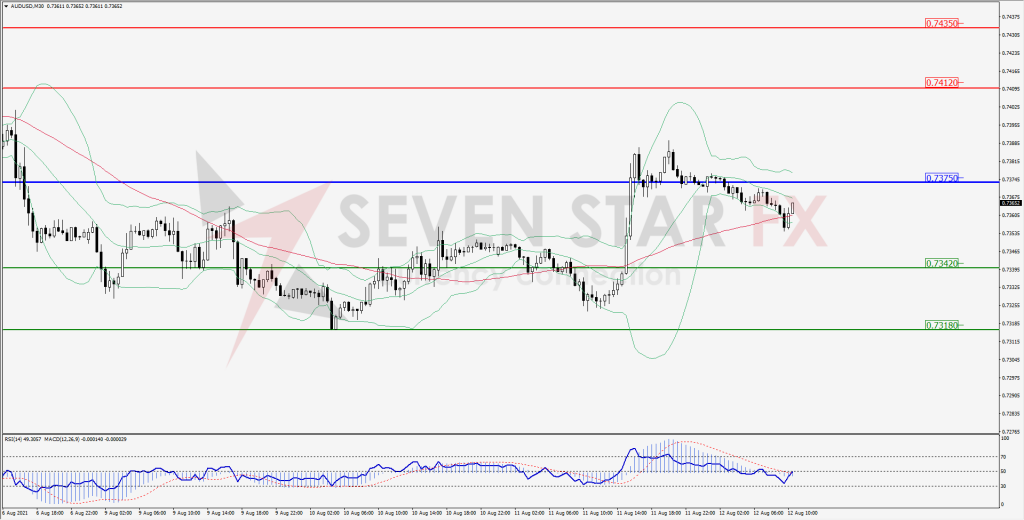
Green Lines Indicate Resistance Levels – Red Lines Indicates Support Levels
Light Blue is a Pivot Point – Black represents the price when the report was produced
CRUDEOIL Intraday: Break resistance level
Our pivot point is at 68.27
Preferable Price Action: Above pivots buy Oil with 69.49 & 70.31 as targets.
Alternative Price Action: Sell crude below pivot with targets at 67.00 and 66.20 in extension.
Comment: Crude is above its 55MA & 20MA and MACD in the positive territory.
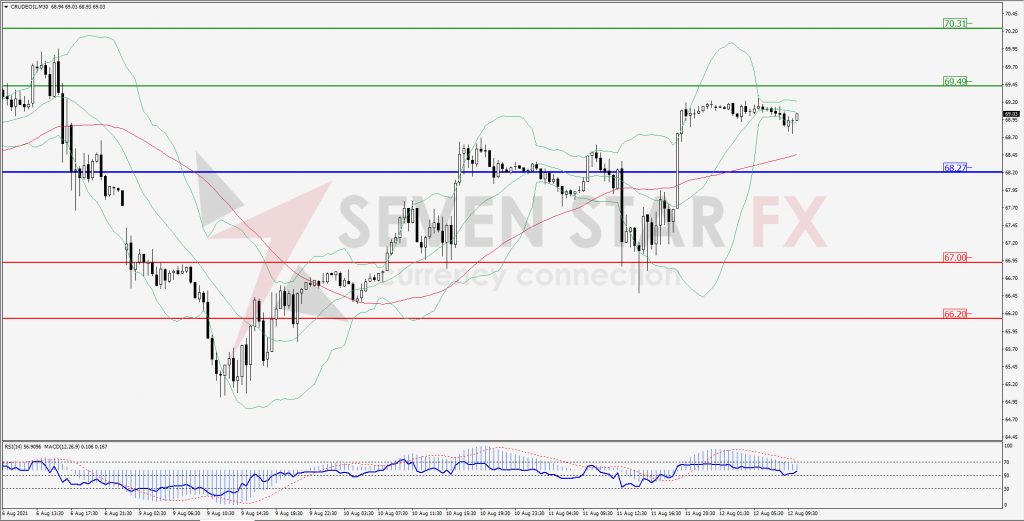
Green Lines Indicate Resistance Levels – Red Lines Indicates Support Levels
Light Blue is a Pivot Point – Black represents the price when the report was produced
XAU/USD Intraday: Support at 1740.70
Our pivot point is 1740.70
Preferable Price Action: Further upside to 1766.20 & 1783.50.
Alternative Price Action: If the price gives a downside breakout of a pivot, then the price extends to 1715.10 and 1698.30.
Comment: MACD in positive territory and price above it’s 20MA.
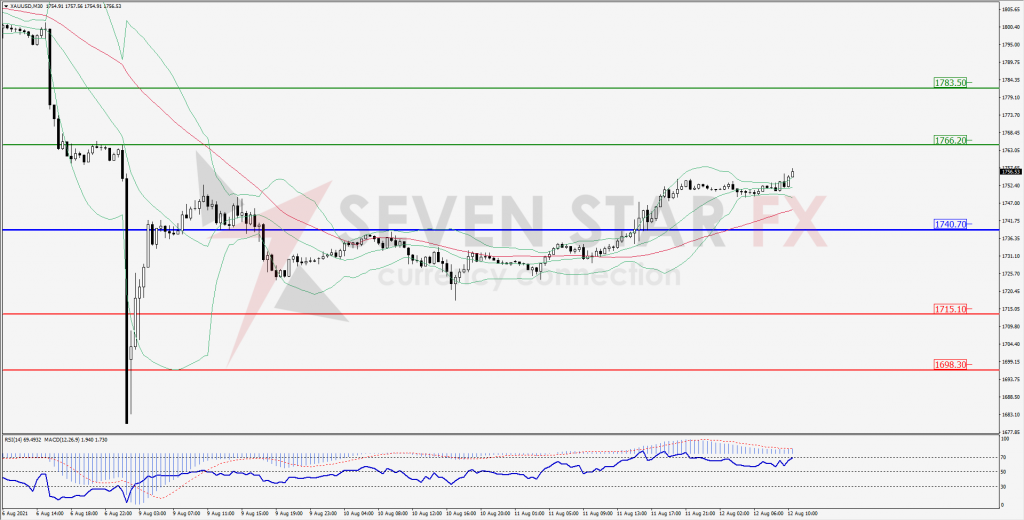
Green Lines Indicate Resistance Levels – Red Lines Indicates Support Levels
Light Blue is a Pivot Point – Black represents the price when the report was produced
Dow Jones Intraday: Trend on the upside
Our pivot point is 35,383.00
Preferable Price Action: Take long positions above pivot with targets at 35,521.00 & 35,597.00.
Alternative Price Action: below 35,383.00 looks for further downside to 35,239.00 & 34,160.00.
Comment: Price above its 55MA and RSI above 50 levels.
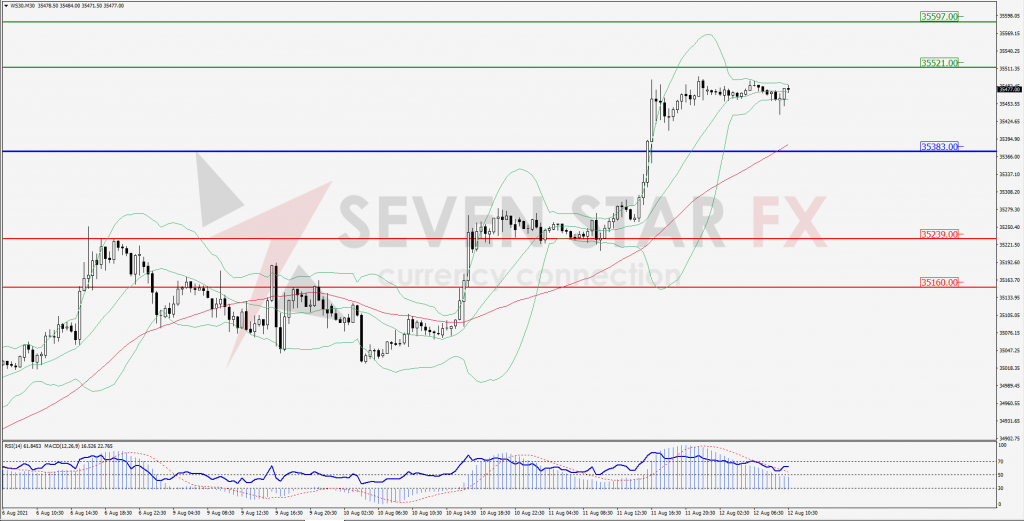
Green Lines Indicate Resistance Levels – Red Lines Indicates Support Levels
Light Blue is a Pivot Point – Black represents the price when the report was produced