Market Wrap: Stocks, Bonds, Commodities
The Nasdaq and S&P 500 closed higher on Monday, recovering some losses as investors anticipate quarterly earnings from AI leader Nvidia and Tesla jumped on the prospect of favorable policy changes from the incoming Trump administration.
The Dow Jones Industrial Average fail 55.39 points to 43,389.60, the S&P 500 gain 0.39% to 5,893.62 and the Nasdaq Composite up 111.69 points to 18,791.81.
MSCI’s index of Asia-Pacific stocks outside Japan is up 1.29% to 714.47 levels. The Australian index was higher by 0.89% to 8,374.00. Japanese Nikkei Index increase 0.45% today.
European stocks were mixed on Tuesday, with the Stoxx Europe 50 Index decrease 0.11% to 4,789.85 Germany’s DAX descend 0.11% to 19.189.19, and France’s CAC higher 0.12% to 7,278.23 and U.K.’s FTSE 100 gain 0.57% to 8,109.32.
Benchmark 10-year U.S. Treasury fail as demand for safe assets slipped again, today 10-year bond yields 0.11% to 4.4090.
Oil prices retreated on Tuesday after the previous day’s rally driven by halted production at Norway’s Johan Sverdrup oilfield, but investors remained cautious amid fears of a potential escalation in the Russia-Ukraine war.
Spot Brent crude oil decrease 0.07% to $73.23 per barrel. US West Texas Intermediate crude is decrease 0.17% to $69.05 a barrel.
The yellow metal gold is up 0.30% to 2,622.35 dollars per ounce.
Market Wrap: Forex
The dollar was on the back foot as it eased further away from last week’s one-year top against a basket of currencies.
Today, the U.S. dollar index measures the Greenback against a trade-weighted basket of six major currencies, which either ascend 0.09% to 106.292.
The Euro US Dollar (EUR/USD) is a widely traded is up 0.21% today. This left the pair trading around $1.05770.
The Japanese yen was will move negative against the U.S. dollar on Tuesday. Today USD/JPY is trades pair that decrease 0.05% to the 154.57 level.
Another commodity-related currency negative against the U.S dollar, AUD/USD loss 0.02% to 0.65060, and NZD/USD decrease 0.07% to 0.58880 level.
EUR/USD Intraday: Trend on the upside
Our pivot point is at 1.05900
Preferable Price Action: Take buy positions above pivot level with targets at 1.06120 & 1.06320 in extension.
Alternative Price Action: Sell pivot looks for a further downside to 1.06120 & 1.06320.
Comment: RSI is above 50 levels and pairs above its 55MA.
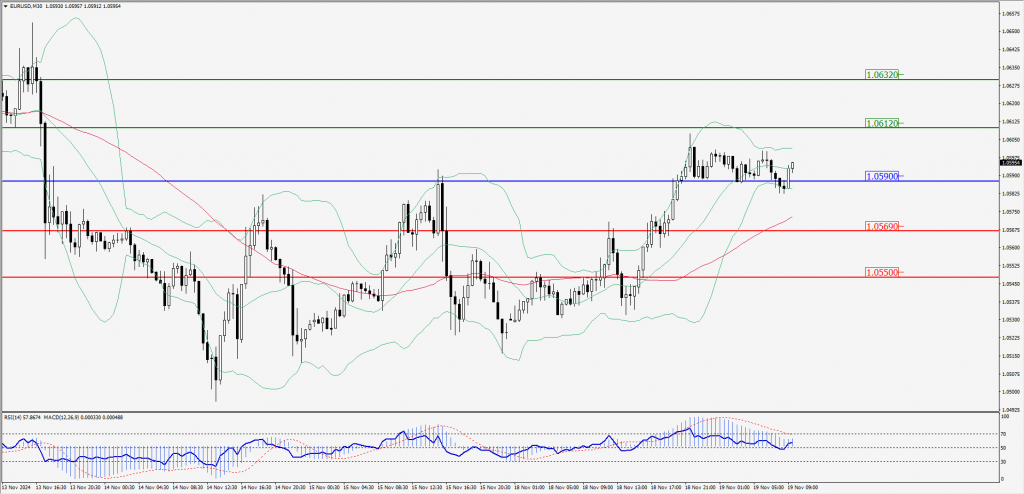
Green Lines Indicate Resistance Levels – Red Lines Indicate Support Levels
Light Blue is a Pivot Point – Black represents the price when the report was produced
GBP/USD Intraday: Trend on the upside
Our pivot point is at 1.26710
Preferable Price Action: Buy positions above pivot with targets at 1.26940 & 1.27160 in extension.
Alternative Price Action: The price below pivot would call for further downside to 1.26500 & 1.26290.
Comment: RSI is above 50 levels and pairs above its 55MA.
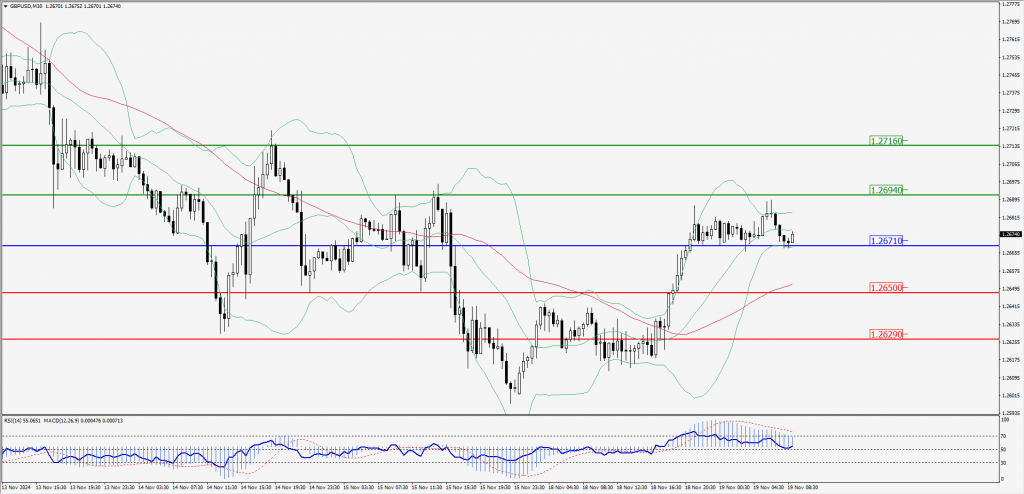
Green Lines Indicate Resistance Levels – Red Lines Indicate Support Levels
Light Blue is a Pivot Point – Black represents the price when the report was produced
USD/JPY Intraday: Trend on the downside
Our pivot point is at 154.570
Preferable Price Action: Sell position below pivot with the target at 154.190 and 153.850 in extension.
Alternative Price Action: The upside breakout of the pivot would call for 154.980 and 155.310.
Comment: MACD is below 50 levels and pairs below its 55MA.
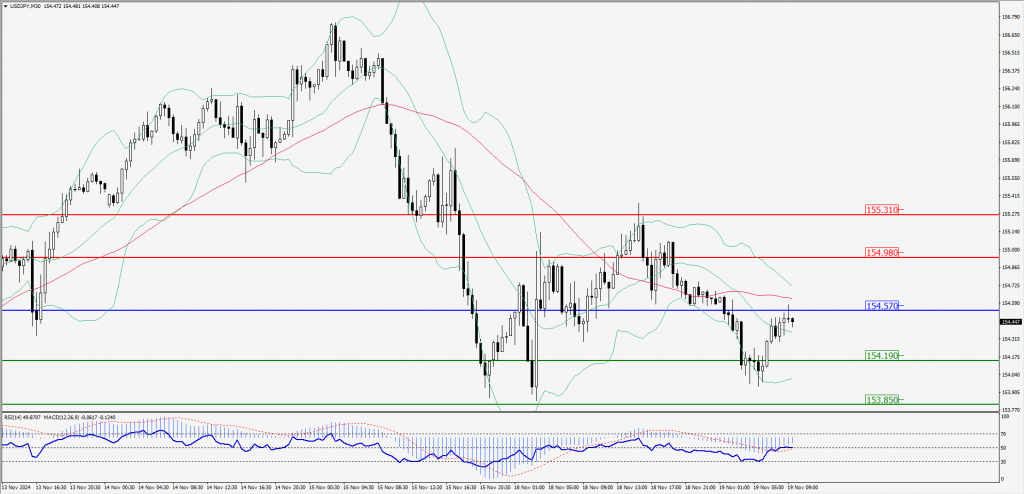
Green Lines Indicate Resistance Levels – Red Lines Indicate Support Levels
Light Blue is a Pivot Point – Black represents the price when the report was produced
AUD/USD Intraday: Trend on the upside
Our pivot point is at 0.65110
Preferable Price Action: Buy positions above pivot with targets at 0.65240 & 0.65360 in extension.
Alternative Price Action: Below pivot a further downside with 0.64970 & 0.64850 as targets.
Comment: RSI is above 50 levels and pairs above its 55MA.
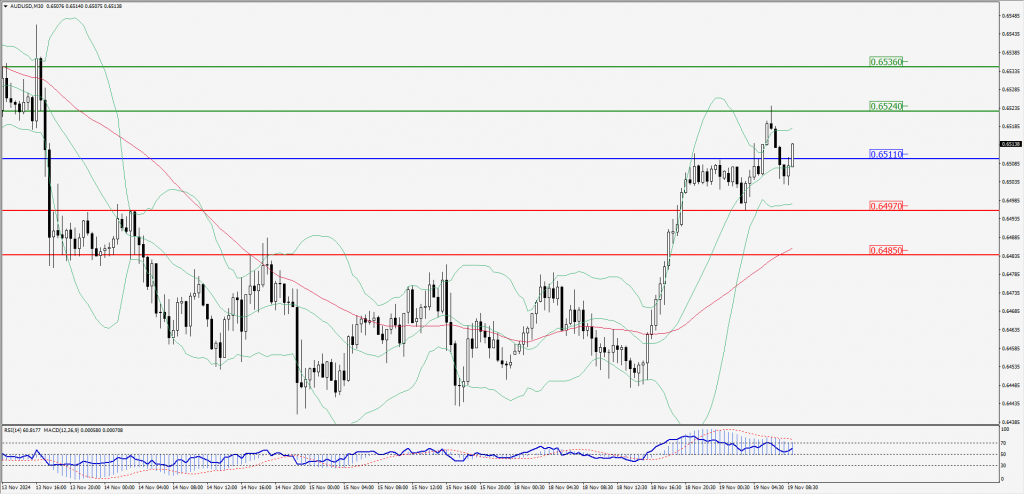
Green Lines Indicate Resistance Levels – Red Lines Indicate Support Levels
Light Blue is a Pivot Point – Black represents the price when the report was produced
CRUDEOIL Intraday: Trend on the upside
Our pivot point is at 69.14
Preferable Price Action: Above pivot buy oil with 69.52 & 69.89 as targets.
Alternative Price Action: Sell crude below pivot with targets at 68.75 & 68.41 in extension.
Comment: RSI is at above 50 levels and pairs above its 20MA & 55MA.
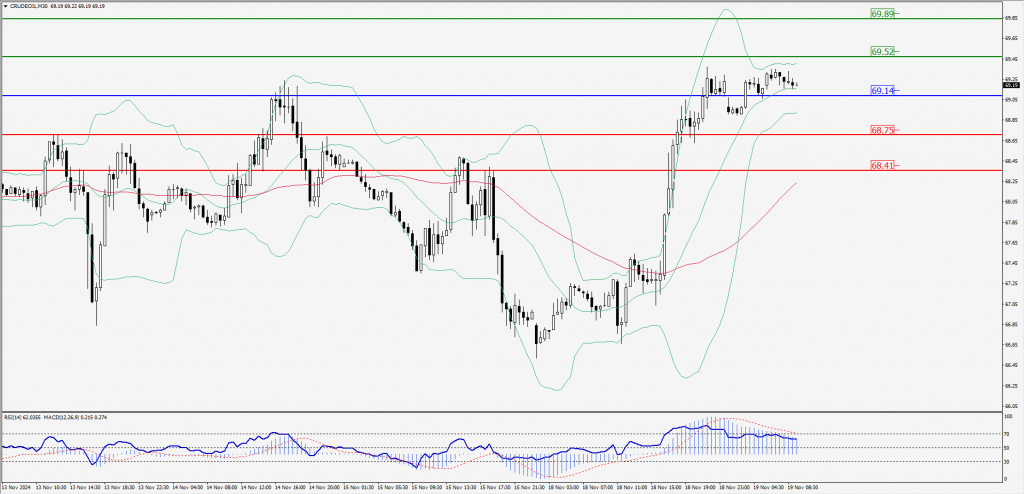
Green Lines Indicate Resistance Levels – Red Lines Indicate Support Levels
Light Blue is a Pivot Point – Black represents the price when the report was produced
XAU/USD Intraday: Trend on the upside
Our pivot point is at 2522.70
Preferable Price Action: Further upside to 2637.30 and 2650.80.
Alternative Price Action: If the price gives an downside breakout of a pivot, then the price extends to 2607.60 and 2593.00.
Comment: MACD is above 50 levels and pairs above its 20MA & 55MA.
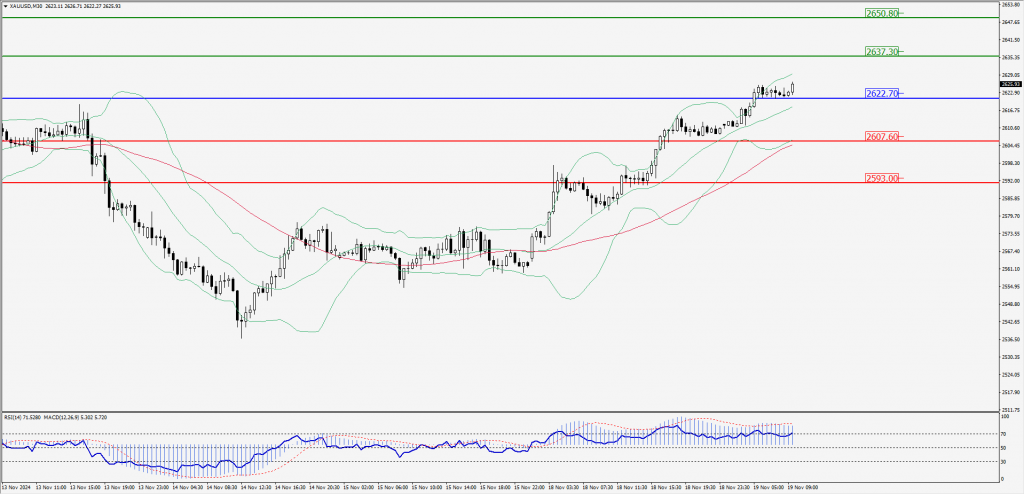
Green Lines Indicate Resistance Levels – Red Lines Indicate Support Levels
Light Blue is a Pivot Point – Black represents the price when the report was produced
Dow Jones Intraday: Trend on the upside
Our pivot point is 43,399.80
Preferable Price Action: Take buy positions above the pivot with targets at 43,536.20 & 43,658.70.
Alternative Price Action: Below 43,436.80 looks for further downside to 43,263.50 & 43,184.70.
Comment: RSI is above 50 levels and pairs above its 20MA & 55MA.
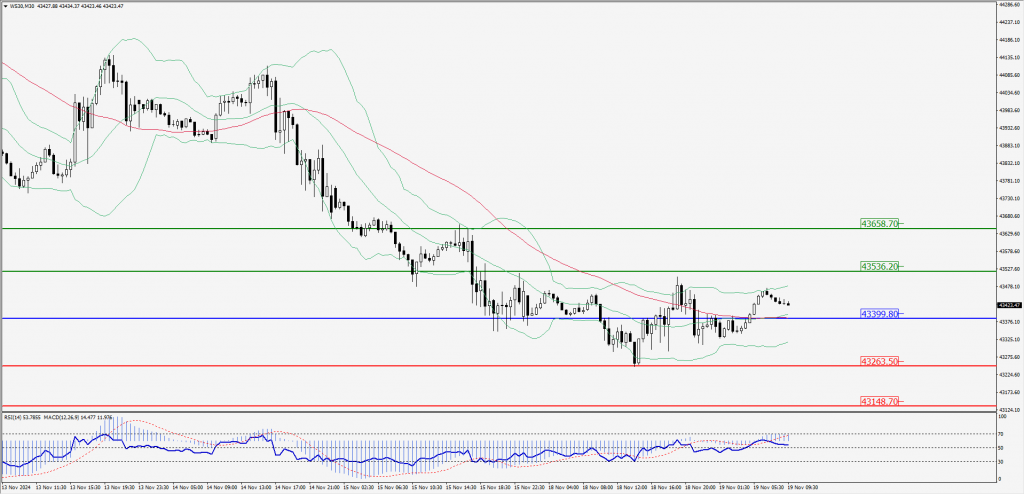
Green Lines Indicate Resistance Levels – Red Lines Indicate Support Levels
Light Blue is a Pivot Point – Black represents the price when the report was produced