Market Wrap: Stocks, Bonds, Commodities
Most Asian currencies moved little on Wednesday, while the dollar steadied near recent peaks as focus turned squarely to upcoming U.S. inflation data for more cues on interest rates.
The Dow Jones Industrial Average fail 382.15 points to 43,910.98, the S&P 500 loss 0.29% to 5,984.00 and the Nasdaq Composite down 17.36 points to 19,281.40.
MSCI’s index of Asia-Pacific stocks outside Japan is down 3.10% to 711.35 levels. The Australian index was lower by 0.75% to 8,193.40. Japanese Nikkei Index decrease 1.55% today.
European stocks were negative on Wednesday, with the Stoxx Europe 50 Index decrease 2.24% to 4,745.25 Germany’s DAX descend 2.13% to 19.033.64, and France’s CAC lower 2.69% to 7,226.98 and U.K.’s FTSE 100 loss 1.22% to 8,025.77.
Benchmark 10-year U.S. Treasury rose as demand for safe assets slipped again, today 10-year bond yields 0.07% to 4.4390.
Oil prices edged up on Wednesday on signs of near-term supply tightness but remained near their lowest in two weeks, a day after OPEC downgraded its forecast for global oil demand growth in 2024 and 2025.
Spot Brent crude oil increase 0.18% to $72.02 per barrel. US West Texas Intermediate crude is increase 0.15% to $68.22 a barrel.
The yellow metal gold is up 0.18% to 2,611.10 dollars per ounce.
Market Wrap: Forex
The U.S. dollar held below a 6-1/2-month peak against major peers and bitcoin edged further off record highs on Wednesday as markets hit pause on so-called Trump trades ahead of key U.S. inflation data later in the day.
Today, the U.S. dollar index measures the Greenback against a trade-weighted basket of six major currencies, which either ascend 0.04% to 105.995.
The Euro US Dollar (EUR/USD) is a widely traded is down 0.13% today. This left the pair trading around $1.06100.
The Japanese yen was will move positive against the U.S. dollar on Wednesday. Today USD/JPY is trades pair that increase 0.24% to the 154.97 level.
Another commodity-related currency mixed against the U.S dollar, AUD/USD loss 0.12% to 0.65250, and NZD/USD increase 0.03% to 0.59270 level.
EUR/USD Intraday: Trend on the downside
Our pivot point is at 1.06240
Preferable Price Action: Take sell positions below pivot level with targets at 1.05930 & 1.05660 in extension.
Alternative Price Action: Buy pivot looks for a further upside to 1.06560 & 1.06850.
Comment: RSI is below 50 levels and pairs below its 55MA & 20MA.
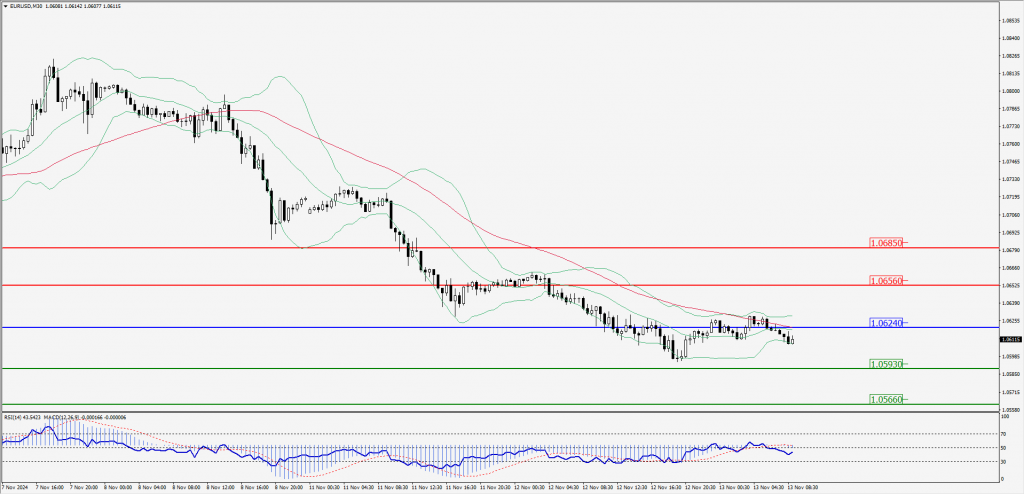
Green Lines Indicate Resistance Levels – Red Lines Indicate Support Levels
Light Blue is a Pivot Point – Black represents the price when the report was produced
GBP/USD Intraday: Trend on the downside
Our pivot point is at 1.27540
Preferable Price Action: Sell positions below pivot with targets at 1.27160 & 1.26820 in extension.
Alternative Price Action: The price above pivot would call for further upside to 1.27940 & 1.28310.
Comment: RSI is below 50 levels and pairs below its 55MA & 20MA.
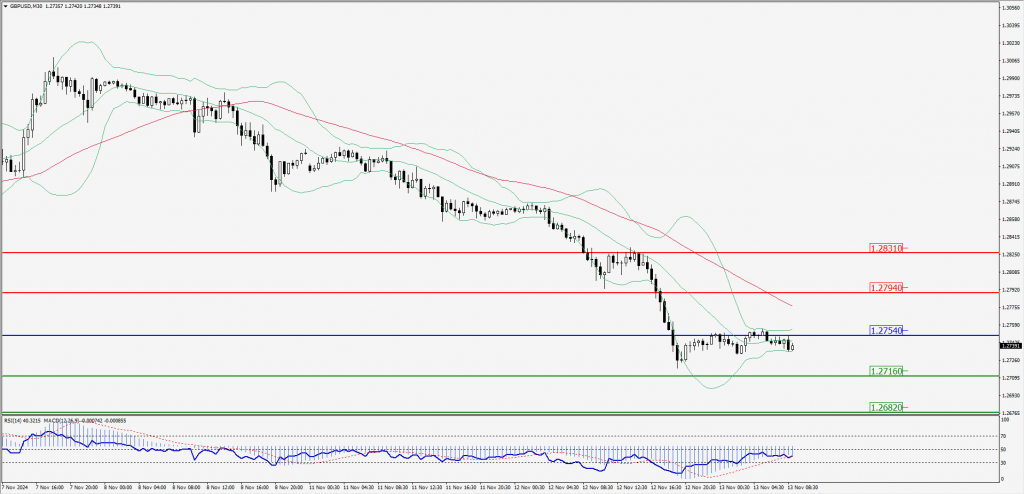
Green Lines Indicate Resistance Levels – Red Lines Indicate Support Levels
Light Blue is a Pivot Point – Black represents the price when the report was produced
USD/JPY Intraday: Major trend on the upside
Our pivot point is at 155.010
Preferable Price Action: Buy position above pivot with the target at 155.420 and 155.780 in extension.
Alternative Price Action: The downside breakout of the pivot would call for 154.580 and 154.200.
Comment: MACD is above 50 levels and pairs above its 55MA & 20MA.
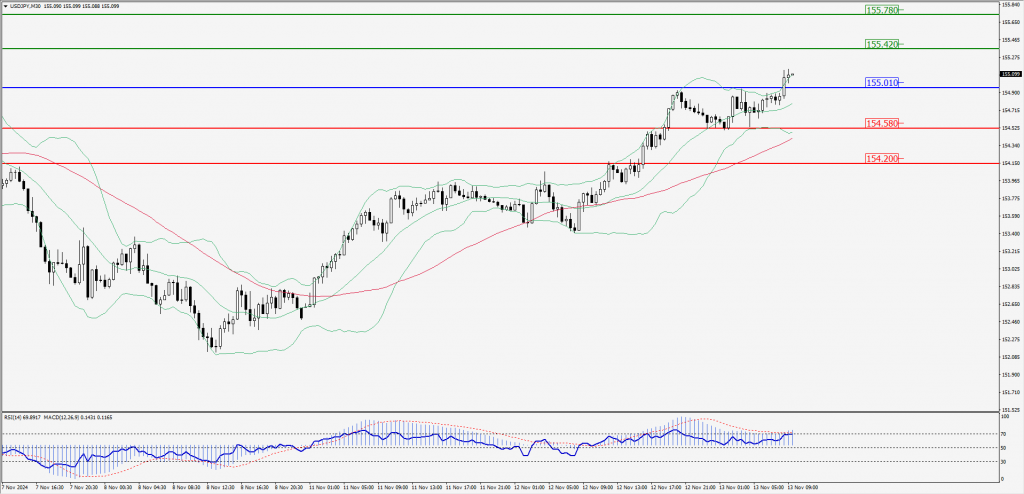
Green Lines Indicate Resistance Levels – Red Lines Indicate Support Levels
Light Blue is a Pivot Point – Black represents the price when the report was produced
AUD/USD Intraday: Trend on the downside
Our pivot point is at 0.65330
Preferable Price Action: Sell positions below pivot with targets at 0.65080 & 0.64860 in extension.
Alternative Price Action: Above pivot a further upside with 0.65600 & 0.65840 as targets.
Comment: RSI is below 50 levels and pairs below its 55MA & 20MA.
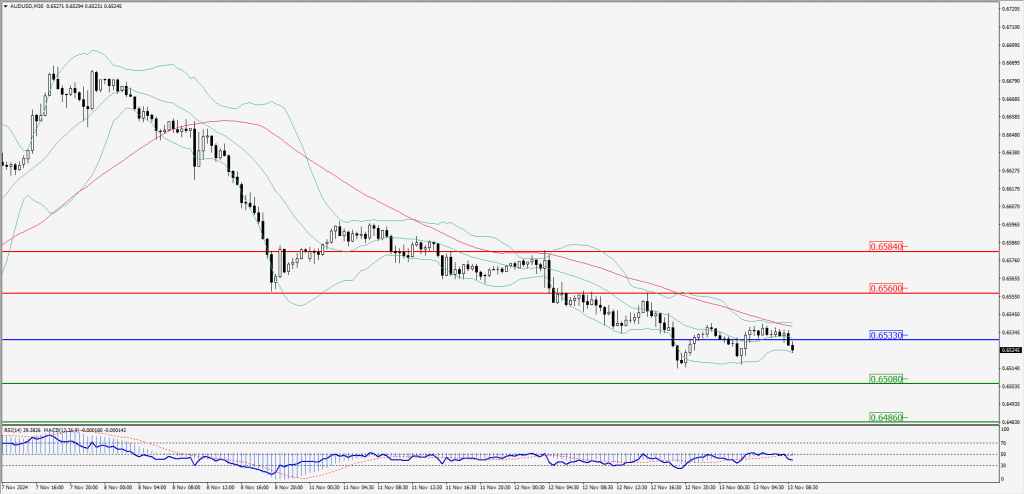
Green Lines Indicate Resistance Levels – Red Lines Indicate Support Levels
Light Blue is a Pivot Point – Black represents the price when the report was produced
CRUDEOIL Intraday: Trend on the upside
Our pivot point is at 68.06
Preferable Price Action: Above pivot buy oil with 68.71 & 69.38 as targets.
Alternative Price Action: Sell crude below pivot with targets at 67.39 & 66.79 in extension.
Comment: RSI is at above 50 levels and pairs above its 20MA.
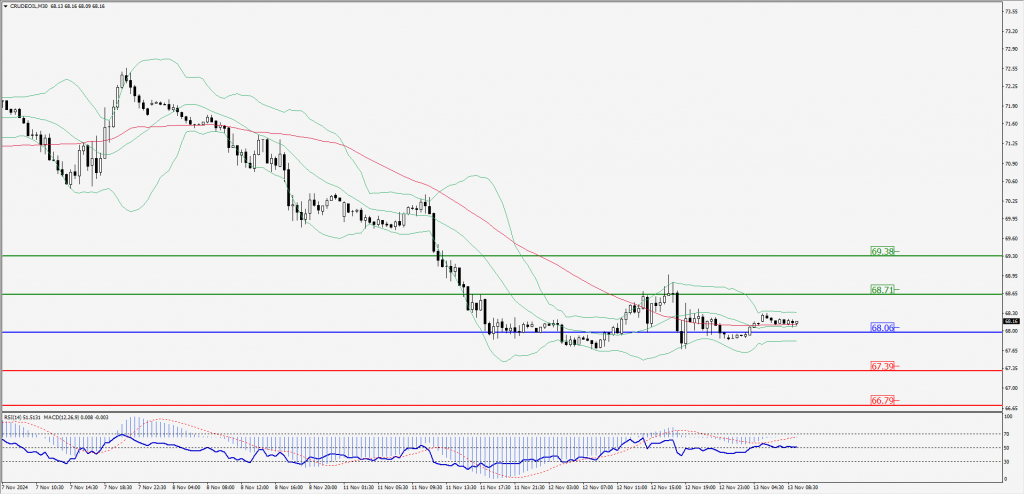
Green Lines Indicate Resistance Levels – Red Lines Indicate Support Levels
Light Blue is a Pivot Point – Black represents the price when the report was produced
XAU/USD Intraday: Trend on the upside
Our pivot point is at 2602.40
Preferable Price Action: Further upside to 2620.40 and 2636.40.
Alternative Price Action: If the price gives an downside breakout of a pivot, then the price extends to 2584.40 and 2569.30.
Comment: MACD is above 50 levels.
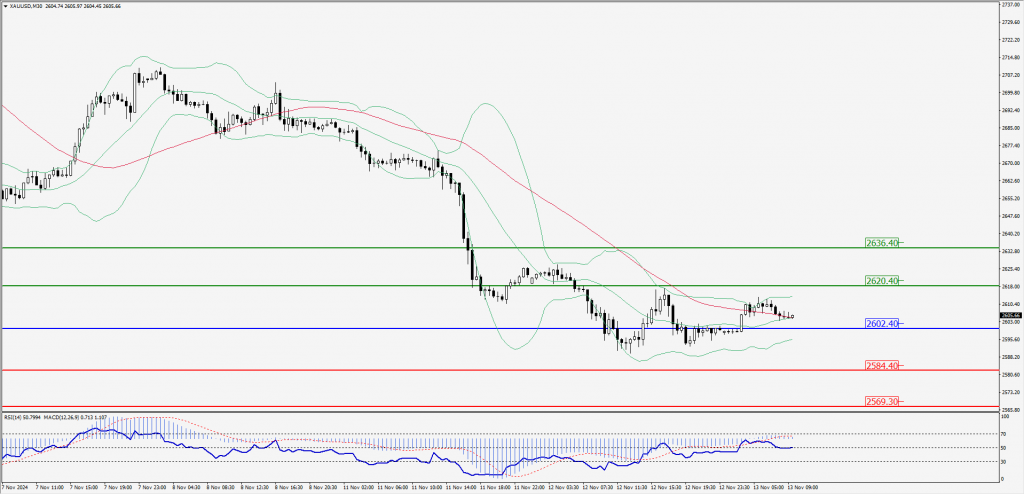
Green Lines Indicate Resistance Levels – Red Lines Indicate Support Levels
Light Blue is a Pivot Point – Black represents the price when the report was produced
Dow Jones Intraday: Major trend on the downside
Our pivot point is 43,833.00
Preferable Price Action: Take sell positions below the pivot with targets at 43,728.90 & 43,642.70.
Alternative Price Action: Above 43,833.00 looks for further upside to 43,939.50 & 44,032.90.
Comment: RSI is below 50 levels and pairs below its 20MA & 55MA.
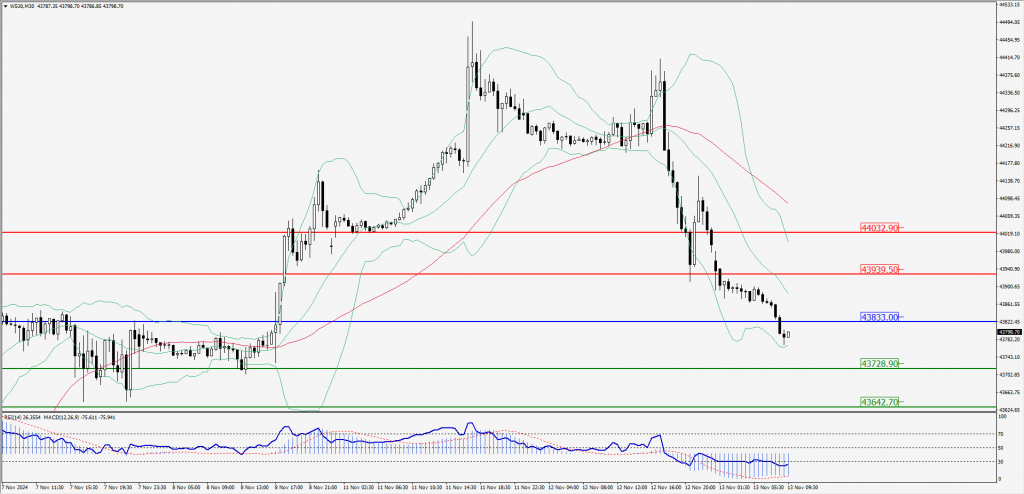
Green Lines Indicate Resistance Levels – Red Lines Indicate Support Levels
Light Blue is a Pivot Point – Black represents the price when the report was produced