Market Wrap: Stocks, Bonds, Commodities
Most Asian currencies weakened on Tuesday, while the dollar traded near a four-month high as traders remained largely biased towards sectors expected to benefit from a second Donald Trump presidency.
The Dow Jones Industrial Average rose 304.14 points to 44,293.13, the S&P 500 gain 0.10% to 6,001.40 and the Nasdaq Composite up 11.98 points to 19,298.76.
MSCI’s index of Asia-Pacific stocks outside Japan is down 3.06% to 718.10 levels. The Australian index was lower by 0.13% to 8,255.60. Japanese Nikkei Index decrease 0.48% today.
European stocks were mixed on Tuesday, with the Stoxx Europe 50 Index increase 1.07% to 4,854.25 Germany’s DAX ascend 1.21% to 19.448.60, and France’s CAC higher 1.20% to 7,426.88 and U.K.’s FTSE 100 loss 0.65% to 8,125.19.
Benchmark 10-year U.S. Treasury fail as demand for safe assets slipped again, today 10-year bond yields 0.16% to 4.3440.
Oil prices extended declines on Monday as the threat of a supply disruption from a U.S. storm eased and after China’s stimulus plan disappointed investors seeking fuel demand growth in the world’s No. 2 oil consumer.
Spot Brent crude oil decrease 0.16% to $71.77 per barrel. US West Texas Intermediate crude is decrease 0.13% to $67.95 a barrel.
The yellow metal gold is down 0.29% to 2,610.15 dollars per ounce.
Market Wrap: Forex
The U.S. dollar rose toward a four-month peak versus major peers on Tuesday, while bitcoin extended its record rally as investors continued to pile into trades seen as benefiting from the incoming Donald Trump administration.
Today, the U.S. dollar index measures the Greenback against a trade-weighted basket of six major currencies, which either ascend 0.18% to 105.647.
The Euro US Dollar (EUR/USD) is a widely traded is down 0.20% today. This left the pair trading around $1.06330.
The Japanese yen was will move positive against the U.S. dollar on Tuesday. Today USD/JPY is trades pair that increase 0.06% to the 153.80 level.
Another commodity-related currency negative against the U.S dollar, AUD/USD loss 0.32% to 0.65530, and NZD/USD decrease 0.09% to 0.59580 level.
EUR/USD Intraday: Major trend on the downside
Our pivot point is at 1.06420
Preferable Price Action: Take sell positions below pivot level with targets at 1.06110 & 1.05870 in extension.
Alternative Price Action: Buy pivot looks for a further upside to 1.06740 & 1.07010.
Comment: RSI is below 50 levels and pairs below its 55MA & 20MA.
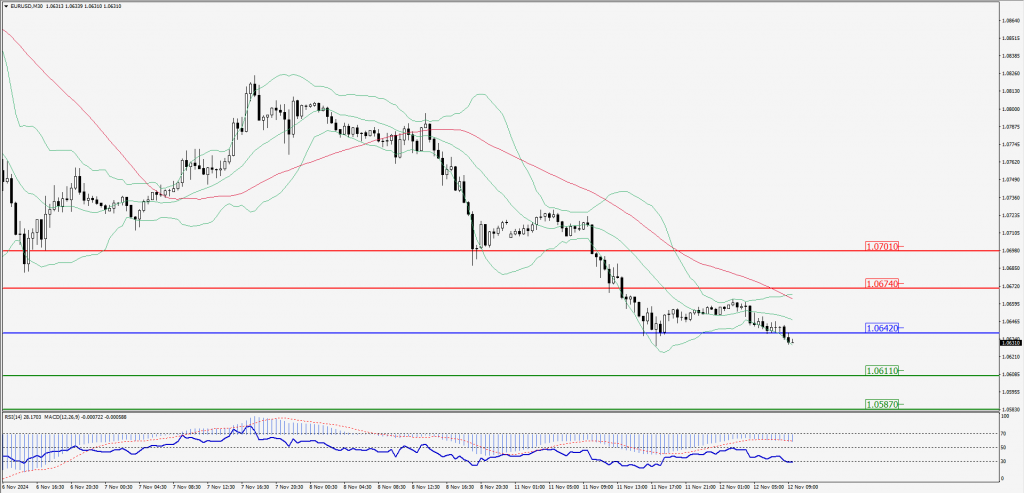
Green Lines Indicate Resistance Levels – Red Lines Indicate Support Levels
Light Blue is a Pivot Point – Black represents the price when the report was produced
GBP/USD Intraday: Major rend on the downside
Our pivot point is at 1.28300
Preferable Price Action: Sell positions below pivot with targets at 1.28010 & 1.27740 in extension.
Alternative Price Action: The price above pivot would call for further upside to 1.28610 & 1.28870.
Comment: RSI is below 50 levels and pairs below its 55MA & 20MA.
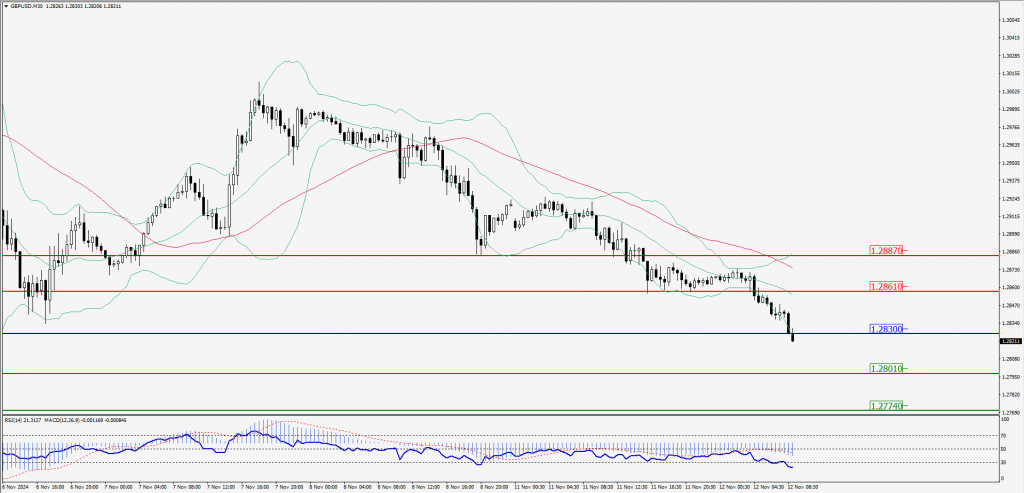
Green Lines Indicate Resistance Levels – Red Lines Indicate Support Levels
Light Blue is a Pivot Point – Black represents the price when the report was produced
USD/JPY Intraday: Trend on the upside
Our pivot point is at 153.720
Preferable Price Action: Buy position above pivot with the target at 154.040 and 154.340 in extension.
Alternative Price Action: The downside breakout of the pivot would call for 153.410 and 153.120.
Comment: MACD is above 50 levels and pairs above its 55MA & 20MA.
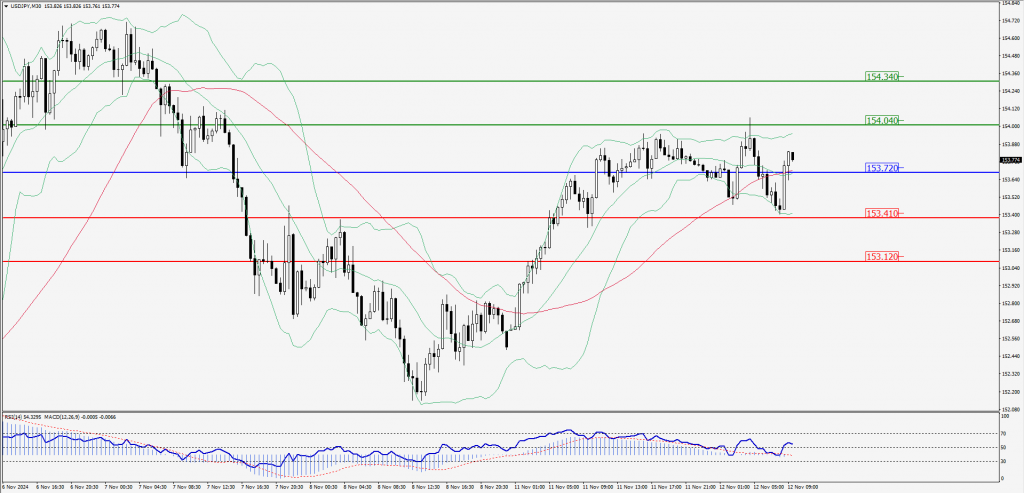
Green Lines Indicate Resistance Levels – Red Lines Indicate Support Levels
Light Blue is a Pivot Point – Black represents the price when the report was produced
AUD/USD Intraday: Trend on the downside
Our pivot point is at 0.65580
Preferable Price Action: Sell positions below pivot with targets at 0.65350 & 0.65170 in extension.
Alternative Price Action: Above pivot a further upside with 0.65810 & 0.66020 as targets.
Comment: RSI is below 50 levels and pairs below its 55MA.
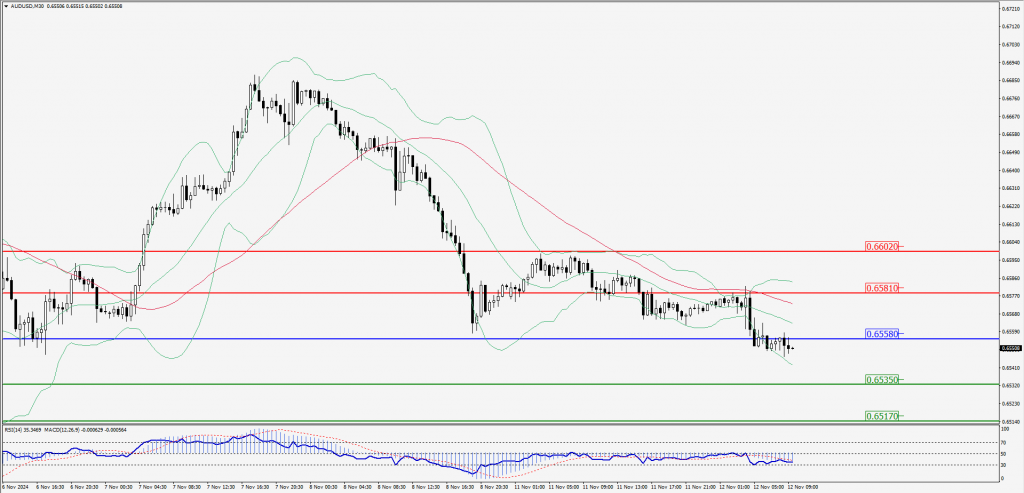
Green Lines Indicate Resistance Levels – Red Lines Indicate Support Levels
Light Blue is a Pivot Point – Black represents the price when the report was produced
CRUDEOIL Intraday: Trend on the downside
Our pivot point is at 68.06
Preferable Price Action: Below pivot sell oil with 67.41 & 66.83 as targets.
Alternative Price Action: Buy crude above pivot with targets at 68.74 & 69.33 in extension.
Comment: RSI is at below 50 levels and pairs below its 20MA.
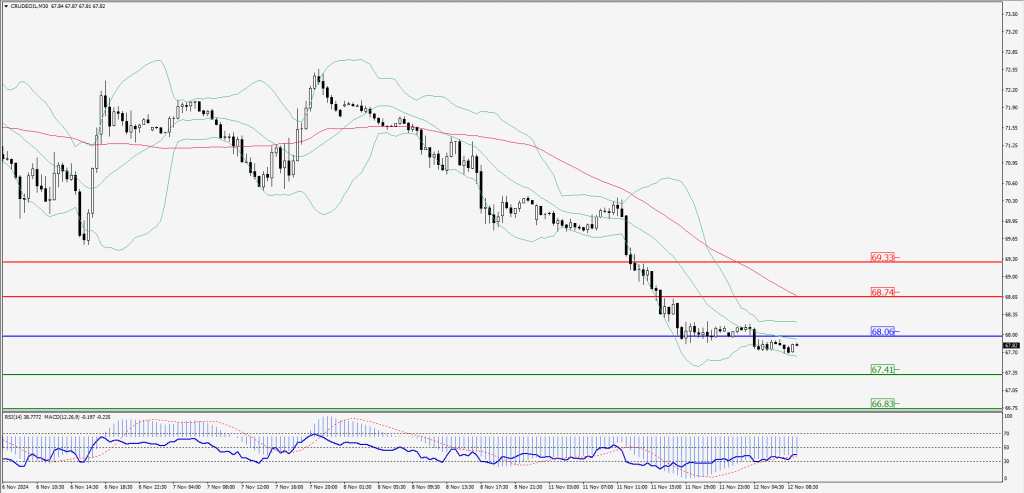
Green Lines Indicate Resistance Levels – Red Lines Indicate Support Levels
Light Blue is a Pivot Point – Black represents the price when the report was produced
XAU/USD Intraday: Major trend on the downside
Our pivot point is at 2614.10
Preferable Price Action: Further downside to 25594.20 and 2577.30.
Alternative Price Action: If the price gives an upside breakout of a pivot, then the price extends to 2633.60 and 2651.60.
Comment: MACD is below 50 levels and pairs below its 20MA & 55MA.
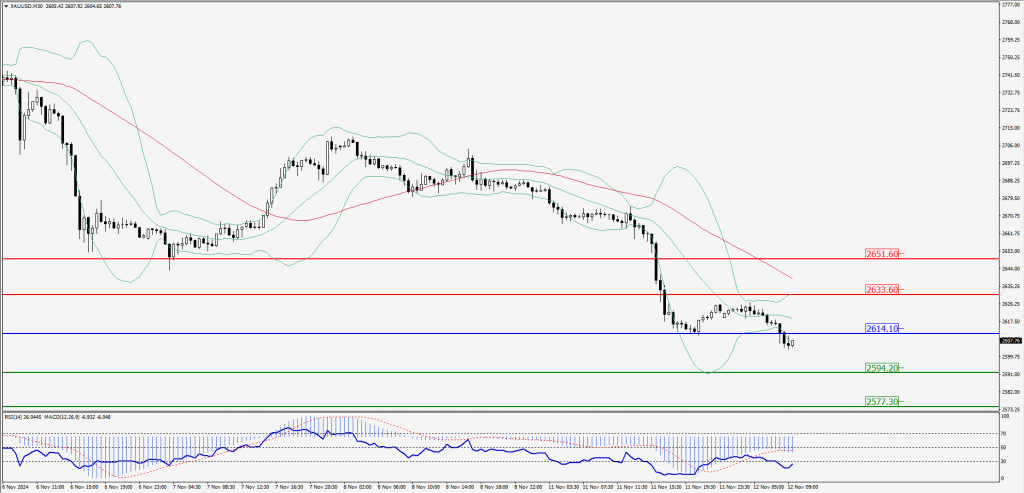
Green Lines Indicate Resistance Levels – Red Lines Indicate Support Levels
Light Blue is a Pivot Point – Black represents the price when the report was produced
Dow Jones Intraday: Trend on the downside
Our pivot point is 44,299.90
Preferable Price Action: Take sell positions below the pivot with targets at 44,119.50 & 43,941.90.
Alternative Price Action: Above 44,299.90 looks for further upside to 44,462.30 & 44,624.30.
Comment: RSI is below 50 levels and pairs below its 20MA.
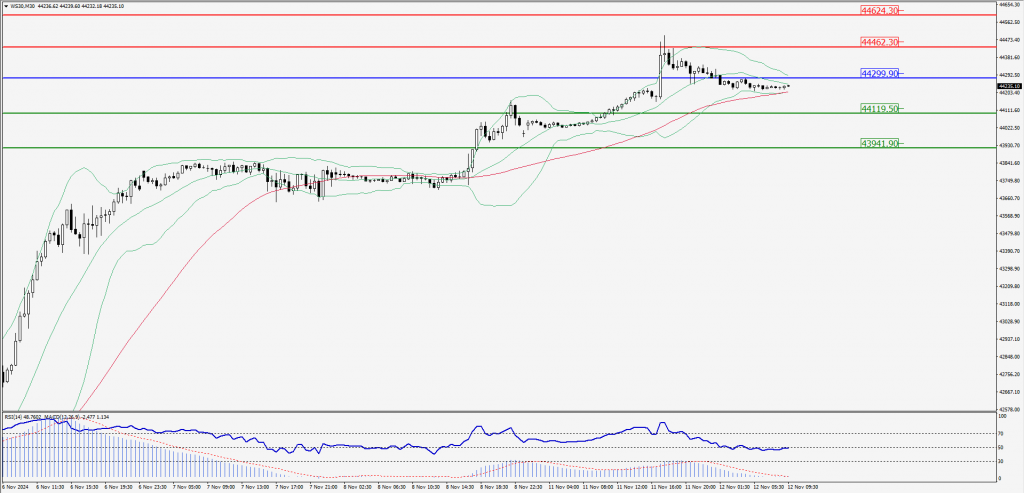
Green Lines Indicate Resistance Levels – Red Lines Indicate Support Levels
Light Blue is a Pivot Point – Black represents the price when the report was produced