Market Wrap: Stocks, Bonds, Commodities
The dollar edged higher on Monday as markets braced for U.S. inflation data and a throng of Federal Reserve speakers this week, while the yuan nursed a hangover from Beijing’s latest underwhelming stimulus package.
The Dow Jones Industrial Average rose 259.65 points to 43,988.99, the S&P 500 gain 0.38% to 5,995.54 and the Nasdaq Composite up 17.32 points to 19,286.78.
MSCI’s index of Asia-Pacific stocks outside Japan is down 1.06% to 734.08 levels. The Australian index was lower by 0.35% to 8,266.20. Japanese Nikkei Index increase 0.18% today.
European stocks were negative on Monday, with the Stoxx Europe 50 Index decrease 1.03% to 4,802.15 Germany’s DAX descend 0.76% to 19.215.48, and France’s CAC lower 1.17% to 7,338.67 and U.K.’s FTSE 100 loss 0.84% to 8,072.39.
Benchmark 10-year U.S. Treasury rose as demand for safe assets slipped again, today 10-year bond yields 0.63% to 4.3370.
Oil prices extended declines on Monday as the threat of a supply disruption from a U.S. storm eased and after China’s stimulus plan disappointed investors seeking fuel demand growth in the world’s No. 2 oil consumer.
Spot Brent crude oil decrease 0.07% to $73.92 per barrel. US West Texas Intermediate crude is increase 0.10% to $70.31 a barrel.
The yellow metal gold is down 0.60% to 2,678.70 dollars per ounce.
Market Wrap: Forex
The dollar took a breather on Friday, on track to cap off a wild week with a slight gain as markets weighed the impact of Donald Trump’s impending return to the White House and what that would mean for the U.S. economy and its rate outlook.
Today, the U.S. dollar index measures the Greenback against a trade-weighted basket of six major currencies, which either ascend 0.06% to 104.955.
The Euro US Dollar (EUR/USD) is a widely traded is down 0.02% today. This left the pair trading around $1.07160.
The Japanese yen was will move positive against the U.S. dollar on Monday. Today USD/JPY is trades pair that increase 0.51% to the 153.41 level.
Another commodity-related currency positive against the U.S dollar, AUD/USD gain 0.14% to 0.65900, and NZD/USD increase 0.11% to 0.59740 level.
EUR/USD Intraday: Trend on the downside
Our pivot point is at 1.07290
Preferable Price Action: Take sell positions below pivot level with targets at 1.06970 & 1.06720 in extension.
Alternative Price Action: Buy pivot looks for a further upside to 1.07620 & 1.07910.
Comment: RSI is below 50 levels and pairs below its 55MA.
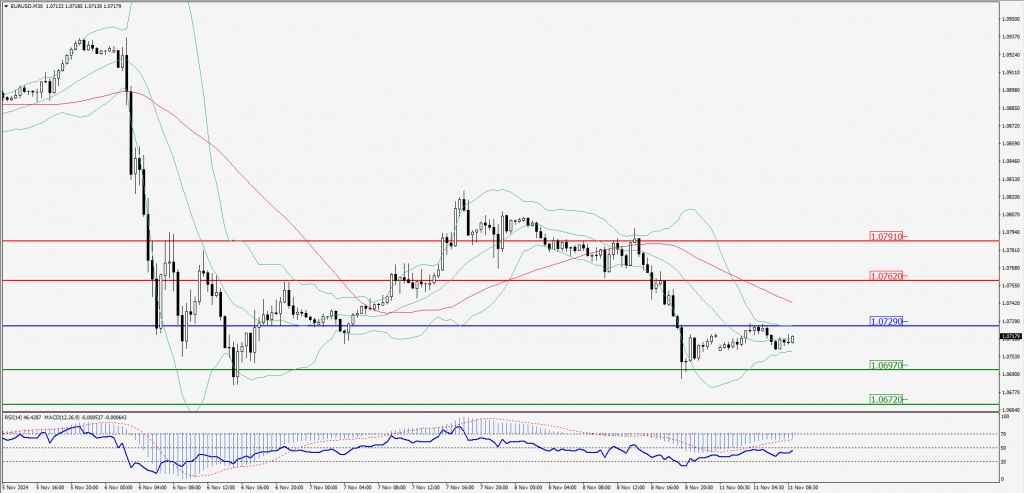
Green Lines Indicate Resistance Levels – Red Lines Indicate Support Levels
Light Blue is a Pivot Point – Black represents the price when the report was produced
GBP/USD Intraday: Trend on the downside
Our pivot point is at 1.29250
Preferable Price Action: Sell positions below pivot with targets at 1.28990 & 1.28730 in extension.
Alternative Price Action: The price above pivot would call for further upside to 1.29530 & 1.29790.
Comment: RSI is below 50 levels and pairs below its 55MA.
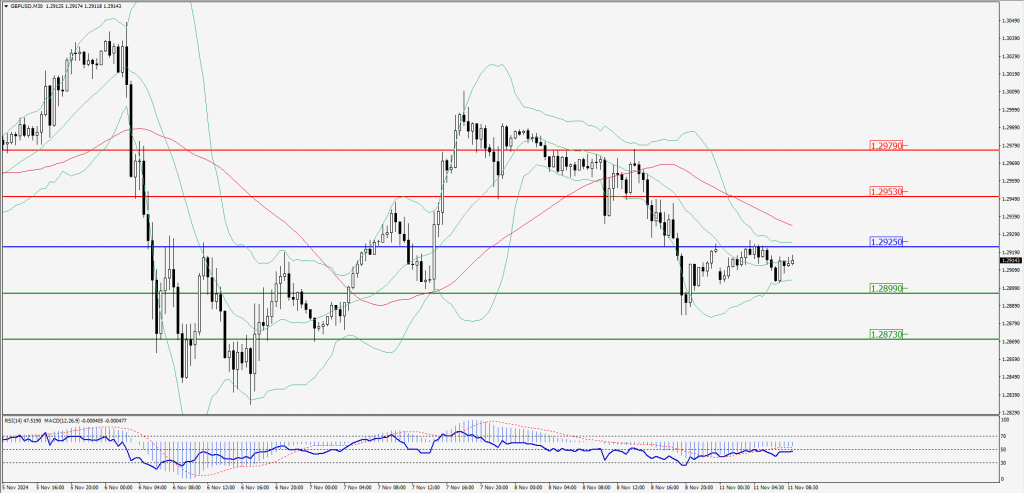
Green Lines Indicate Resistance Levels – Red Lines Indicate Support Levels
Light Blue is a Pivot Point – Black represents the price when the report was produced
USD/JPY Intraday: Trend on the upside
Our pivot point is at 153.460
Preferable Price Action: Buy position above pivot with the target at 153.930 and 154.300 in extension.
Alternative Price Action: The downside breakout of the pivot would call for 153.010 and 152.620.
Comment: MACD is above 50 levels and pairs above its 55MA & 20MA.
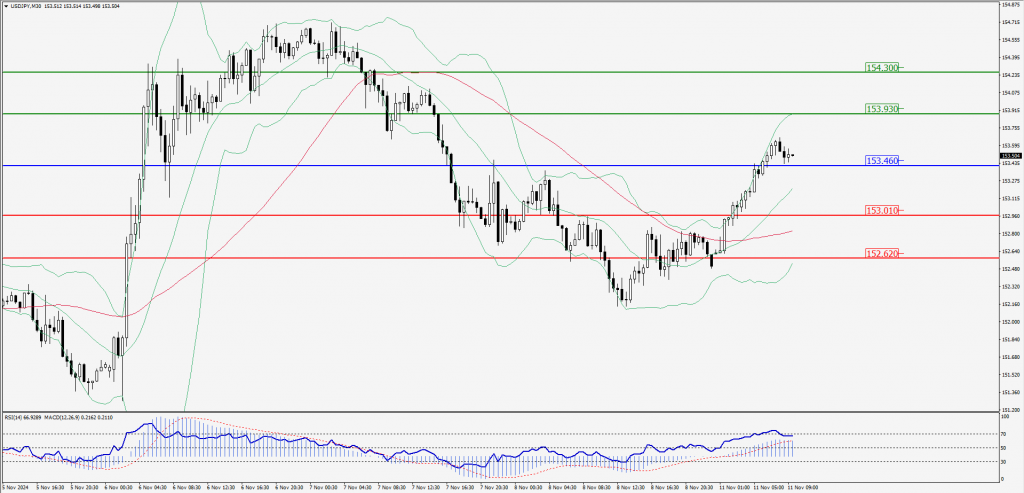
Green Lines Indicate Resistance Levels – Red Lines Indicate Support Levels
Light Blue is a Pivot Point – Black represents the price when the report was produced
AUD/USD Intraday: Trend on the downside
Our pivot point is at 0.66000
Preferable Price Action: Sell positions below pivot with targets at 0.65820 & 0.65640 in extension.
Alternative Price Action: Above pivot a further upside with 0.66190 & 0.66380 as targets.
Comment: RSI is below 50 levels and pairs below its 55MA.
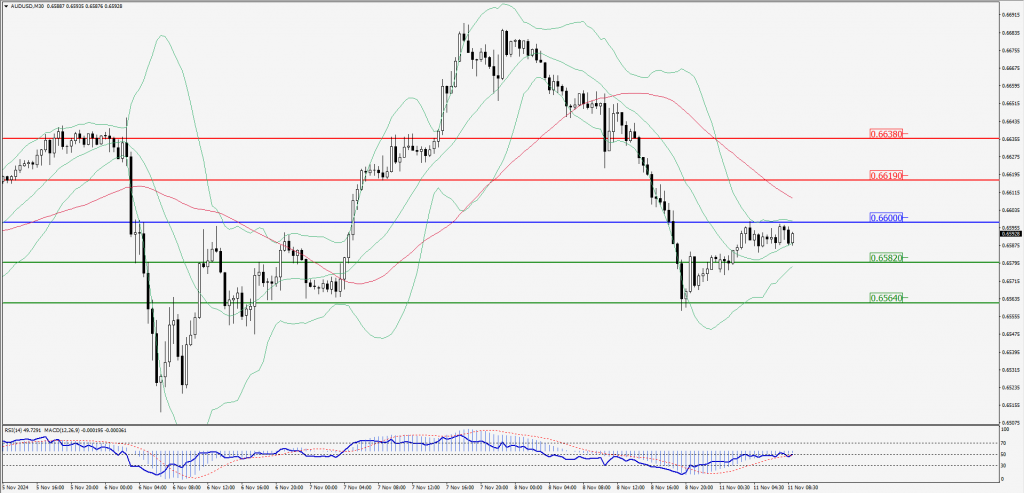
Green Lines Indicate Resistance Levels – Red Lines Indicate Support Levels
Light Blue is a Pivot Point – Black represents the price when the report was produced
CRUDEOIL Intraday: Trend on the upside
Our pivot point is at 70.12
Preferable Price Action: Above pivot buy oil with 70.48 & 70.79 as targets.
Alternative Price Action: Sell crude below pivot with targets at 69.79 & 69.48 in extension.
Comment: RSI is at above 50 levels and pairs above its 20MA.
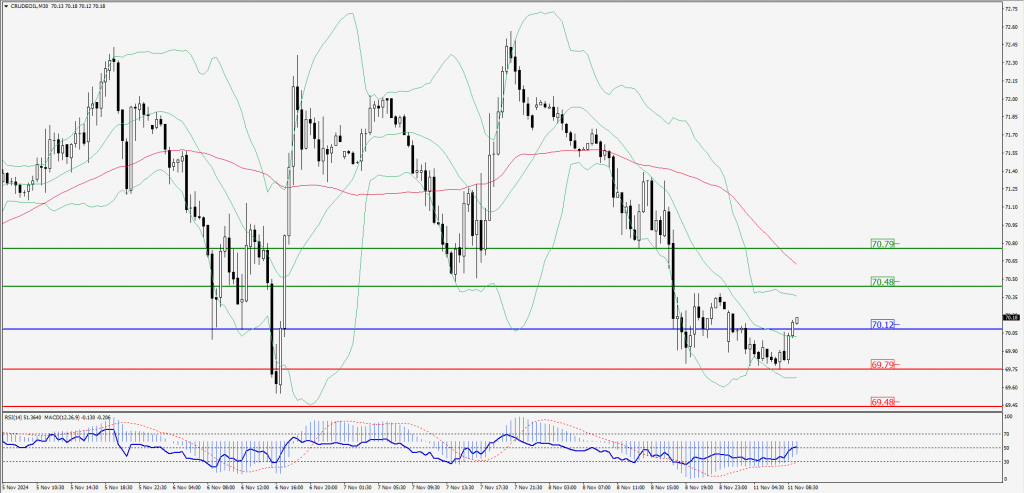
Green Lines Indicate Resistance Levels – Red Lines Indicate Support Levels
Light Blue is a Pivot Point – Black represents the price when the report was produced
XAU/USD Intraday: Trend on the downside
Our pivot point is at 2676.60
Preferable Price Action: Further downside to 2663.80 and 2652.20.
Alternative Price Action: If the price gives an upside breakout of a pivot, then the price extends to 2689.80 and 2702.80.
Comment: MACD is below 50 levels and pairs below its 20MA & 55MA.
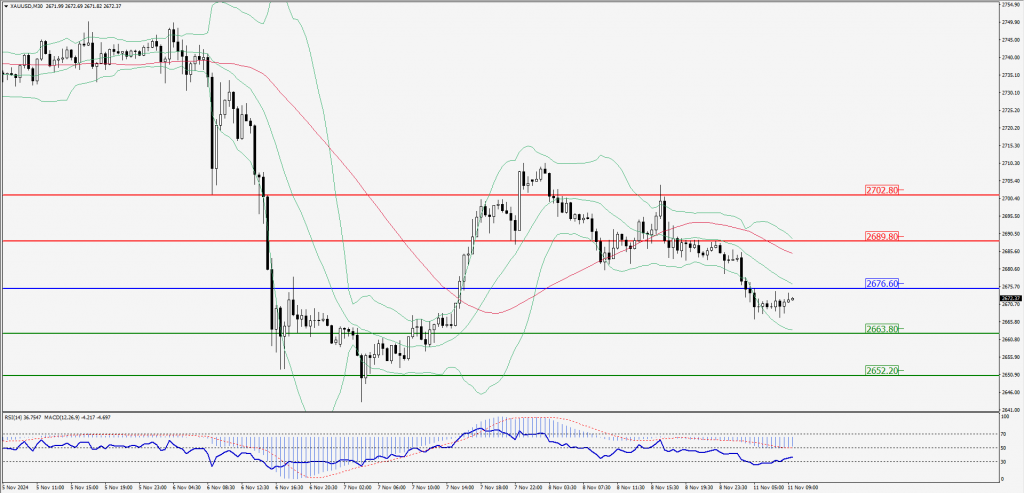
Green Lines Indicate Resistance Levels – Red Lines Indicate Support Levels
Light Blue is a Pivot Point – Black represents the price when the report was produced
Dow Jones Intraday: Trend on the upside
Our pivot point is 44,028.10
Preferable Price Action: Take buy positions above the pivot with targets at 44,256.30 & 44,472.40.
Alternative Price Action: Below 44,028.10 looks for further downside to 43,784.00 & 43,539.90.
Comment: RSI is above 50 levels and pairs above its 55MA.
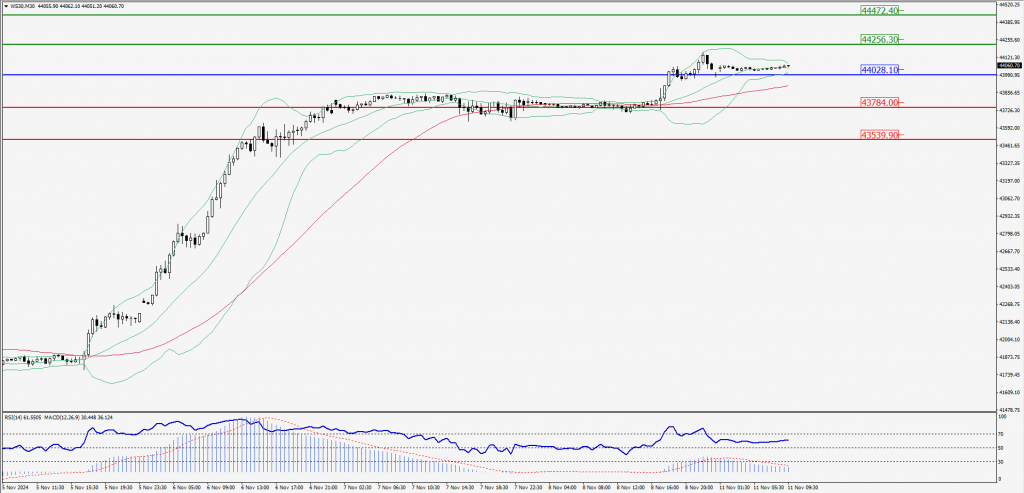
Green Lines Indicate Resistance Levels – Red Lines Indicate Support Levels
Light Blue is a Pivot Point – Black represents the price when the report was produced