Market Wrap: Stocks, Bonds, Commodities
Most Asian currencies weakened on Wednesday as uncertainty over U.S. interest rates and the upcoming presidential elections kept traders risk-averse, while the dollar remained at a near three-month high.
The Dow Jones Industrial Average fail 6.71 points to 42,924.89, the S&P 500 loss 0.05% to 5,851.20 and the Nasdaq Composite ascend 33.12 points to 18,573.13.
MSCI’s index of Asia-Pacific stocks outside Japan is down 0.37% to 745.18 levels. The Australian index was higher by 0.13% to 8,216.00. Japanese Nikkei Index decrease 0.85% today.
European stocks were mixed on Wednesday, with the Stoxx Europe 50 Index increase 0.02% to 4,940.15 Germany’s DAX descend 0.05% to 19,426.45, and France’s CAC lower 0.14% to 7,524.34 and U.K.’s FTSE 100 gain 0.09% to 8,314.24.
Benchmark 10-year U.S. Treasury rose as demand for safe assets slipped again, today 10-year bond yields 0.48% to 4.2280.
Oil prices fell on Wednesday after industry data showed U.S. crude inventories swelled more than expected, though declines were capped as the market watched diplomatic efforts in the Middle East after Israel continued attacks on Gaza and Lebanon.
Spot Brent crude oil decrease 0.59% to $75.59 per barrel. US West Texas Intermediate crude is decrease 0.66% to $71.27 a barrel.
The yellow metal gold is up 0.22% to 2,765.95 dollars per ounce.
Market Wrap: Forex
The U.S. dollar ticked up to a 2-1/2-month peak on Wednesday as investors adjusted bets toward a gradual reduction of interest rates while keeping an eye on a close presidential election race.
Today, the U.S. dollar index measures the Greenback against a trade-weighted basket of six major currencies, which increase 0.22% to 104.135.
The Euro US Dollar (EUR/USD) is a widely traded is down 0.07% today. This left the pair trading around $1.07890.
The Japanese yen was will move positive against the U.S. dollar on Wednesday. Today USD/JPY is trades pair that increase 0.87% to the 152.380 level.
Another commodity-related currency negative against the U.S dollar, AUD/USD loss 0.21% to 0.66670, and NZD/USD decrease 0.19% to 0.60300 level.
EUR/USD Intraday: Trend on the downside
Our pivot point is at 1.08000
Preferable Price Action: Take sell positions below pivot level with targets at 1.07870 & 1.07760 in extension.
Alternative Price Action: Buy pivot looks for a further upside to 1.08130 & 1.08250.
Comment: RSI is below 50 levels and pairs below its 55MA.
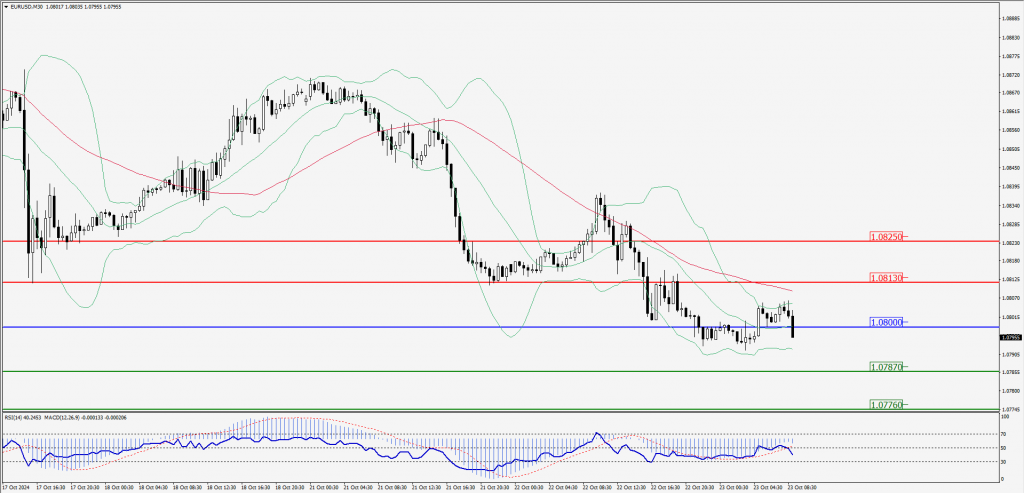
Green Lines Indicate Resistance Levels – Red Lines Indicate Support Levels
Light Blue is a Pivot Point – Black represents the price when the report was produced
GBP/USD Intraday: Trend on the downside
Our pivot point is at 1.29800
Preferable Price Action: Sell positions below pivot with targets at 1.29620 & 1.29480 in extension.
Alternative Price Action: The price above pivot would call for further upside to 1.29990 & 1.30140.
Comment: RSI is below 50 levels and pairs below its 20MA & 55MA.
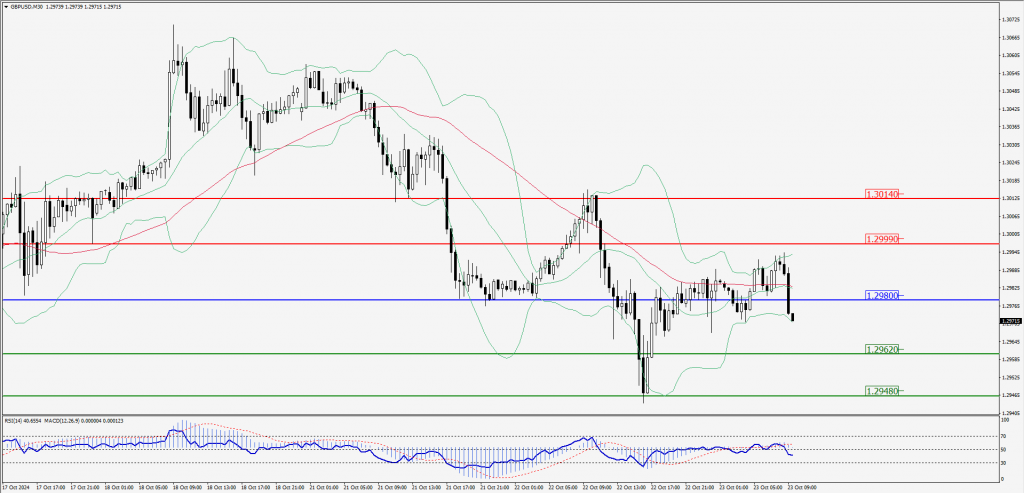
Green Lines Indicate Resistance Levels – Red Lines Indicate Support Levels
Light Blue is a Pivot Point – Black represents the price when the report was produced
USD/JPY Intraday: Major trend on the upside
Our pivot point is at 152.190
Preferable Price Action: Buy position above pivot with the target at 152.710 and 153.180 in extension.
Alternative Price Action: The downside breakout of the pivot would call for 151.630 and 151.150.
Comment: MACD is above 50 levels and pairs above its 55MA & 20MA.
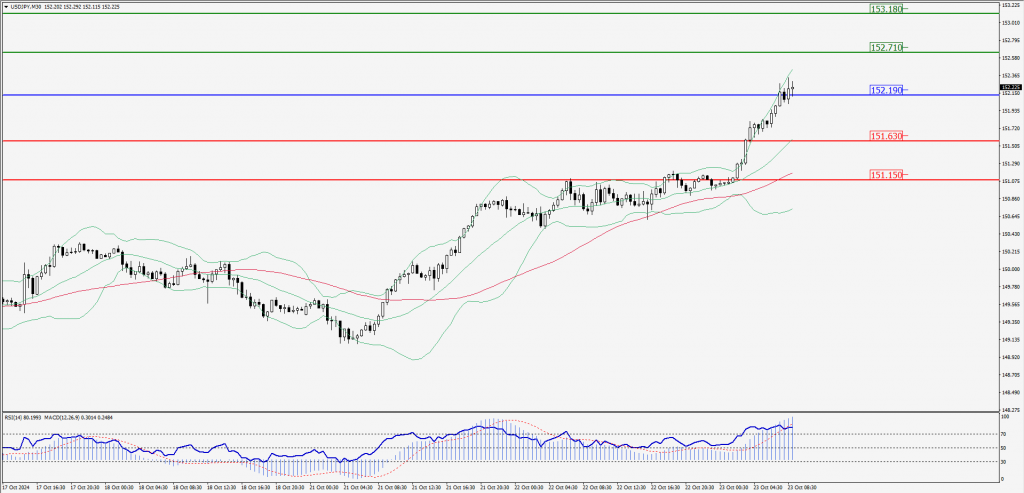
Green Lines Indicate Resistance Levels – Red Lines Indicate Support Levels
Light Blue is a Pivot Point – Black represents the price when the report was produced
AUD/USD Intraday: Trend on the downside
Our pivot point is at 0.66690
Preferable Price Action: Sell positions below pivot with targets at 0.66590 & 0.66500 in extension.
Alternative Price Action: Above pivot a further upside with 0.66800 & 0.66890 as targets.
Comment: RSI is below 50 levels and pairs below its 55MA & 20MA.
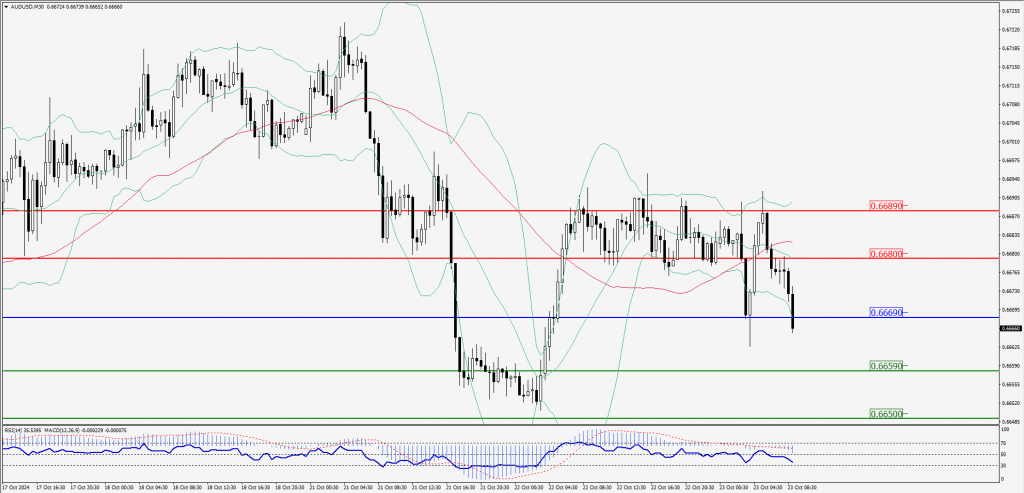
Green Lines Indicate Resistance Levels – Red Lines Indicate Support Levels
Light Blue is a Pivot Point – Black represents the price when the report was produced
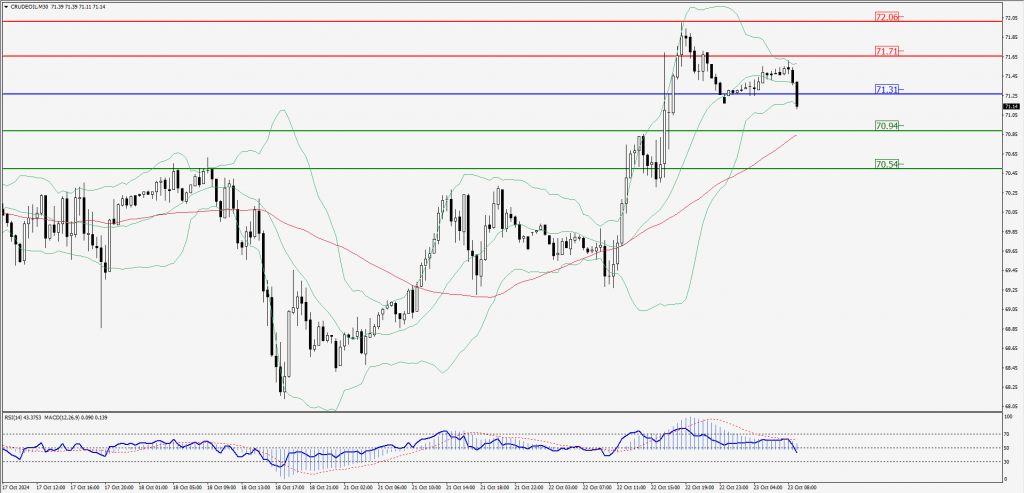
CRUDEOIL Intraday: Trend on the downside
Our pivot point is at 71.31
Preferable Price Action: Below pivot sell oil with 70.94 & 70.54 as targets.
Alternative Price Action: Buy crude above pivot with targets at 71.71 & 72.06 in extension.
Comment: RSI is at below 50 levels.
Green Lines Indicate Resistance Levels – Red Lines Indicate Support Levels
Light Blue is a Pivot Point – Black represents the price when the report was produced
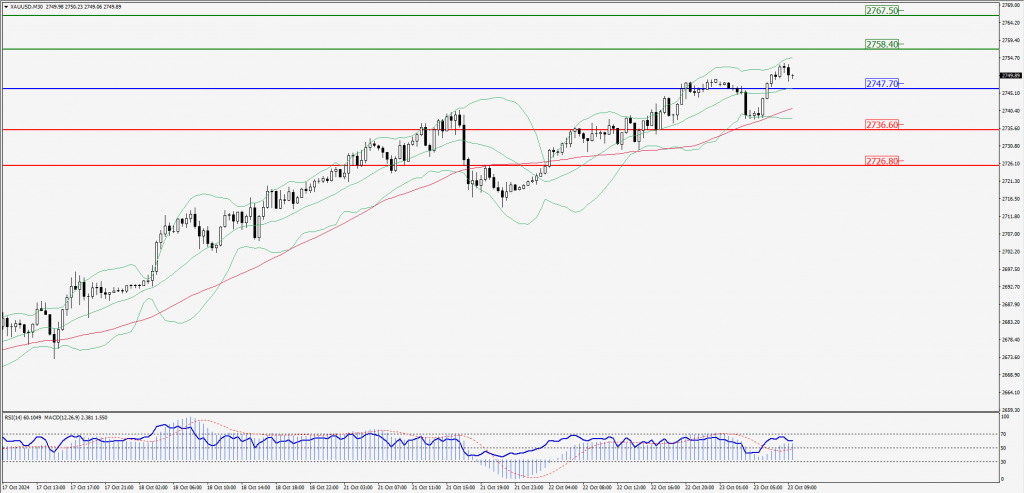
XAU/USD Intraday: Trend on the upside
Our pivot point is at 2747.70
Preferable Price Action: Further upside to 2758.40 and 2767.50.
Alternative Price Action: If the price gives an downside breakout of a pivot, then the price extends to 2736.60 and 2726.80.
Comment: MACD is above 50 levels and pairs above its 55MA & 20MA.
Green Lines Indicate Resistance Levels – Red Lines Indicate Support Levels
Light Blue is a Pivot Point – Black represents the price when the report was produced
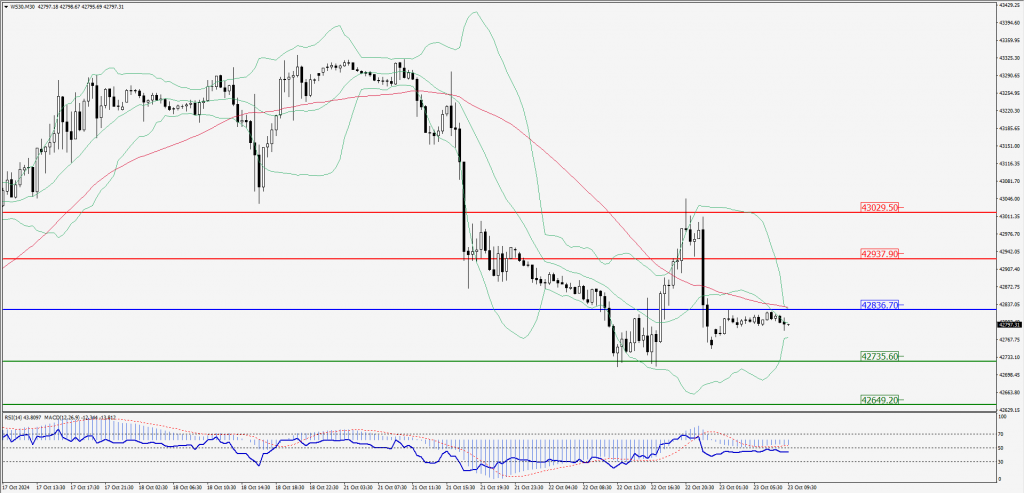
Dow Jones Intraday: Trend on the downside
Our pivot point is 42,836.70
Preferable Price Action: Take sell positions below the pivot with targets at 42,735.60 & 42,649.20.
Alternative Price Action: Above 42,836.70 looks for further upside to 42,937.90 & 43,029.50.
Comment: RSI is below 50 levels and pairs below its 55MA.
Green Lines Indicate Resistance Levels – Red Lines Indicate Support Levels
Light Blue is a Pivot Point – Black represents the price when the report was produced