Market Wrap: Stocks, Bonds, Commodities
Most Asian currencies steadied from recent losses on Thursday with the Japanese yen remaining close to near three-month lows, while the dollar remained underpinned by expectations of slower interest rate cuts.
The Dow Jones Industrial Average fail 409.94 points to 42,514.95, the S&P 500 loss 0.92% to 5,797.40 and the Nasdaq Composite descend 296.48 points to 18,276.40.
MSCI’s index of Asia-Pacific stocks outside Japan is down 0.58% to 738.88 levels. The Australian index was lower by 0.12% to 8,206.30. Japanese Nikkei Index increase 0.26% today.
European stocks were positive on Thursday, with the Stoxx Europe 50 Index increase 0.85% to 4,964.15 Germany’s DAX ascend 0.70% to 19,519.45, and France’s CAC higher 0.77% to 7,555.03 and U.K.’s FTSE 100 gain 0.76% to 8,321.48.
Benchmark 10-year U.S. Treasury rose as demand for safe assets slipped again, today 10-year bond yields 1.06% to 4.2000.
Oil prices climbed by around 1% on Thursday, reversing some of previous session’s losses, as Middle East tensions kept the market on edge ahead of the U.S. presidential election amid expectations of strong distillates demand in fourth quarter.
Spot Brent crude oil increase 0.60% to $76.16 per barrel. US West Texas Intermediate crude is increase 1.77% to $72.02 a barrel.
The yellow metal gold is up 0.71% to 2,748.80 dollars per ounce.
Market Wrap: Forex
The U.S. dollar slipped slightly lower Thursday, but remained close to three-month highs underpinned by expectations for a slower pace of interest rate cuts by the Federal Reserve ahead of the upcoming US presidential election.
Today, the U.S. dollar index measures the Greenback against a trade-weighted basket of six major currencies, which decrease 0.20% to 104.067.
The Euro US Dollar (EUR/USD) is a widely traded is up 0.18% today. This left the pair trading around $1.08000.
The Japanese yen was will move negative against the U.S. dollar on Thursday. Today USD/JPY is trades pair that decrease 0.42% to the 152.110 level.
Another commodity-related currency positive against the U.S dollar, AUD/USD gain 0.37% to 0.66570, and NZD/USD increase 0.37% to 0.60270 level.
EUR/USD Intraday: Trend on the downside
Our pivot point is at 1.07780
Preferable Price Action: Take sell positions below pivot level with targets at 1.07610 & 1.07470 in extension.
Alternative Price Action: Buy pivot looks for a further upside to 1.07940 & 1.08090.
Comment: RSI is below 50 levels and pairs below its 55MA.
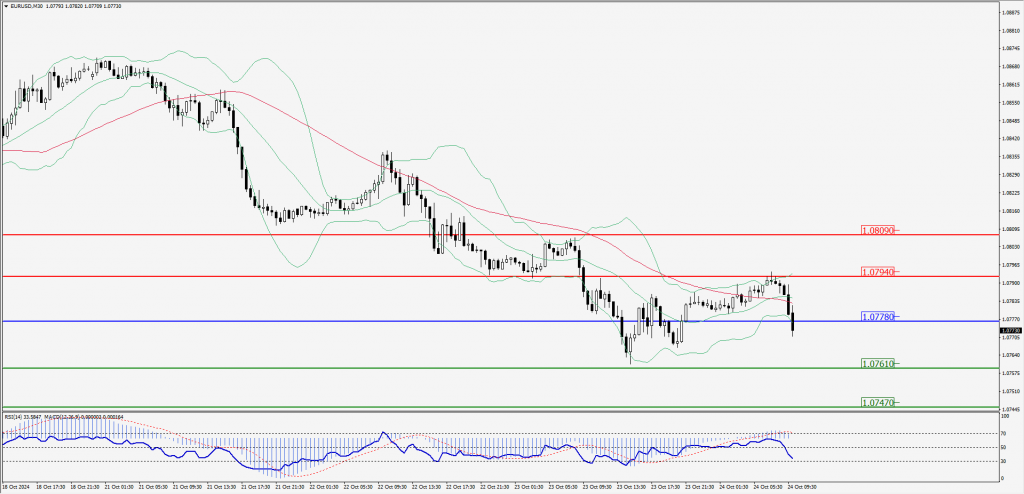
Green Lines Indicate Resistance Levels – Red Lines Indicate Support Levels
Light Blue is a Pivot Point – Black represents the price when the report was produced
GBP/USD Intraday: Major trend on the upside
Our pivot point is at 1.29470
Preferable Price Action: Buy positions above pivot with targets at 1.29670 & 1.29840 in extension.
Alternative Price Action: The price below pivot would call for further downside to 1.29260 & 1.29080.
Comment: RSI is above 50 levels and pairs above its 20MA & 55MA.
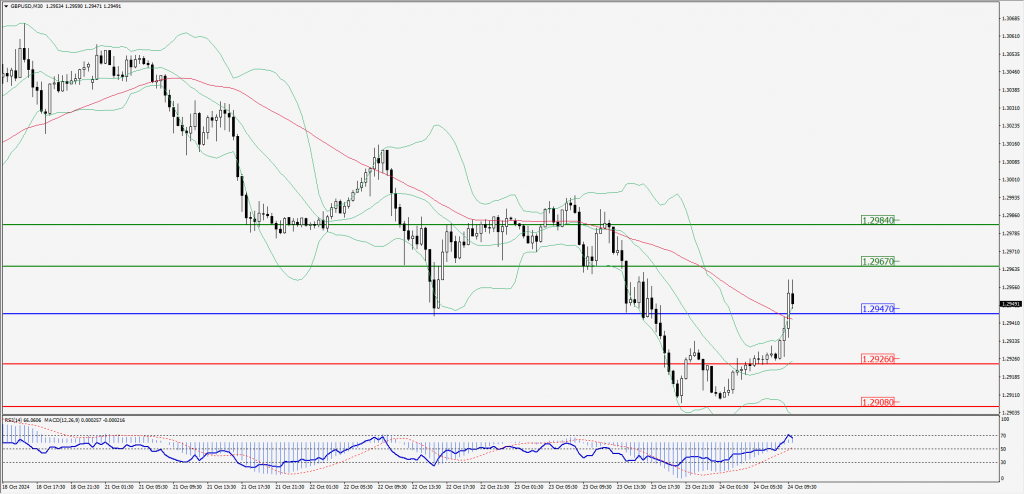
Green Lines Indicate Resistance Levels – Red Lines Indicate Support Levels
Light Blue is a Pivot Point – Black represents the price when the report was produced
USD/JPY Intraday: Trend on the downside
Our pivot point is at 152.350
Preferable Price Action: Sell position below pivot with the target at 151.830 and 151.320 in extension.
Alternative Price Action: The upside breakout of the pivot would call for 151.830 and 151.320.
Comment: MACD is below 50 levels and pairs below its 55MA & 20MA.
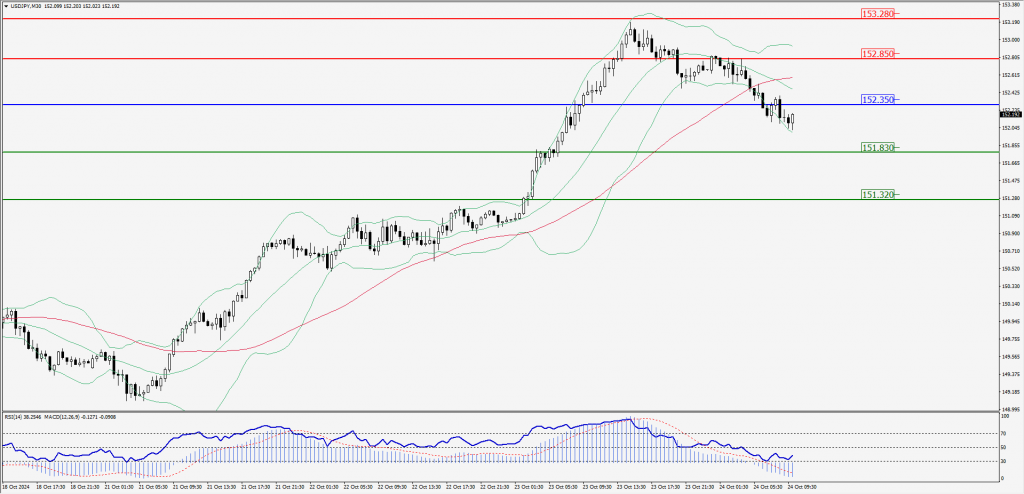
Green Lines Indicate Resistance Levels – Red Lines Indicate Support Levels
Light Blue is a Pivot Point – Black represents the price when the report was produced
AUD/USD Intraday: Trend on the upside
Our pivot point is at 0.66520
Preferable Price Action: Buy positions above pivot with targets at 0.66650 & 0.66770 in extension.
Alternative Price Action: Below pivot a further downside with 0.66400 & 0.66270 as targets.
Comment: RSI is above 50 levels and pairs above its 55MA & 20MA.
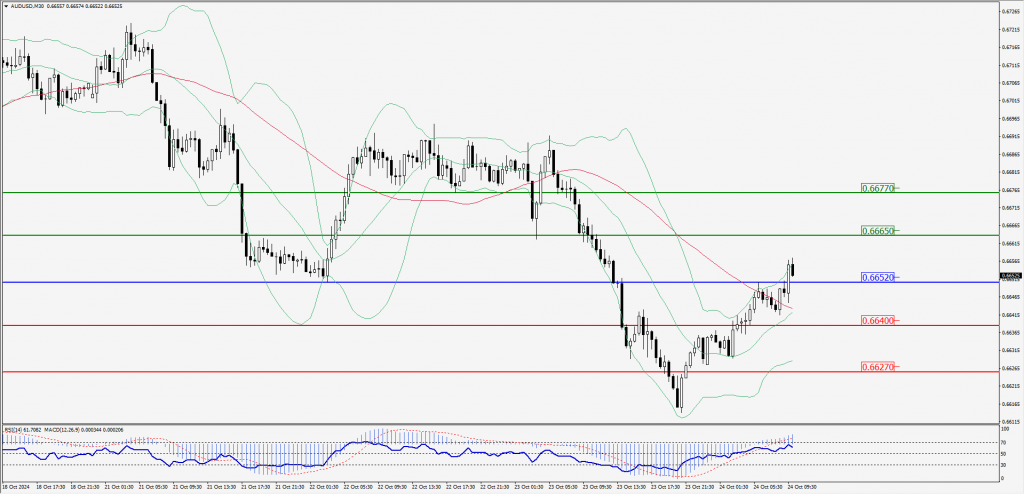
Green Lines Indicate Resistance Levels – Red Lines Indicate Support Levels
Light Blue is a Pivot Point – Black represents the price when the report was produced
CRUDEOIL Intraday: Trend on the upside
Our pivot point is at 71.48
Preferable Price Action: Above pivot buy oil with 71.87 & 72.23 as targets.
Alternative Price Action: Sell crude below pivot with targets at 71.12 & 70.77 in extension.
Comment: RSI is at above 50 levels and pairs above its 55MA & 20MA.
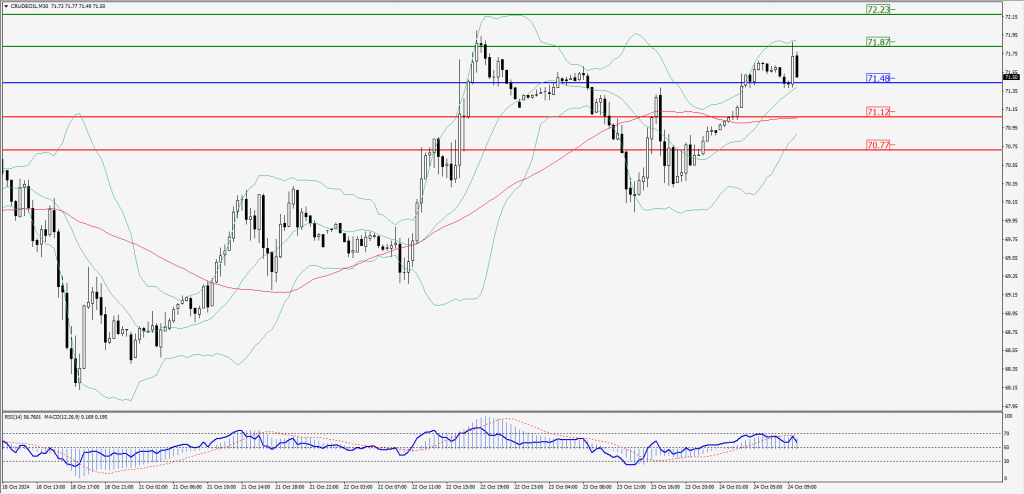
Green Lines Indicate Resistance Levels – Red Lines Indicate Support Levels
Light Blue is a Pivot Point – Black represents the price when the report was produced
XAU/USD Intraday: Trend on the upside
Our pivot point is at 2733.80
Preferable Price Action: Further upside to 2740.50 and 2746.90.
Alternative Price Action: If the price gives an downside breakout of a pivot, then the price extends to 2726.80 and 2720.70.
Comment: MACD is above 50 levels and pairs above its 55MA & 20MA.
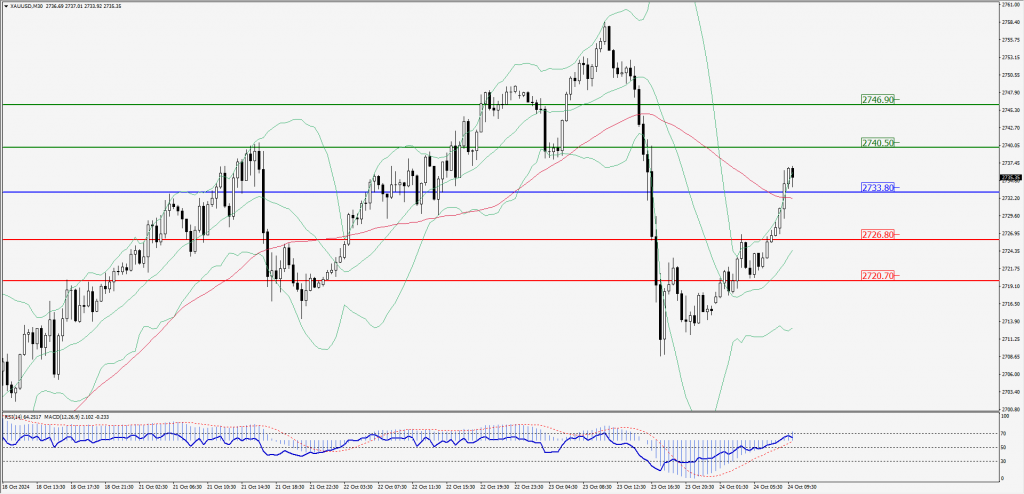
Green Lines Indicate Resistance Levels – Red Lines Indicate Support Levels
Light Blue is a Pivot Point – Black represents the price when the report was produced
Dow Jones Intraday: Trend on the upside
Our pivot point is 42,495.70
Preferable Price Action: Take buy positions above the pivot with targets at 42,617.70 & 42,738.20.
Alternative Price Action: Below 42,495.70 looks for further downside to 42,375.20 & 42,262.40.
Comment: RSI is above 50 levels and pairs above its 20MA.
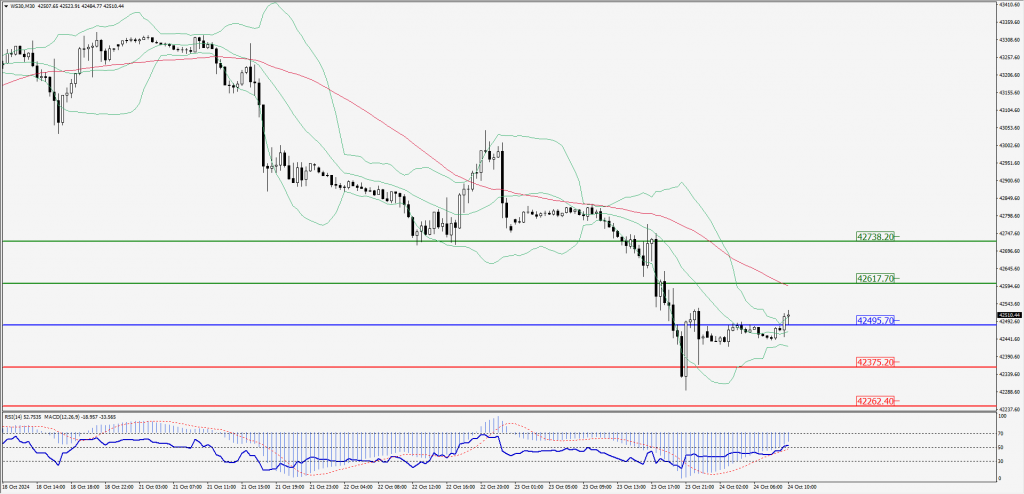
Green Lines Indicate Resistance Levels – Red Lines Indicate Support Levels
Light Blue is a Pivot Point – Black represents the price when the report was produced