Market Wrap: Stocks, Bonds, Commodities
Most Asian currencies moved in a flat-to-low range on Tuesday with the Japanese yen hitting its weakest level since late-July, while the dollar steadied near recent peaks with focus on interest rates and the upcoming presidential election.
The Dow Jones Industrial Average fail 344.31 points to 42,931.60, the S&P 500 loss 0.18% to 5,853.98 and the Nasdaq Composite ascend 50.46 points to 18,540.01.
MSCI’s index of Asia-Pacific stocks outside Japan is down 1.14% to 744.25 levels. The Australian index was higher by 1.66% to 8,205.70. Japanese Nikkei Index decrease 1.60% today.
European stocks were mixed on Tuesday, with the Stoxx Europe 50 Index increase 0.33% to 4,957.45 Germany’s DAX ascend 0.53% to 19,557.85, and France’s CAC lower 0.02% to 7,534.56 and U.K.’s FTSE 100 loss 0.31% to 8,292.36.
Benchmark 10-year U.S. Treasury rose as demand for safe assets slipped again, today 10-year bond yields 0.60% to 4.2120.
Oil prices eased on Tuesday as the top U.S. diplomat renewed efforts to push for a ceasefire in the Middle East and as slowing demand growth in China, the world’s top oil importer, continued to weigh on the market.
Spot Brent crude oil decrease 0.79% to $73.70 per barrel. US West Texas Intermediate crude is decrease 0.81% to $69.47 a barrel.
The yellow metal gold is up 0.35% to 2,748.45 dollars per ounce.
Market Wrap: Forex
The U.S. dollar clung to a 2-1/2-month high on Tuesday on expectations the Federal Reserve will take a measured approach to interest rate cuts, while a close battle in the upcoming U.S. election kept investors on edge.
Today, the U.S. dollar index measures the Greenback against a trade-weighted basket of six major currencies, which decrease 0.12% to 103.709.
The Euro US Dollar (EUR/USD) is a widely traded is up 0.12% today. This left the pair trading around $1.08270.
The Japanese yen was will move negative against the U.S. dollar on Tuesday. Today USD/JPY is trades pair that decrease 0.02% to the 150.810 level.
Another commodity-related currency positive against the U.S dollar, AUD/USD gain 0.42% to 0.66860, and NZD/USD increase 0.44% to 0.60560 level.
EUR/USD Intraday: Trend on the upside
Our pivot point is at 1.08240
Preferable Price Action: Take buy positions above pivot level with targets at 1.08350 & 1.08450 in extension.
Alternative Price Action: Sell pivot looks for a further downside to 1.08140 & 1.08040.
Comment: RSI is above 50 levels and pairs above its 20MA.
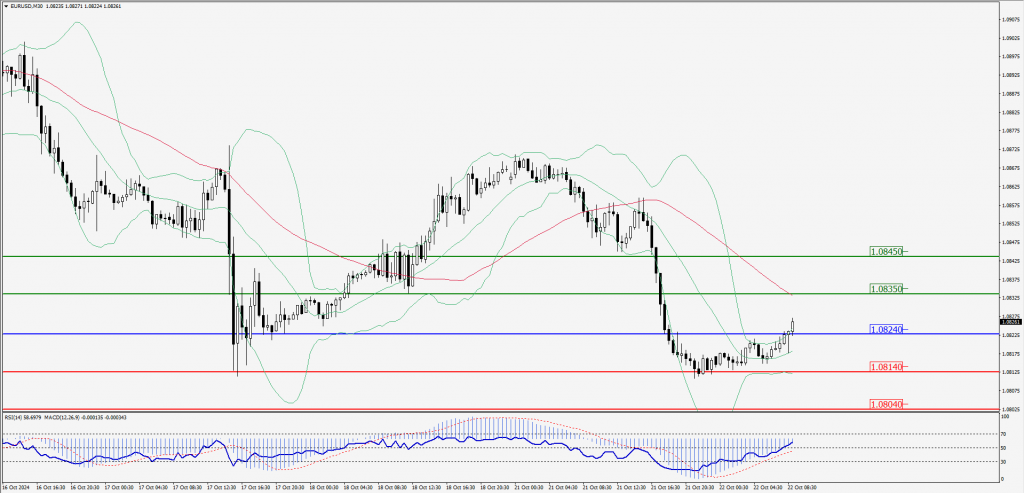
Green Lines Indicate Resistance Levels – Red Lines Indicate Support Levels
Light Blue is a Pivot Point – Black represents the price when the report was produced
GBP/USD Intraday: Trend on the upside
Our pivot point is at 1.30080
Preferable Price Action: Buy positions above pivot with targets at 1.30200 & 1.30320 in extension.
Alternative Price Action: The price below pivot would call for further downside to 1.29960 & 1.29840.
Comment: RSI is above 50 levels and pairs above its 20MA.
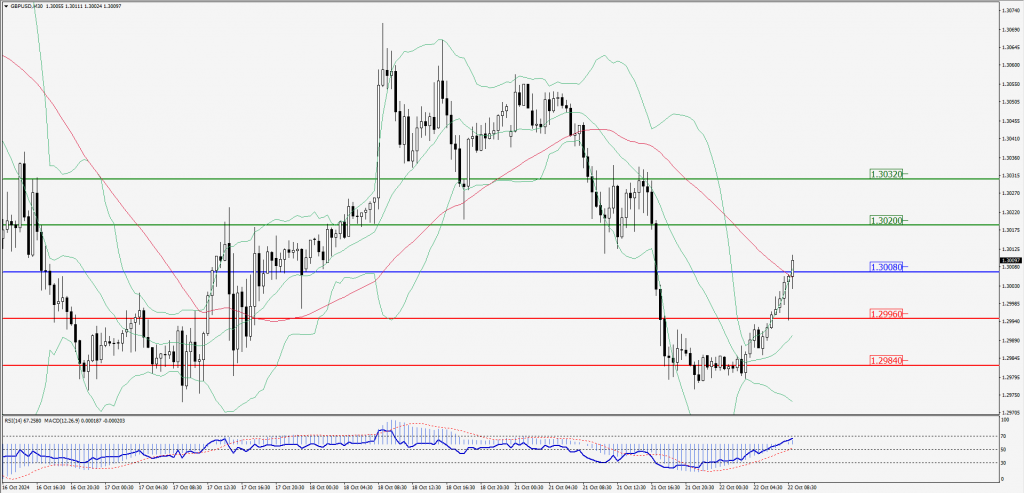
Green Lines Indicate Resistance Levels – Red Lines Indicate Support Levels
Light Blue is a Pivot Point – Black represents the price when the report was produced
USD/JPY Intraday: Trend on the upside
Our pivot point is at 150.690
Preferable Price Action: Buy position above pivot with the target at 150.920 and 151.140 in extension.
Alternative Price Action: The downside breakout of the pivot would call for 150.460 and 150.240.
Comment: MACD is above 50 levels and pairs above its 55MA.
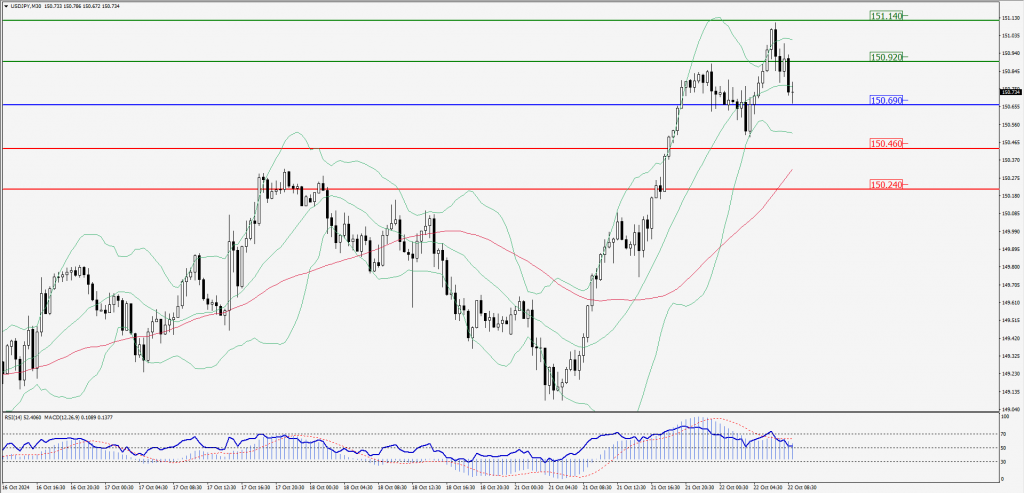
Green Lines Indicate Resistance Levels – Red Lines Indicate Support Levels
Light Blue is a Pivot Point – Black represents the price when the report was produced
AUD/USD Intraday: Major trend on the upside
Our pivot point is at 0.66860
Preferable Price Action: Buy positions above pivot with targets at 0.66960 & 0.67050 in extension.
Alternative Price Action: Below pivot a further downside with 0.66760 & 0.66670 as targets.
Comment: RSI is above 50 levels and pairs above its 55MA & 20MA.
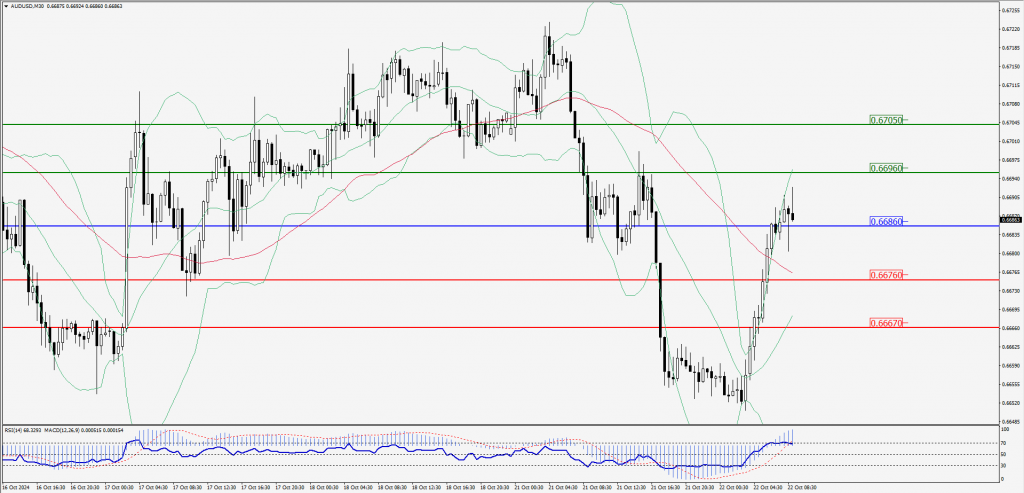
Green Lines Indicate Resistance Levels – Red Lines Indicate Support Levels
Light Blue is a Pivot Point – Black represents the price when the report was produced
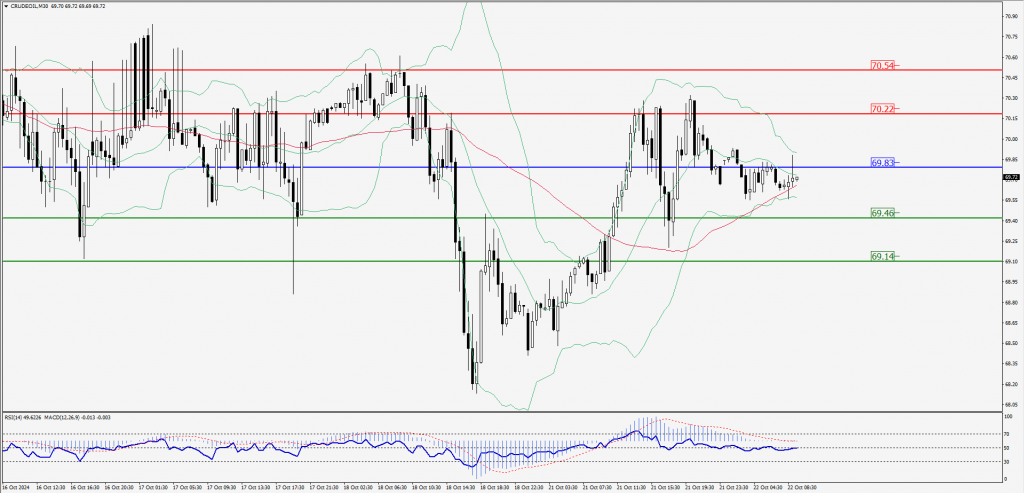
CRUDEOIL Intraday: Trend on the downside
Our pivot point is at 69.83
Preferable Price Action: Below pivot sell oil with 69.46 & 69.14 as targets.
Alternative Price Action: Buy crude above pivot with targets at 70.22 & 70.54 in extension.
Comment: RSI is at below 50 levels and pairs below its 20MA.
Green Lines Indicate Resistance Levels – Red Lines Indicate Support Levels
Light Blue is a Pivot Point – Black represents the price when the report was produced
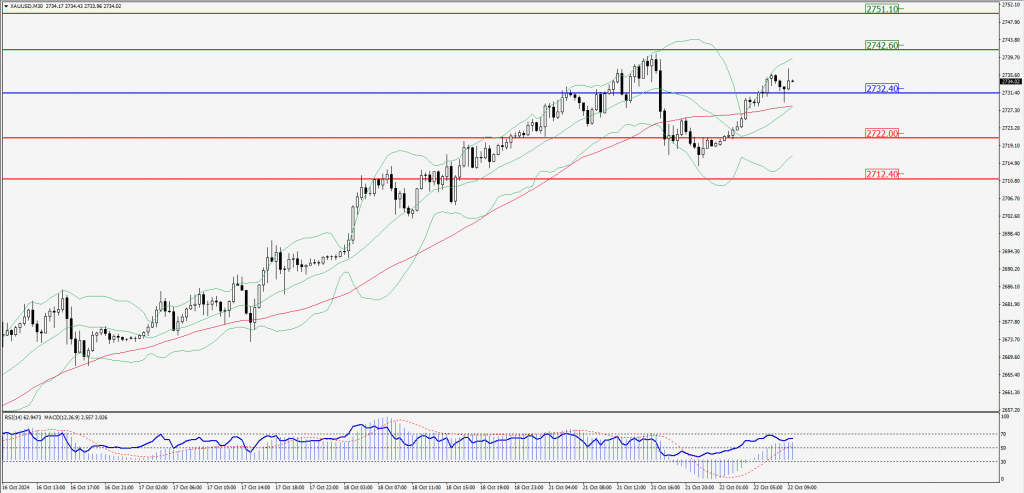
XAU/USD Intraday: Trend on the upside
Our pivot point is at 2732.40
Preferable Price Action: Further upside to 2742.60 and 2751.10.
Alternative Price Action: If the price gives an downside breakout of a pivot, then the price extends to 2722.00 and 2712.40.
Comment: MACD is above 50 levels and pairs above its 55MA & 20MA.
Green Lines Indicate Resistance Levels – Red Lines Indicate Support Levels
Light Blue is a Pivot Point – Black represents the price when the report was produced
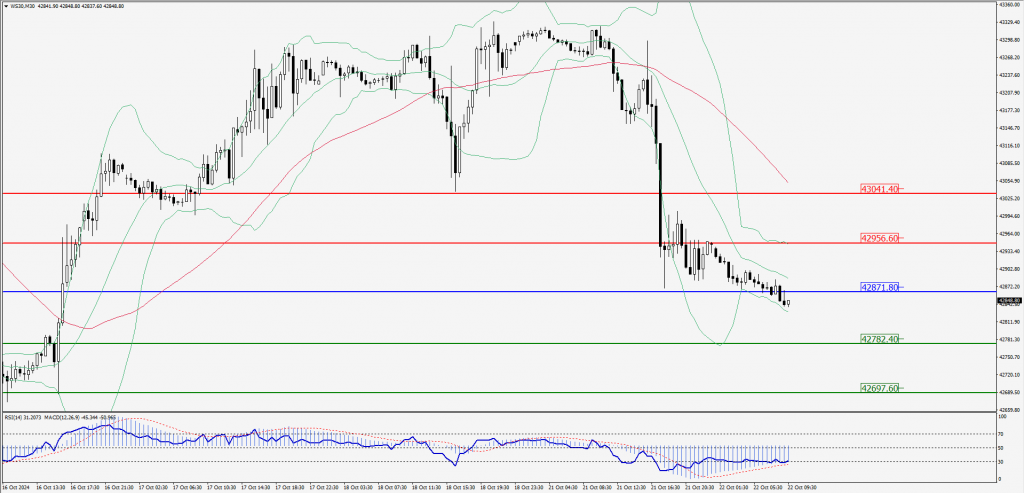
Dow Jones Intraday: Trend on the downside
Our pivot point is 42,871.80
Preferable Price Action: Take sell positions below the pivot with targets at 42,782.40 & 42,697.60.
Alternative Price Action: Above 42,871.80 looks for further upside to 42,956.60 & 43,041.40.
Comment: RSI is below 50 levels and pairs below its 20MA & 55MA.
Green Lines Indicate Resistance Levels – Red Lines Indicate Support Levels
Light Blue is a Pivot Point – Black represents the price when the report was produced