Market Wrap: Stocks, Bonds, Commodities
Most Asian currencies kept to a tight range on Wednesday, while the dollar steadied in anticipation of more signals from the Federal Reserve and U.S. inflation on the path of interest rates.
The Dow Jones Industrial Average rose 126.13 points to 42,080.37, the S&P 500 gain 0.97% to 5,751.13 and the Nasdaq Composite ascend 259.02 points to 18,182.92.
MSCI’s index of Asia-Pacific stocks outside Japan is down 3.33% to 750.99 levels. The Australian index was higher by 0.13% to 8,187.40. Japanese Nikkei Index increase 1.01% today.
European stocks were mixed on Wednesday, with the Stoxx Europe 50 Index decrease 0.27% to 4,935.55 Germany’s DAX descend 0.12% to 19,047.25, and France’s CAC lower 0.14% to 7,510.79 and U.K.’s FTSE 100 gain 0.36% to 8,220.38.
Benchmark 10-year U.S. Treasury fail as demand for safe assets slipped again, today 10-year bond yields 0.47% to 4.0170.
Oil prices edged up on Wednesday as developments in the Middle East took centre stage against cautious demand expectations and ahead of a government meeting on China’s fiscal policy.
Spot Brent crude oil increase 0.48% to $77.55 per barrel. US West Texas Intermediate crude is increase 0.33% to $73.81 a barrel.
The yellow metal gold is down 0.28% to 2,628.00 dollars per ounce.
Market Wrap: Forex
The dollar drifted sideways on Wednesday, giving some relief to the yen and other major currencies after a sharp rally to a seven-week high last week, as investors paused to assess the interest rate outlook for the United States.
Today, the U.S. dollar index measures the Greenback against a trade-weighted basket of six major currencies, which increase 0.13% to 102.435.
The Euro US Dollar (EUR/USD) is a widely traded is down 0.22% today. This left the pair trading around $1.09550.
The Japanese yen was will move positive against the U.S. dollar on Wednesday. Today USD/JPY is trades pair that increase 0.05% to the 148.270 level.
Another commodity-related currency negative against the U.S dollar, AUD/USD loss 0.28% to 0.67260, and NZD/USD decrease 0.94% to 0.60800 level.
EUR/USD Intraday: Trend on the downside
Our pivot point is at 1.09710
Preferable Price Action: Take sell positions below pivot level with targets at 1.09600 & 1.09500 in extension.
Alternative Price Action: Buy pivot looks for a further upside to 1.09820 & 1.09920.
Comment: RSI is below 50 levels and pairs below its 55MA & 20MA.
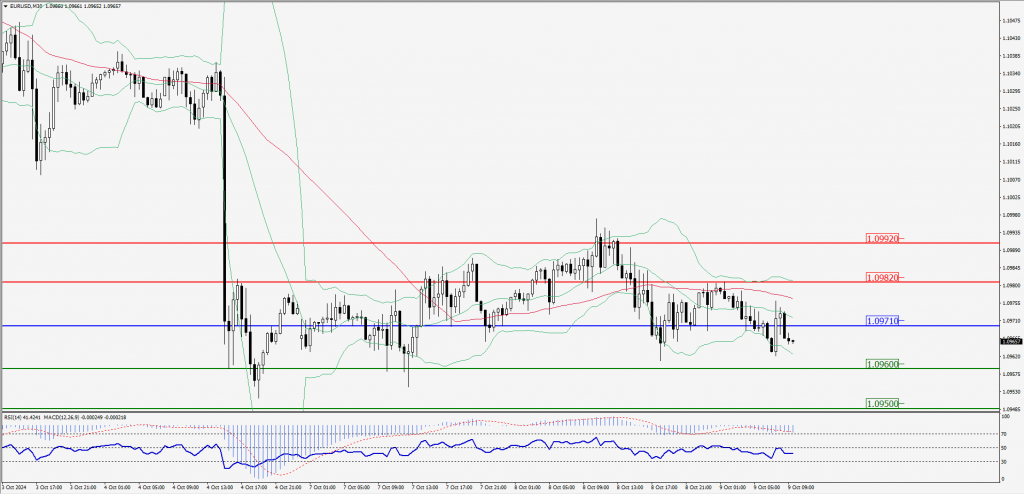
Green Lines Indicate Resistance Levels – Red Lines Indicate Support Levels
Light Blue is a Pivot Point – Black represents the price when the report was produced
GBP/USD Intraday: Resistance level at 1.30910
Our pivot point is at 1.30910
Preferable Price Action: Sell positions below pivot with targets at 1.30750 & 1.30610 in extension.
Alternative Price Action: The price above pivot would call for further upside to 1.31070 & 1.31230.
Comment: RSI is below 50 levels and pairs below its 55MA & 20MA.
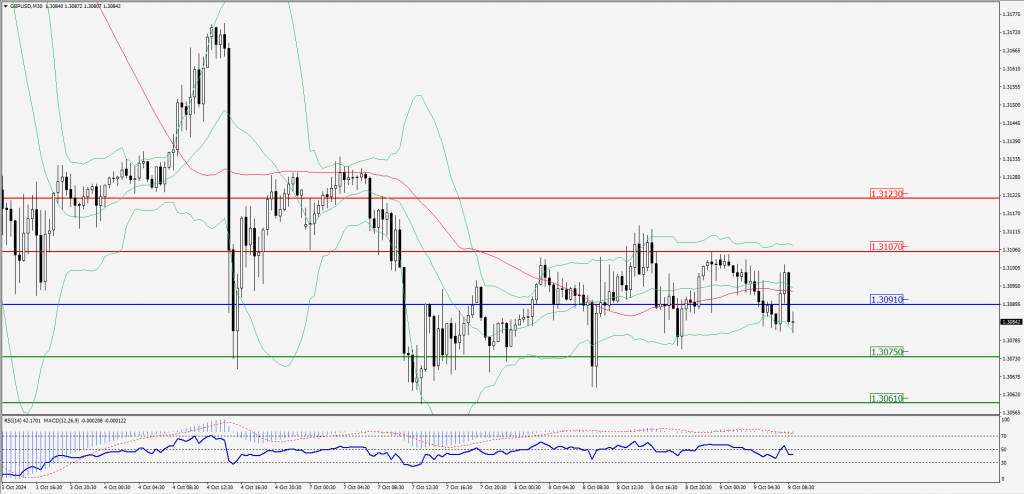
Green Lines Indicate Resistance Levels – Red Lines Indicate Support Levels
Light Blue is a Pivot Point – Black represents the price when the report was produced
USD/JPY Intraday: Trend on the upside
Our pivot point is at 148.440
Preferable Price Action: Buy position above pivot with the target at 148.820 and 149.200 in extension.
Alternative Price Action: The downside breakout of the pivot would call for 148.050 and 147.690.
Comment: MACD is above 50 levels and pairs above its 55MA & 20MA.
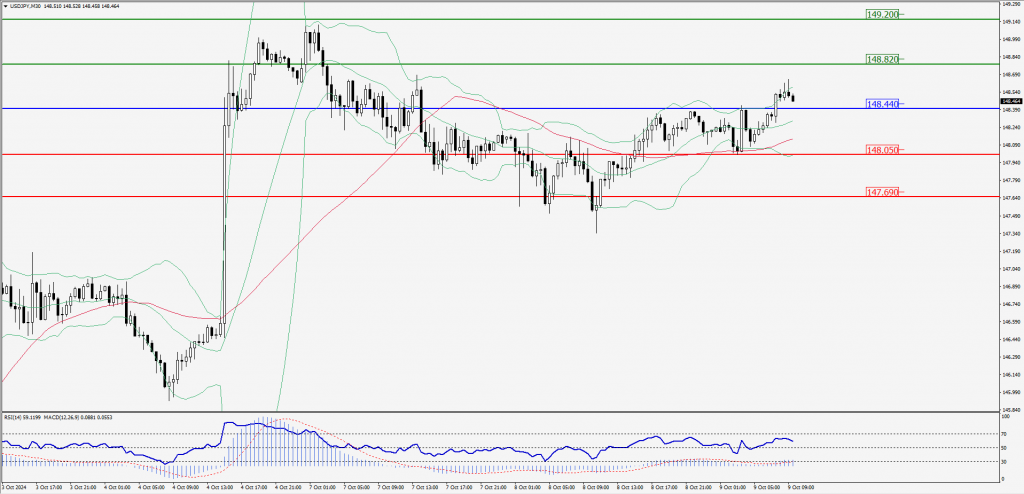
Green Lines Indicate Resistance Levels – Red Lines Indicate Support Levels
Light Blue is a Pivot Point – Black represents the price when the report was produced
AUD/USD Intraday: Trend on the upside
Our pivot point is at 0.67350
Preferable Price Action: Buy positions above pivot with targets at 0.67560 & 0.67740 in extension.
Alternative Price Action: Below pivot a further downside with 0.67140 & 0.66950 as targets.
Comment: RSI is above 50 levels.
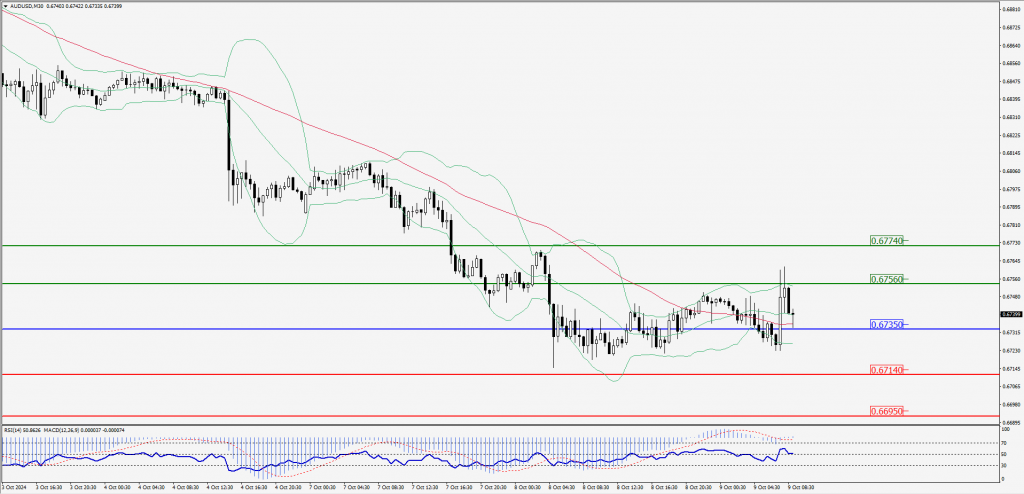
Green Lines Indicate Resistance Levels – Red Lines Indicate Support Levels
Light Blue is a Pivot Point – Black represents the price when the report was produced
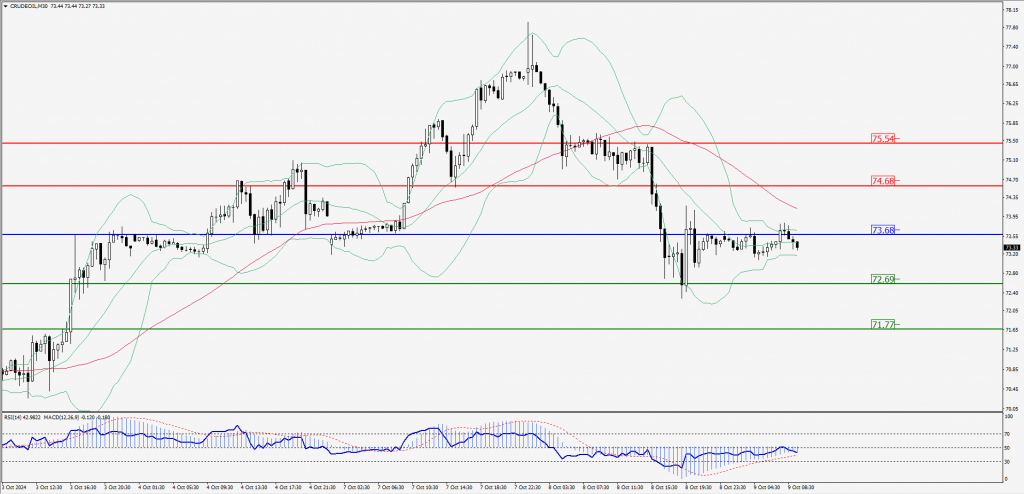
CRUDEOIL Intraday: Trend on the downside
Our pivot point is at 73.68
Preferable Price Action: Below pivot sell oil with 72.69 & 71.77 as targets.
Alternative Price Action: Buy crude above pivot with targets at 74.68 & 75.54 in extension.
Comment: RSI is at below 50 levels and pairs below its 50MA.
Green Lines Indicate Resistance Levels – Red Lines Indicate Support Levels
Light Blue is a Pivot Point – Black represents the price when the report was produced
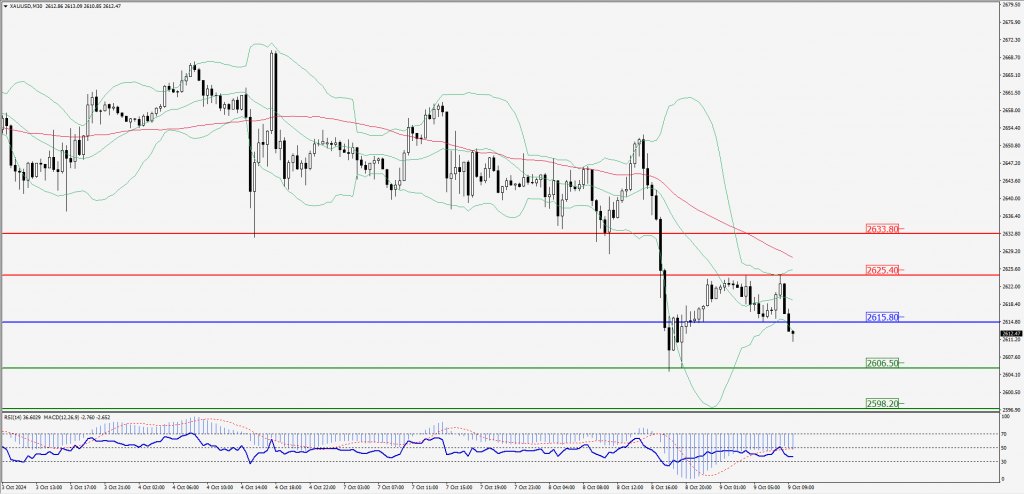
XAU/USD Intraday: Trend on the downside
Our pivot point is at 2615.80
Preferable Price Action: Further downside to 2606.50 and 2598.20.
Alternative Price Action: If the price gives an upside breakout of a pivot, then the price extends to 2625.40 and 2633.80.
Comment: MACD is below 50 levels and pairs below its 55MA & 20MA.
Green Lines Indicate Resistance Levels – Red Lines Indicate Support Levels
Light Blue is a Pivot Point – Black represents the price when the report was produced
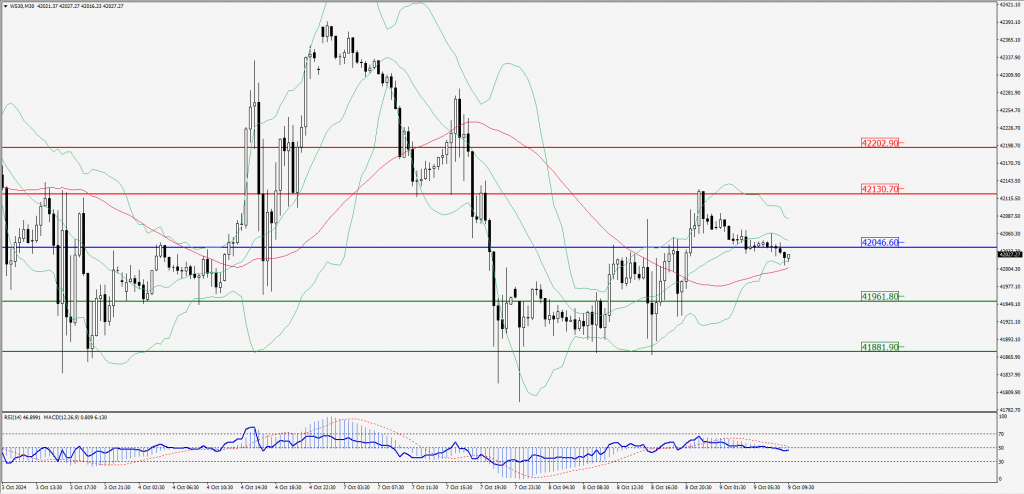
Dow Jones Intraday: Trend on the downside
Our pivot point is 42,046.60
Preferable Price Action: Take sell positions below the pivot with targets at 41,961.80 & 41,881.90.
Alternative Price Action: Above 42,046.60 looks for further upside to 42,130.70 & 42,202.90.
Comment: RSI is below 50 levels and pairs below its 20MA.
Green Lines Indicate Resistance Levels – Red Lines Indicate Support Levels
Light Blue is a Pivot Point – Black represents the price when the report was produced