Market Wrap: Stocks, Bonds, Commodities
The US dollar has remained stable as markets processed the increasing geopolitical risks in the Middle East and awaited further US economic data.
The Dow Jones Industrial Average rose 39.55 points to 42,196.52, the S&P 500 gain 0.01% to 5,709.54 and the Nasdaq Composite ascend 14.76 points to 17,925.12.
MSCI’s index of Asia-Pacific stocks outside Japan is up 0.77% to 769.98 levels. The Australian index was higher by 0.09% to 8,205.20. Japanese Nikkei Index increase 2.01% today.
European stocks were mixed on Thursday, with the Stoxx Europe 50 Index decrease 0.40% to 4,943.45 Germany’s DAX descend 0.27% to 19,096.55, and France’s CAC lower 0.46% to 7,543.08 and U.K.’s FTSE 100 gain 0.24% to 8,310.75.
Benchmark 10-year U.S. Treasury rose as demand for safe assets slipped again, today 10-year bond yields 0.45% to 3.8050.
Oil prices rose on Thursday as the prospect of a widening Middle East conflict that could disrupt crude oil flows from the key exporting region overshadowed a stronger global supply outlook.
Spot Brent crude oil increase 1.37% to $74.91 per barrel. US West Texas Intermediate crude is increase 1.55% to $71.19 a barrel.
The yellow metal gold is up 0.18% to 2,674.60 dollars per ounce.
Market Wrap: Forex
The dollar hit a three-week high against the euro on Wednesday after the ADP national employment report showed U.S. private payrolls increased more than expected in September, ahead of Friday’s highly anticipated jobs data.
Today, the U.S. dollar index measures the Greenback against a trade-weighted basket of six major currencies, which increase 0.20% to 101.624.
The Euro US Dollar (EUR/USD) is a widely traded is down 0.11% today. This left the pair trading around $1.10330.
The Japanese yen was will move positive against the U.S. dollar on Thursday. Today USD/JPY is trades pair that increase 0.22% to the 146.780 level.
Another commodity-related currency negative against the U.S dollar, AUD/USD loss 0.20% to 0.68710, and NZD/USD decrease 0.37% to 0.62390 level.
EUR/USD Intraday: Trend on the downside
Our pivot point is at 1.10460
Preferable Price Action: Take sell positions below pivot level with targets at 1.10170 & 1.19930 in extension.
Alternative Price Action: Buy pivot looks for a further upside to 1.10750 & 1.11000.
Comment: RSI is below 50 levels and pairs below its 55MA.
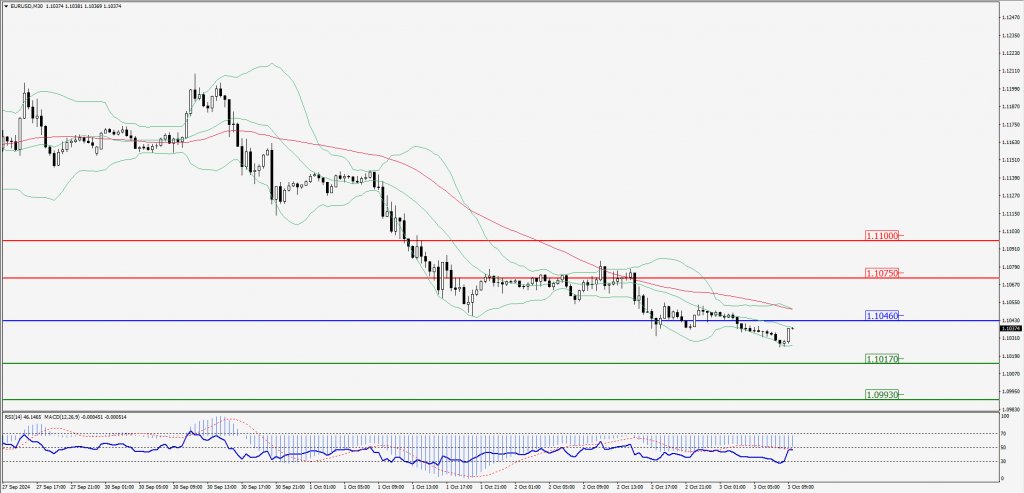
Green Lines Indicate Resistance Levels – Red Lines Indicate Support Levels
Light Blue is a Pivot Point – Black represents the price when the report was produced
GBP/USD Intraday: Major trend on the downside
Our pivot point is at 1.31920
Preferable Price Action: Sell positions below pivot with targets at 1.31410 & 1.30990 in extension.
Alternative Price Action: The price above pivot would call for further upside to 1.32410 & 1.32860.
Comment: RSI is below 50 levels and pairs below its 55MA & 20MA.
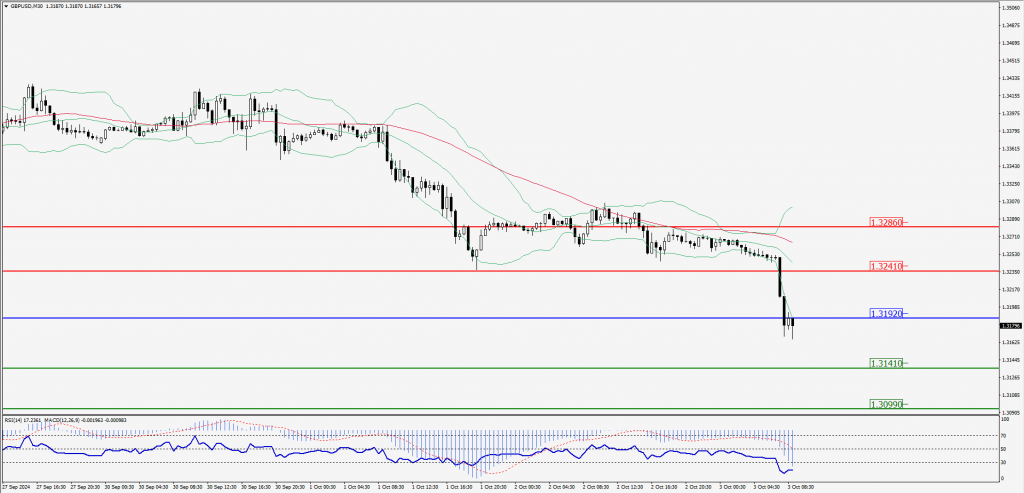
Green Lines Indicate Resistance Levels – Red Lines Indicate Support Levels
Light Blue is a Pivot Point – Black represents the price when the report was produced
USD/JPY Intraday: Trend on the upside
Our pivot point is at 146.610
Preferable Price Action: Buy position above pivot with the target at 147.280 and 147.040 in extension.
Alternative Price Action: The downside breakout of the pivot would call for 145.900 and 145.200.
Comment: MACD is above 50 levels and pairs above its 55MA.
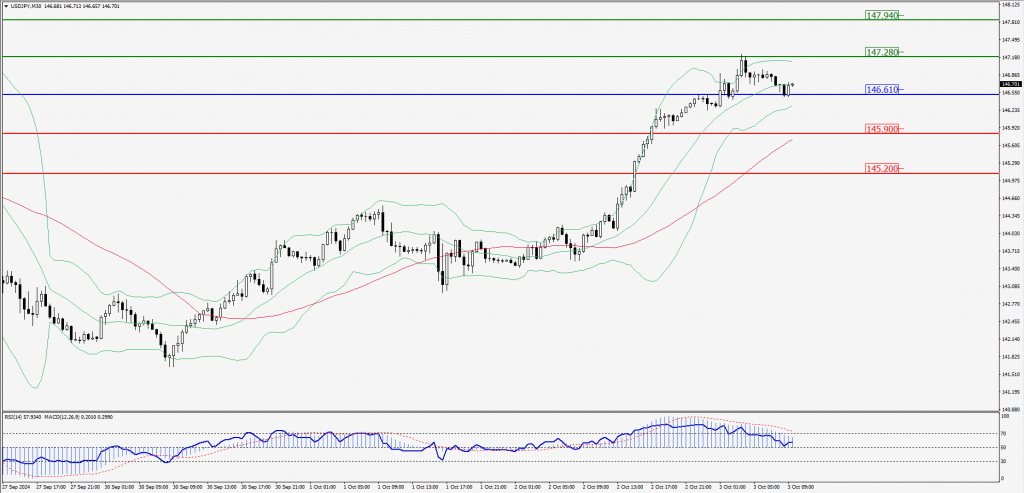
Green Lines Indicate Resistance Levels – Red Lines Indicate Support Levels
Light Blue is a Pivot Point – Black represents the price when the report was produced
AUD/USD Intraday: Trend on the downside
Our pivot point is at 0.68770
Preferable Price Action: Sell positions below pivot with targets at 0.68650 & 0.68550 in extension.
Alternative Price Action: Above pivot a further upside with 0.68890 & 0.69000 as targets.
Comment: RSI is below 50 levels and pairs below its 55MA.
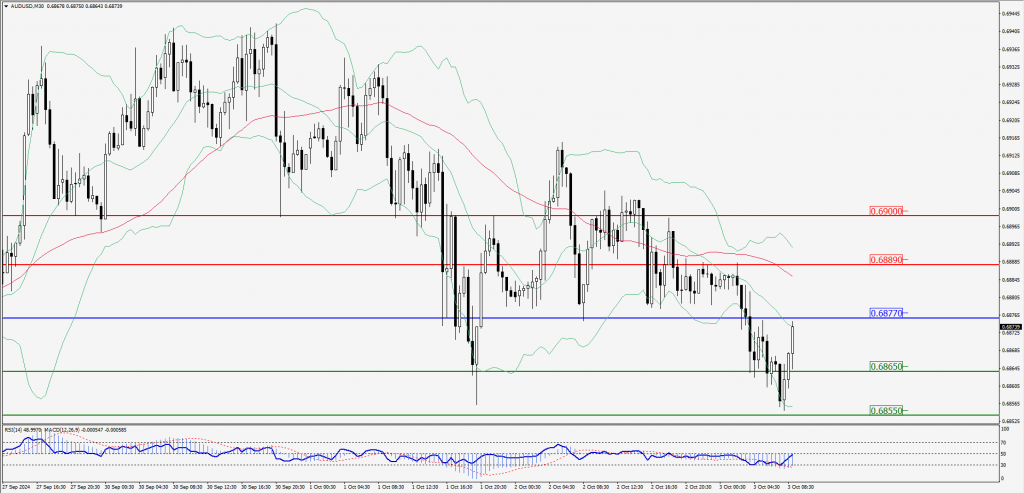
Green Lines Indicate Resistance Levels – Red Lines Indicate Support Levels
Light Blue is a Pivot Point – Black represents the price when the report was produced
CRUDEOIL Intraday: Trend on the upside
Our pivot point is at 70.69
Preferable Price Action: Above pivot buy oil with 71.43 & 72.08 as targets.
Alternative Price Action: Sell crude below pivot with targets at 69.93 and 69.23 in extension.
Comment: RSI is at above 50 levels and pairs above its 20MA.
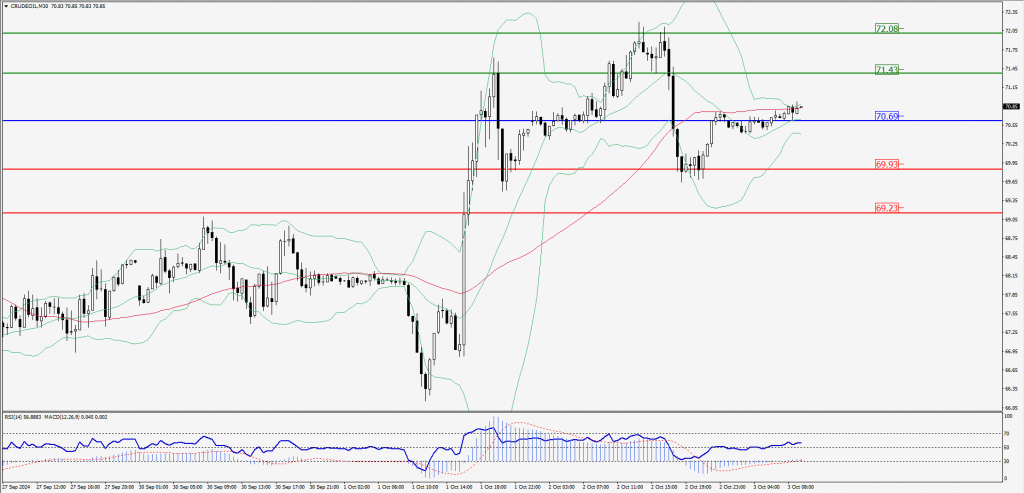
Green Lines Indicate Resistance Levels – Red Lines Indicate Support Levels
Light Blue is a Pivot Point – Black represents the price when the report was produced
XAU/USD Intraday: Trend on the upside
Our pivot point is at 2655.00
Preferable Price Action: Further upside to 2661.80 and 2668.30.
Alternative Price Action: If the price gives an downside breakout of a pivot, then the price extends to 2648.20 and 2642.30.
Comment: MACD is above 50 levels and pairs above its 55MA.
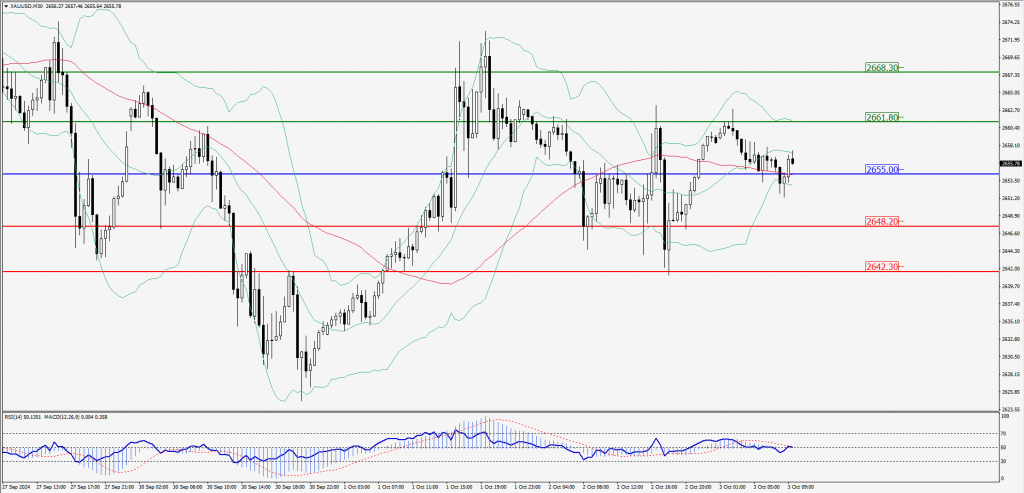
Green Lines Indicate Resistance Levels – Red Lines Indicate Support Levels
Light Blue is a Pivot Point – Black represents the price when the report was produced
Dow Jones Intraday: Trend on the downside
Our pivot point is 42,189.40
Preferable Price Action: Take sell positions below the pivot with targets at 42,091.20 & 41,998.90.
Alternative Price Action: Above 42,189.40 looks for further upside to 42,289.70 & 42,382.00.
Comment: RSI is below 50 levels and pairs below its 20MA.
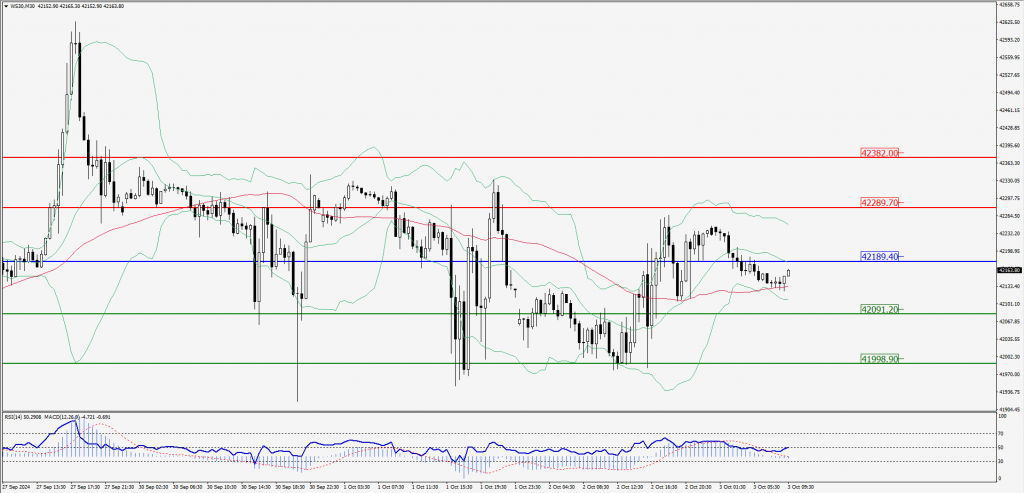
Green Lines Indicate Resistance Levels – Red Lines Indicate Support Levels
Light Blue is a Pivot Point – Black represents the price when the report was produced