Market Wrap: Stocks, Bonds, Commodities
European stock markets edged cautiously higher Wednesday, with investors wary about the possibility of a wider war in the Middle East while awaiting fresh regional employment data.
The Dow Jones Industrial Average fail 173.18 points to 42,156.97, the S&P 500 loss 0.93% to 5,708.75 and the Nasdaq Composite descend 278.81 points to 17,910.36.
MSCI’s index of Asia-Pacific stocks outside Japan is up 1.90% to 776.83 levels. The Australian index was lower by 0.13% to 8,198.20. Japanese Nikkei Index decrease 2.22% today.
European stocks were positive on Wednesday, with the Stoxx Europe 50 Index increase 0.27% to 4,967.55 Germany’s DAX ascend 0.12% to 19,222.35, and France’s CAC higher 0.23% to 7,591.28 and U.K.’s FTSE 100 gain 0.35% to 8,305.21.
Benchmark 10-year U.S. Treasury rose as demand for safe assets slipped again, today 10-year bond yields 0.14% to 3.7500.
Oil prices jumped by over a dollar on Wednesday due to rising concerns Middle East tensions could escalate, potentially disrupting crude output from the region, following Iran’s biggest ever military blow against Israel.
Spot Brent crude oil increase 2.11% to $75.11 per barrel. US West Texas Intermediate crude is increase 2.33% to $71.46 a barrel.
The yellow metal gold is down 0.62% to 2,673.60 dollars per ounce.
Market Wrap: Forex
The dollar held onto its sharpest gains in a week on Wednesday after an Iranian missile attack on Israel drove buying of safe assets as investors fretted about the widening of conflict in the Middle East.
Today, the U.S. dollar index measures the Greenback against a trade-weighted basket of six major currencies, which increase 0.04% to 100.969.
The Euro US Dollar (EUR/USD) is a widely traded is up 0.01% today. This left the pair trading around $1.10690.
The Japanese yen was will move positive against the U.S. dollar on Wednesday. Today USD/JPY is trades pair that increase 0.33% to the 144.040 level.
Another commodity-related currency positive against the U.S dollar, AUD/USD gain 0.14% to 0.69030, and NZD/USD increase 0.16% to 0.62900 level.
EUR/USD Intraday: Trend on the downside
Our pivot point is at 1.10770
Preferable Price Action: Take sell positions below pivot level with targets at 1.10560 & 1.10400 in extension.
Alternative Price Action: Buy pivot looks for a further upside to 1.10980 & 1.11170.
Comment: RSI is below 50 levels and pairs below its 55MA.
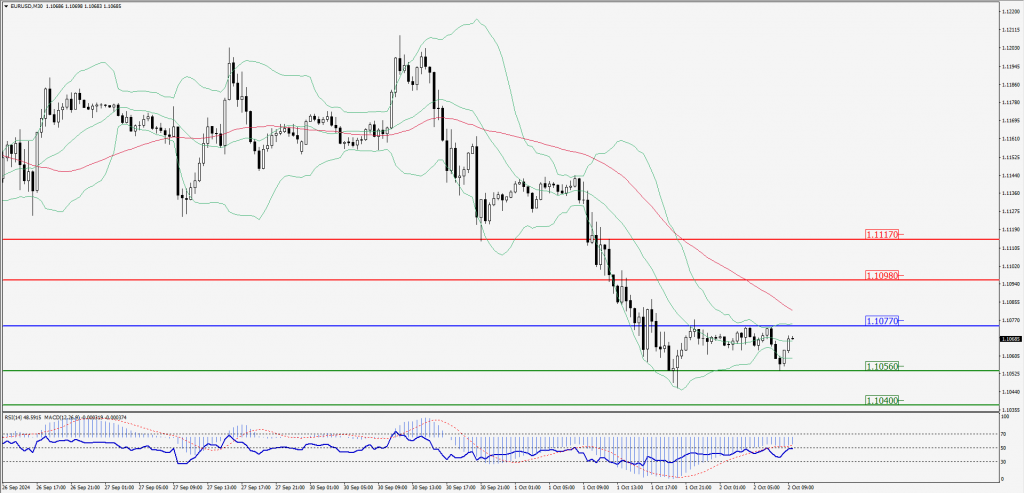
Green Lines Indicate Resistance Levels – Red Lines Indicate Support Levels
Light Blue is a Pivot Point – Black represents the price when the report was produced
GBP/USD Intraday: Trend on the downside
Our pivot point is at 1.32920
Preferable Price Action: Sell positions below pivot with targets at 1.32650 & 1.32400 in extension.
Alternative Price Action: The price above pivot would call for further upside to 1.33180 & 1.33430.
Comment: RSI is below 50 levels and pairs below its 55MA.
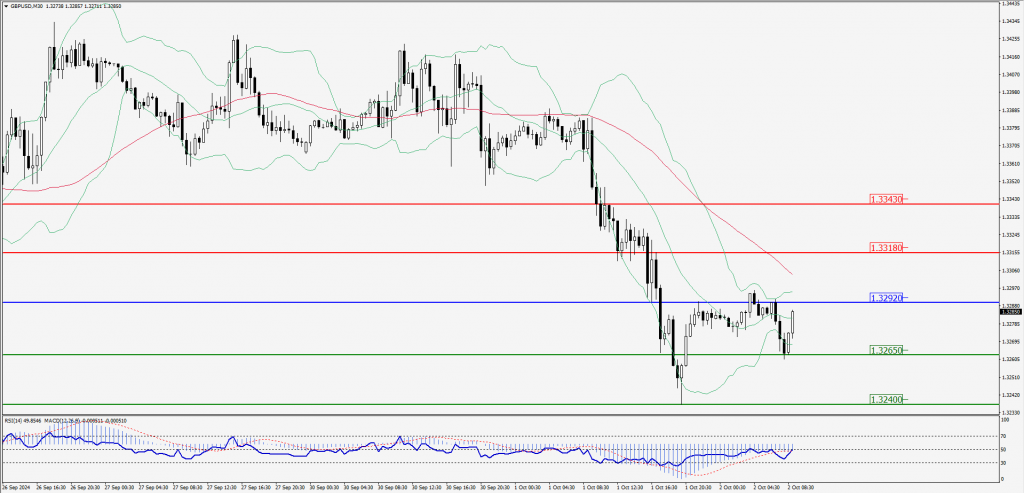
Green Lines Indicate Resistance Levels – Red Lines Indicate Support Levels
Light Blue is a Pivot Point – Black represents the price when the report was produced
USD/JPY Intraday: Trend on the upside
Our pivot point is at 143.810
Preferable Price Action: Buy position above pivot with the target at 144.450 and 145.080 in extension.
Alternative Price Action: The downside breakout of the pivot would call for 143.160 and 142.630.
Comment: MACD is above 50 levels and pairs above its 20MA & 55MA.
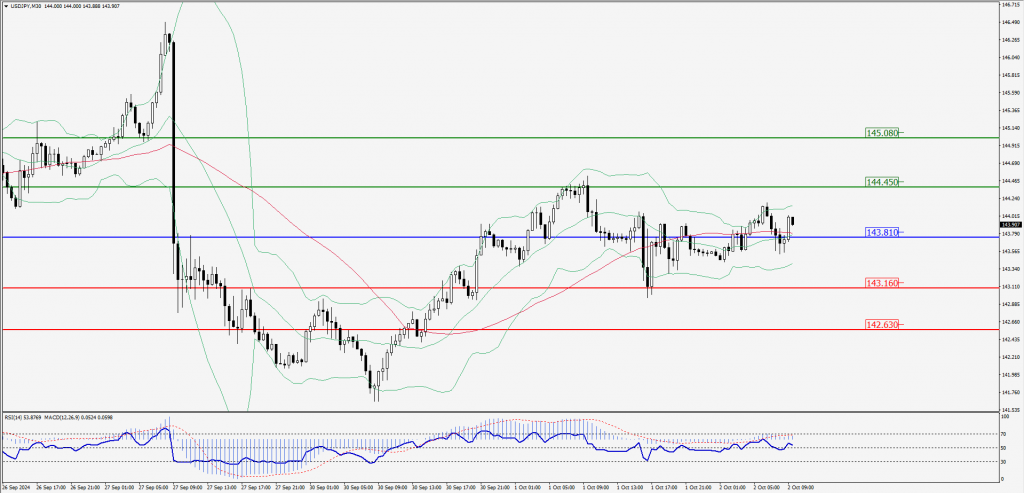
Green Lines Indicate Resistance Levels – Red Lines Indicate Support Levels
Light Blue is a Pivot Point – Black represents the price when the report was produced
AUD/USD Intraday: Trend on the downside
Our pivot point is at 0.68970
Preferable Price Action: Sell positions below pivot with targets at 0.68860 & 0.68770 in extension.
Alternative Price Action: Above pivot a further upside with 0.69070 & 0.69160 as targets.
Comment: RSI is below 50 levels and pairs below its 55MA.
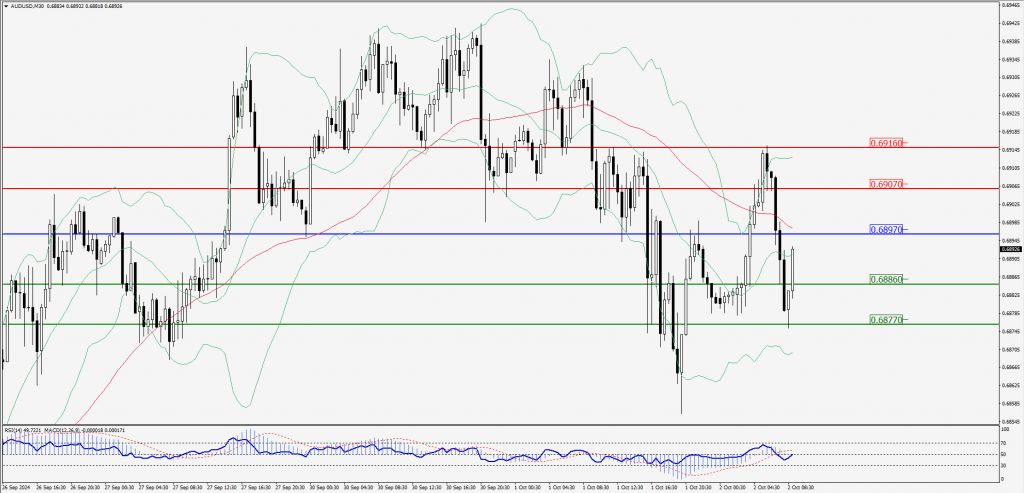
Green Lines Indicate Resistance Levels – Red Lines Indicate Support Levels
Light Blue is a Pivot Point – Black represents the price when the report was produced
CRUDEOIL Intraday: Trend on the upside
Our pivot point is at 70.63
Preferable Price Action: Above pivot buy oil with 71.24 & 71.76 as targets.
Alternative Price Action: Sell crude below pivot with targets at 70.03 and 69.49 in extension.
Comment: RSI is at above 50 levels and pairs above its 55MA & 20MA.
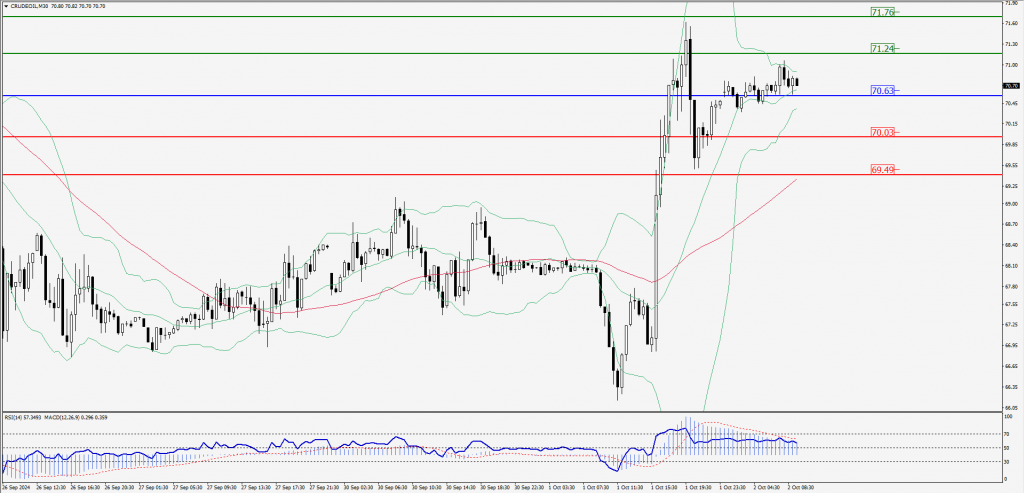
Green Lines Indicate Resistance Levels – Red Lines Indicate Support Levels
Light Blue is a Pivot Point – Black represents the price when the report was produced
XAU/USD Intraday: Trend on the downside
Our pivot point is at 2651.70
Preferable Price Action: Further downside to 2642.80 and 2635.00.
Alternative Price Action: If the price gives an upside breakout of a pivot, then the price extends to 2660.80 and 2668.80.
Comment: MACD is below 50 levels and pairs below its 20MA & 55MA.
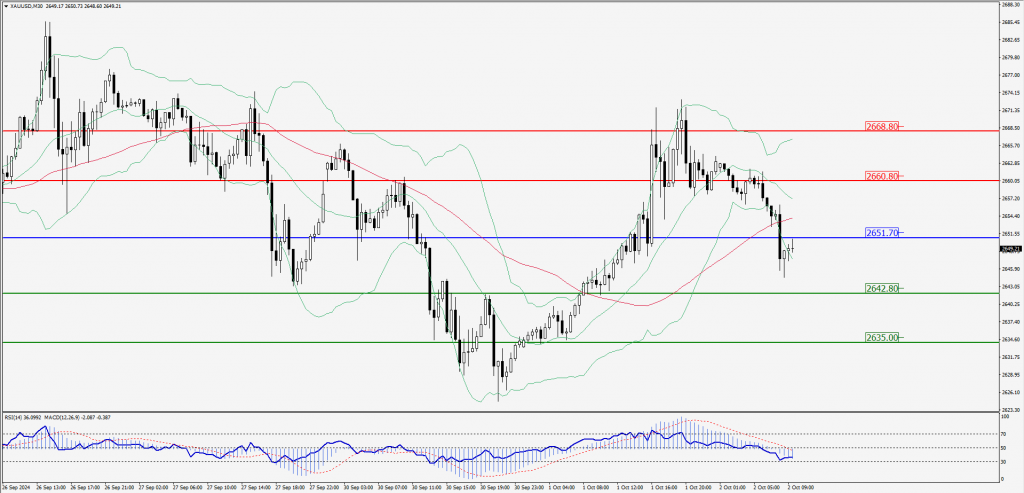
Green Lines Indicate Resistance Levels – Red Lines Indicate Support Levels
Light Blue is a Pivot Point – Black represents the price when the report was produced
Dow Jones Intraday: Trend on the downside
Our pivot point is 42,065.40
Preferable Price Action: Take sell positions below the pivot with targets at 41,987.00 & 41,916.50.
Alternative Price Action: Above 42,065.40 looks for further upside to 42,153.70 & 42,225.20.
Comment: RSI is below 50 levels and pairs below its 20MA & 55MA.
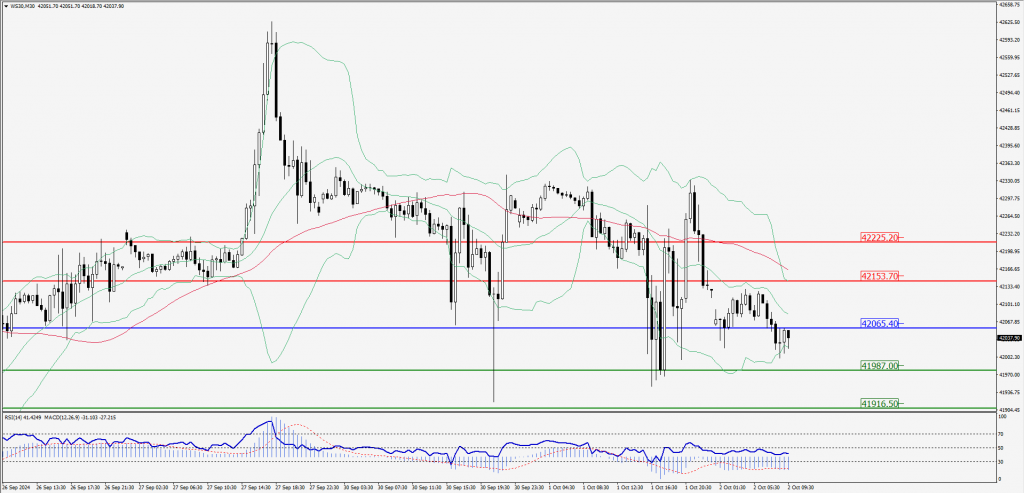
Green Lines Indicate Resistance Levels – Red Lines Indicate Support Levels
Light Blue is a Pivot Point – Black represents the price when the report was produced