Market Wrap: Stocks, Bonds, Commodities
The S&P 500 sputtered to a record high close on Monday, rebounding from a brief setback after Federal Reserve Chair Jerome Powell said the U.S. central bank is in no hurry to implement further interest rate cuts.
The Dow Jones Industrial Average rose 17.15 points to 42,330.15, the S&P 500 gain 0.42% to 5,762.48 and the Nasdaq Composite ascend 69.58 points to 18,189.17.
MSCI’s index of Asia-Pacific stocks outside Japan is down 0.07% to 761.74 levels. The Australian index was lower by 0.95% to 8,191.60. Japanese Nikkei Index increase 1.97% today.
European stocks were mixed on Tuesday, with the Stoxx Europe 50 Index increase 0.01% to 5,000.55 Germany’s DAX ascend 0.20% to 19,380.55, and France’s CAC lower 0.30% to 7,612.76 and U.K.’s FTSE 100 gain 0.21% to 8,254.10.
Benchmark 10-year U.S. Treasury fail as demand for safe assets slipped again, today 10-year bond yields 1.28% to 3.7610.
Oil prices were steady on Tuesday as the prospect of additional supply entering the market amid lacklustre global demand growth offset concerns that the escalating Middle East conflict could disrupt exports in the key producing region.
Spot Brent crude oil decrease 1.41% to $70.69 per barrel. US West Texas Intermediate crude is decrease 1.57% to $67.10 a barrel.
The yellow metal gold is up 0.25% to 2,666.05 dollars per ounce.
Market Wrap: Forex
The US dollar gained against major peers on Tuesday after Federal Reserve Chair Jerome Powell pushed back overnight against bets on more supersized interest rate cuts.
Today, the U.S. dollar index measures the Greenback against a trade-weighted basket of six major currencies, which increase 0.23% to 100.750.
The Euro US Dollar (EUR/USD) is a widely traded is down 0.27% today. This left the pair trading around $1.11030.
The Japanese yen was will move positive against the U.S. dollar on Tuesday. Today USD/JPY is trades pair that increase 0.14% to the 143.820 level.
Another commodity-related currency negative against the U.S dollar, AUD/USD loss 0.14% to 0.69030, and NZD/USD decrease 0.65% to 0.63070 level.
EUR/USD Intraday: Trend on the downside
Our pivot point is at 1.11390
Preferable Price Action: Take sell positions below pivot level with targets at 1.11250 & 1.11130 in extension.
Alternative Price Action: Buy pivot looks for a further upside to 1.11530 & 1.11660.
Comment: RSI is below 50 levels and pairs below its 55MA.
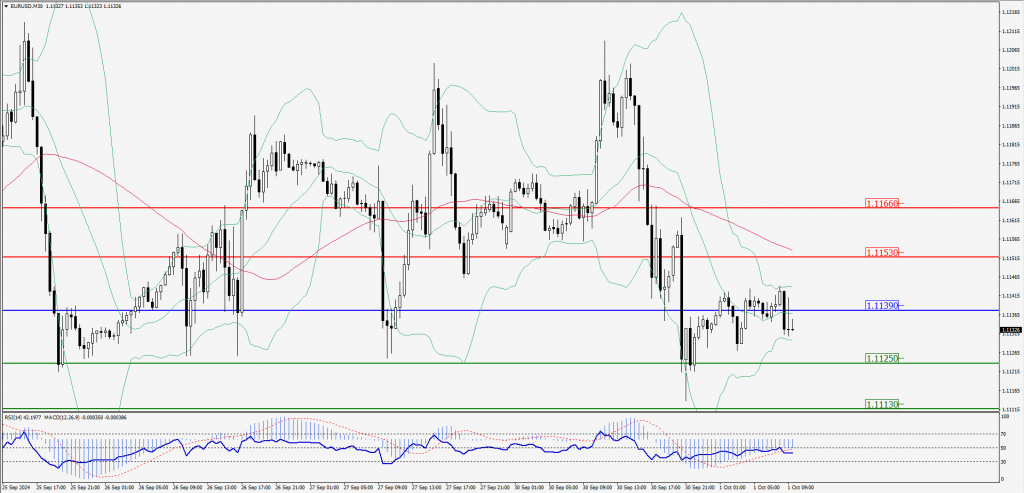
Green Lines Indicate Resistance Levels – Red Lines Indicate Support Levels
Light Blue is a Pivot Point – Black represents the price when the report was produced
GBP/USD Intraday: Trend on the upside
Our pivot point is at 1.33770
Preferable Price Action: Buy positions above pivot with targets at 1.33950 & 1.34100 in extension.
Alternative Price Action: The price below pivot would call for further downside to 1.33600 & 1.33450.
Comment: RSI is above 50 levels.
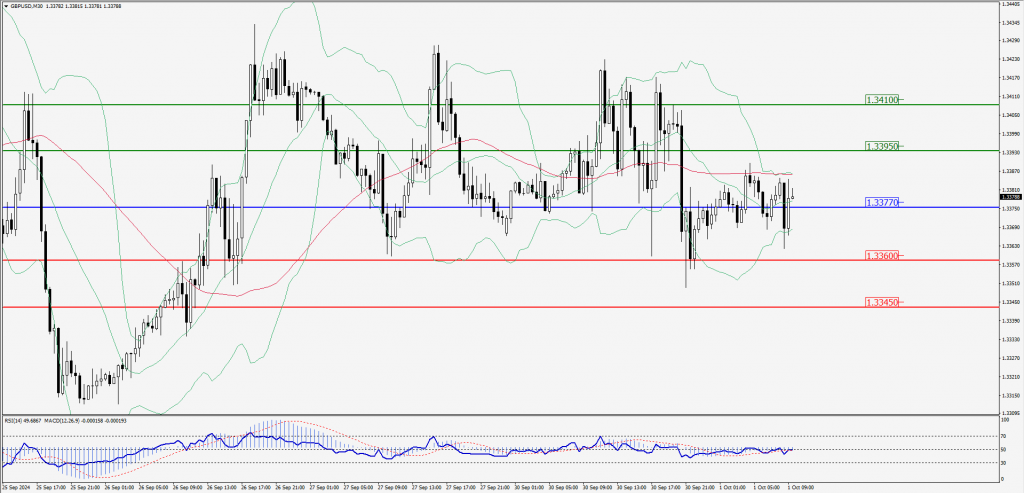
Green Lines Indicate Resistance Levels – Red Lines Indicate Support Levels
Light Blue is a Pivot Point – Black represents the price when the report was produced
USD/JPY Intraday: Major trend on the upside
Our pivot point is at 144.370
Preferable Price Action: Buy position above pivot with the target at 144.990 and 145.620 in extension.
Alternative Price Action: The downside breakout of the pivot would call for 143.780 and 143.190.
Comment: MACD is above 50 levels and pairs above its 20MA & 55MA.
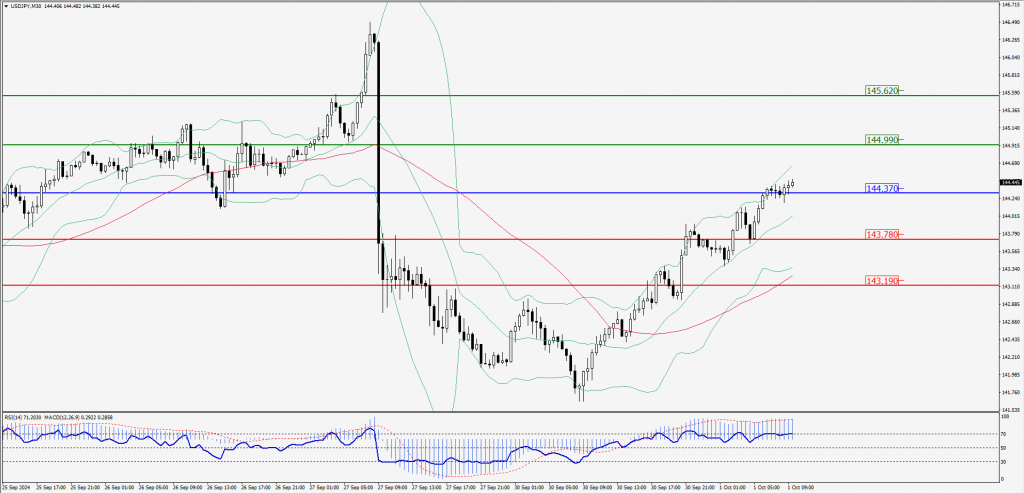
Green Lines Indicate Resistance Levels – Red Lines Indicate Support Levels
Light Blue is a Pivot Point – Black represents the price when the report was produced
AUD/USD Intraday: Trend on the upside
Our pivot point is at 0.69250
Preferable Price Action: Buy positions above pivot with targets at 0.69410 & 0.69530 in extension.
Alternative Price Action: Below pivot a further downside with 0.69100 & 0.69970 as targets.
Comment: RSI is above 50 levels and pairs above its 20MA & 55MA.
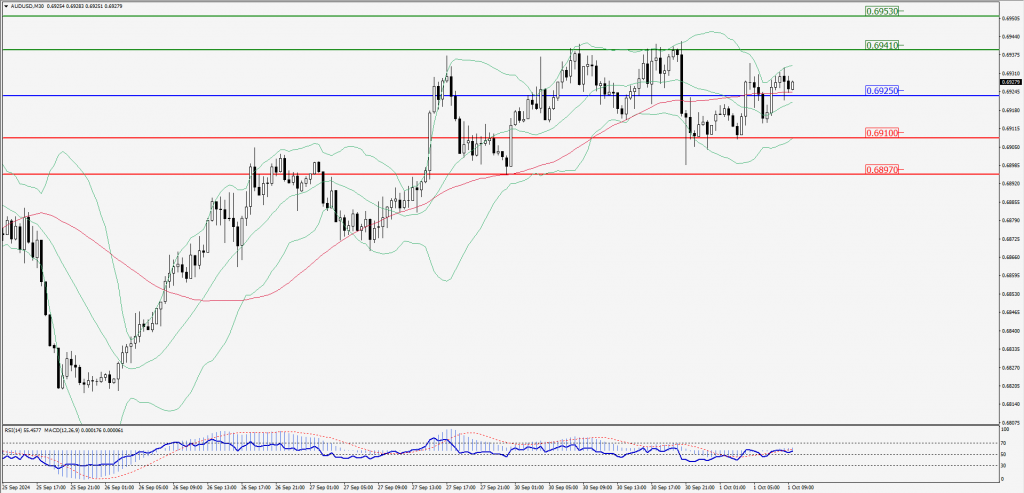
Green Lines Indicate Resistance Levels – Red Lines Indicate Support Levels
Light Blue is a Pivot Point – Black represents the price when the report was produced
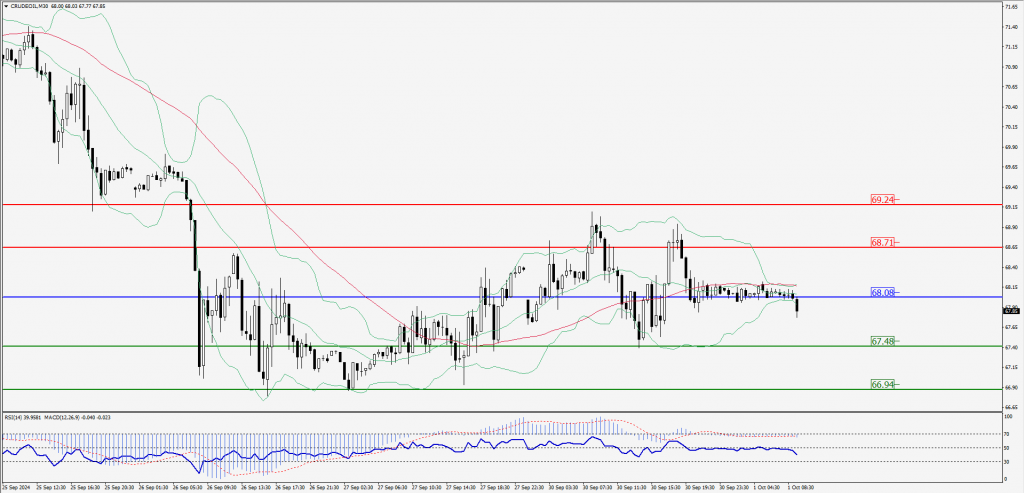
CRUDEOIL Intraday: Trend on the downside
Our pivot point is at 68.08
Preferable Price Action: Below pivot sell oil with 67.48 & 66.94 as targets.
Alternative Price Action: Buy crude above pivot with targets at 68.71 and 69.24 in extension.
Comment: RSI is at below 50 levels and pairs below its 55MA.
Green Lines Indicate Resistance Levels – Red Lines Indicate Support Levels
Light Blue is a Pivot Point – Black represents the price when the report was produced
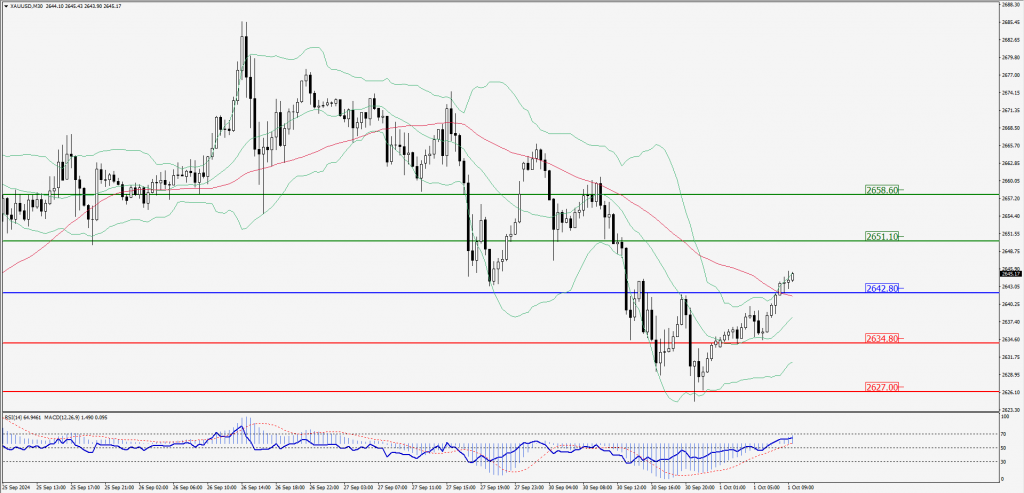
XAU/USD Intraday: Trend on the upside
Our pivot point is at 2642.80
Preferable Price Action: Further upside to 2651.10 and 2658.60.
Alternative Price Action: If the price gives an downside breakout of a pivot, then the price extends to 2634.80 and 2627.00.
Comment: MACD is above 50 levels and pairs above its 20MA & 55MA.
Green Lines Indicate Resistance Levels – Red Lines Indicate Support Levels
Light Blue is a Pivot Point – Black represents the price when the report was produced
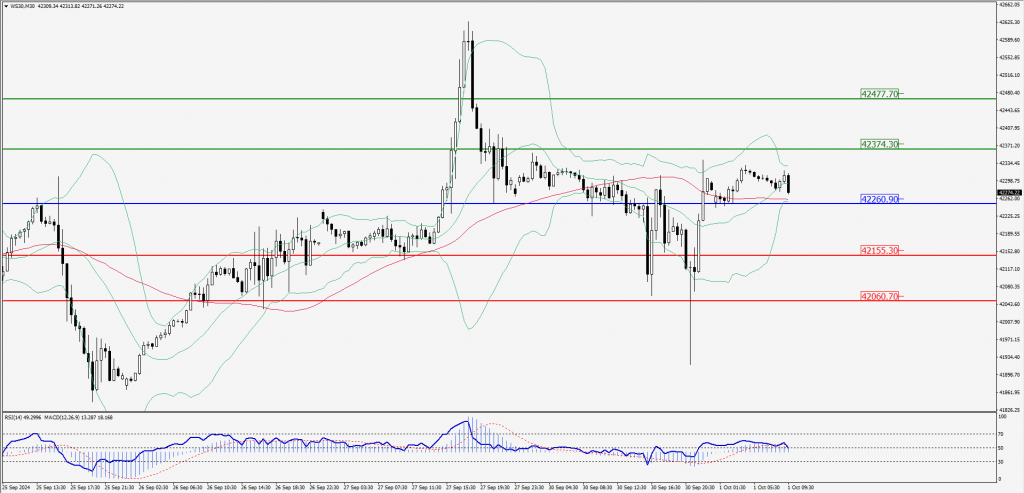
Dow Jones Intraday: Trend on the upside
Our pivot point is 42,260.90
Preferable Price Action: Take buy positions above the pivot with targets at 42,374.30 & 42,477.70.
Alternative Price Action: Below 42,260.90 looks for further downside to 42,155.30 & 42,060.70.
Comment: RSI is above 50 levels and pairs above its 55MA.
Green Lines Indicate Resistance Levels – Red Lines Indicate Support Levels
Light Blue is a Pivot Point – Black represents the price when the report was produced