Market Wrap: Stocks, Bonds, Commodities
A surging yen steadied on Monday as Japan’s incoming prime minister signalled monetary policy should remain accommodative, while commodity currencies were lifted to the year’s highs by investor hopes of a turnaround in China’s economy.
The Dow Jones Industrial Average rose 137.89 points to 42,313.00, the S&P 500 loss 0.13% to 5,738.17 and the Nasdaq Composite descend 70.70 points to 18,119.59.
MSCI’s index of Asia-Pacific stocks outside Japan is up 1.73% to 765.06 levels. The Australian index was higher by 0.70% to 8,269.80. Japanese Nikkei Index decrease 4.82% today.
European stocks were negative on Monday, with the Stoxx Europe 50 Index decrease 0.32% to 5,051.05 Germany’s DAX descend 0.26% to 19,430.25, and France’s CAC lower 0.64% to 7,741.69 and U.K.’s FTSE 100 loss 0.04% to 8,317.75.
Benchmark 10-year U.S. Treasury rose as demand for safe assets slipped again, today 10-year bond yields 0.51% to 3.7710.
Oil prices edged higher on Monday on increasing concerns of potential supply disruptions from the Middle East producing region after Israel stepped up attacks on Iranian-backed forces.
Spot Brent crude oil increase 0.03% to $72.28 per barrel. US West Texas Intermediate crude is increase 0.91% to $68.80 a barrel.
The yellow metal gold is up 0.88% to 2,680.35 dollars per ounce.
Market Wrap: Forex
Treasury yields and the dollar fell while the Dow registered a record closing high on Friday as a subdued U.S. inflation report lifted expectations of an outsized interest rate cut at the Federal Reserve’s November policy meeting.
Today, the U.S. dollar index measures the Greenback against a trade-weighted basket of six major currencies, which increase 0.03% to 100.137.
The Euro US Dollar (EUR/USD) is a widely traded is down 0.01% today. This left the pair trading around $1.11620.
The Japanese yen was will move negative against the U.S. dollar on Monday. Today USD/JPY is trades pair that decrease 0.14% to the 141.990 level.
Another commodity-related currency positive against the U.S dollar, AUD/USD gain 0.44% to 0.69330, and NZD/USD increase 0.36% to 0.63630 level.
EUR/USD Intraday: Trend on the upside
Our pivot point is at 1.11620
Preferable Price Action: Take buy positions above pivot level with targets at 1.11750 & 1.11880 in extension.
Alternative Price Action: Sell pivot looks for a further downside to 1.11500 & 1.11390.
Comment: RSI is above 50 levels.
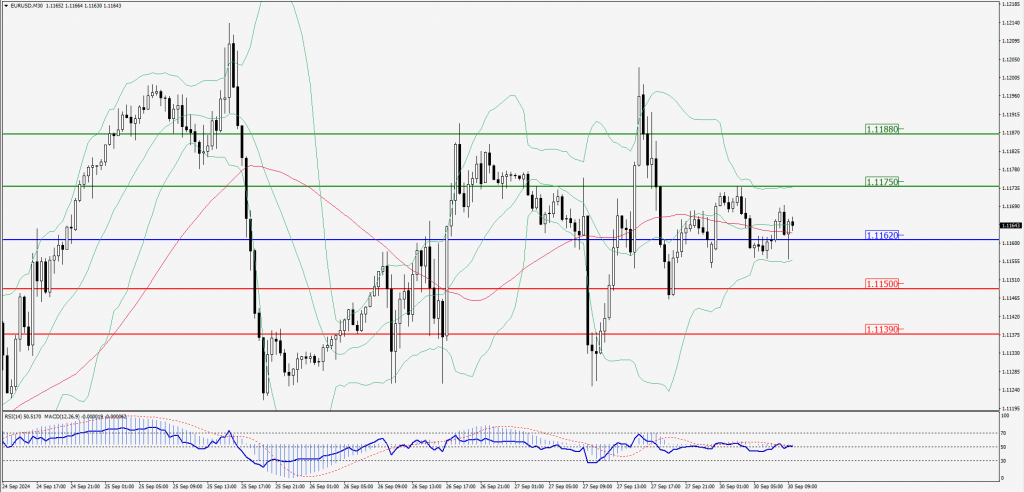
Green Lines Indicate Resistance Levels – Red Lines Indicate Support Levels
Light Blue is a Pivot Point – Black represents the price when the report was produced
GBP/USD Intraday: Trend on the upside
Our pivot point is at 1.33840
Preferable Price Action: Buy positions above pivot with targets at 1.34020 & 1.34170 in extension.
Alternative Price Action: The price below pivot would call for further downside to 1.33670 & 1.33500.
Comment: RSI is above 50 levels.
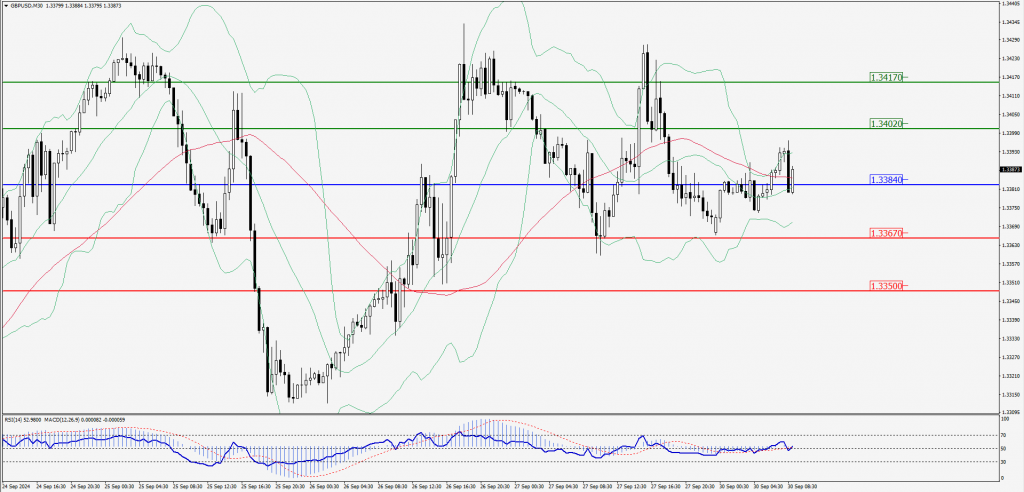
Green Lines Indicate Resistance Levels – Red Lines Indicate Support Levels
Light Blue is a Pivot Point – Black represents the price when the report was produced
USD/JPY Intraday: Trend on the downside
Our pivot point is at 142.200
Preferable Price Action: Sell position below pivot with the target at 141.470 and 140.760 in extension.
Alternative Price Action: The upside breakout of the pivot would call for 142.960 and 143.700.
Comment: MACD is below 50 levels and pairs below its 20MA & 55MA.
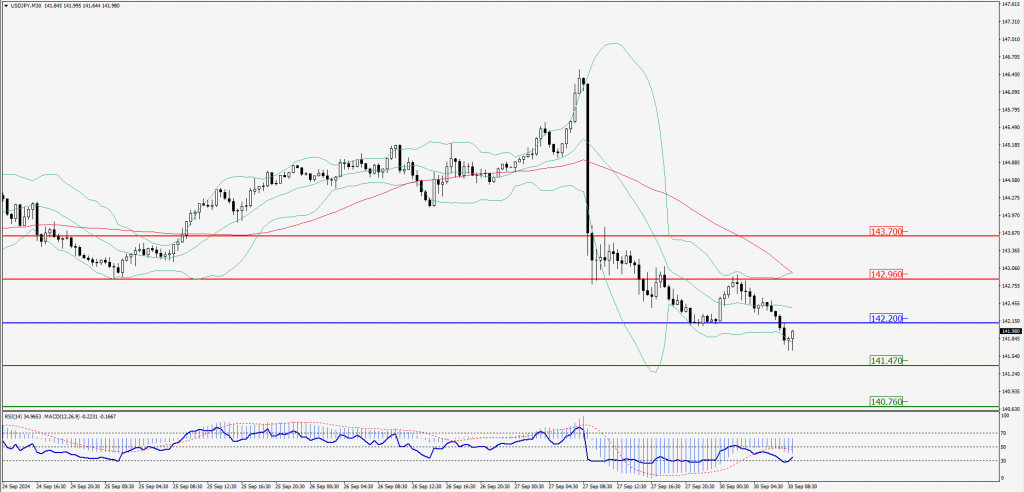
Green Lines Indicate Resistance Levels – Red Lines Indicate Support Levels
Light Blue is a Pivot Point – Black represents the price when the report was produced
AUD/USD Intraday: Trend on the upside
Our pivot point is at 0.69280
Preferable Price Action: Buy positions above pivot with targets at 0.69410 & 0.69530 in extension.
Alternative Price Action: Below pivot a further downside with 0.69150 & 0.69030 as targets.
Comment: RSI is above 50 levels and pairs above its 20MA & 55MA.
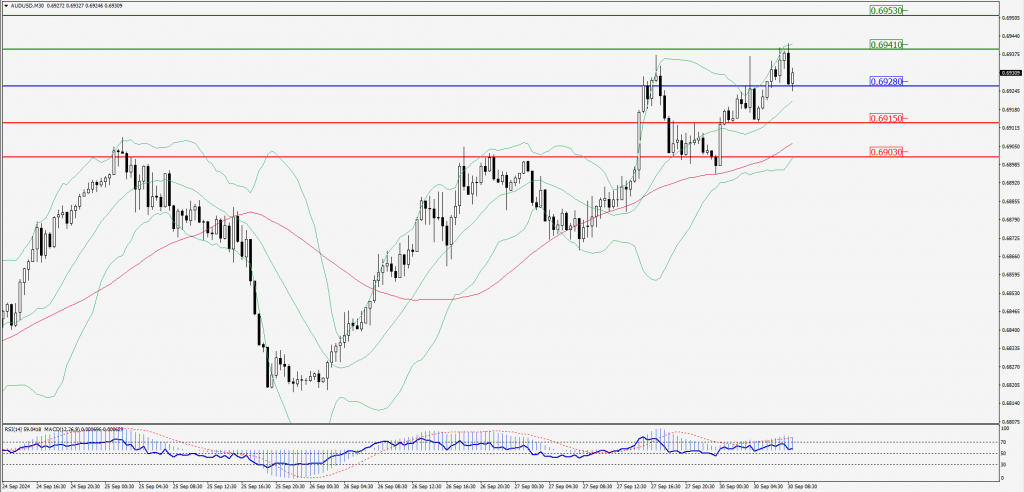
Green Lines Indicate Resistance Levels – Red Lines Indicate Support Levels
Light Blue is a Pivot Point – Black represents the price when the report was produced
CRUDEOIL Intraday: Trend on the upside
Our pivot point is at 68.67
Preferable Price Action: Above pivot buy oil with 69.44 & 70.14 as targets.
Alternative Price Action: Sell crude below pivot with targets at 67.86 and 67.09 in extension.
Comment: RSI is at above 50 levels and pairs above its 20MA & 55MA.
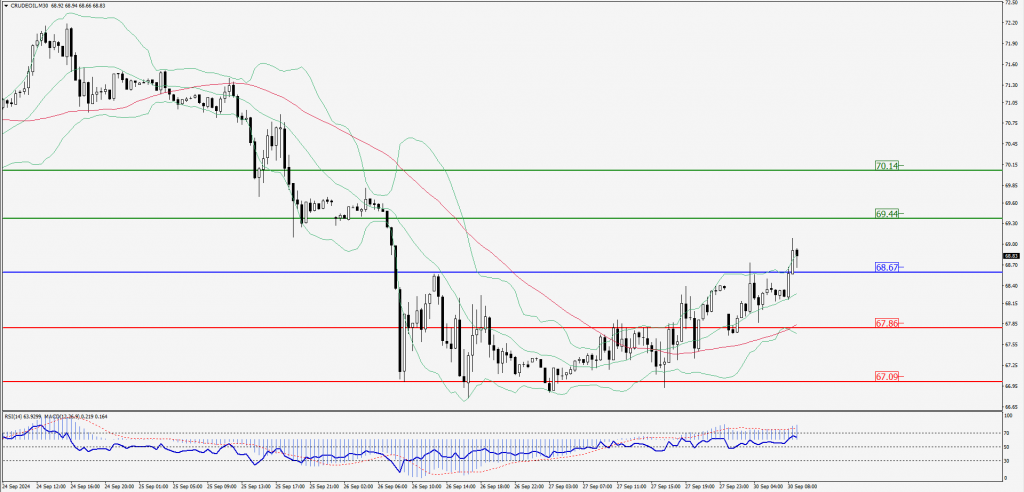
Green Lines Indicate Resistance Levels – Red Lines Indicate Support Levels
Light Blue is a Pivot Point – Black represents the price when the report was produced
XAU/USD Intraday: Trend on the upside
Our pivot point is at 2656.00
Preferable Price Action: Further upside to 2664.60 and 2673.00.
Alternative Price Action: If the price gives an downside breakout of a pivot, then the price extends to 2648.20 and 2640.30.
Comment: MACD is above 50 levels.
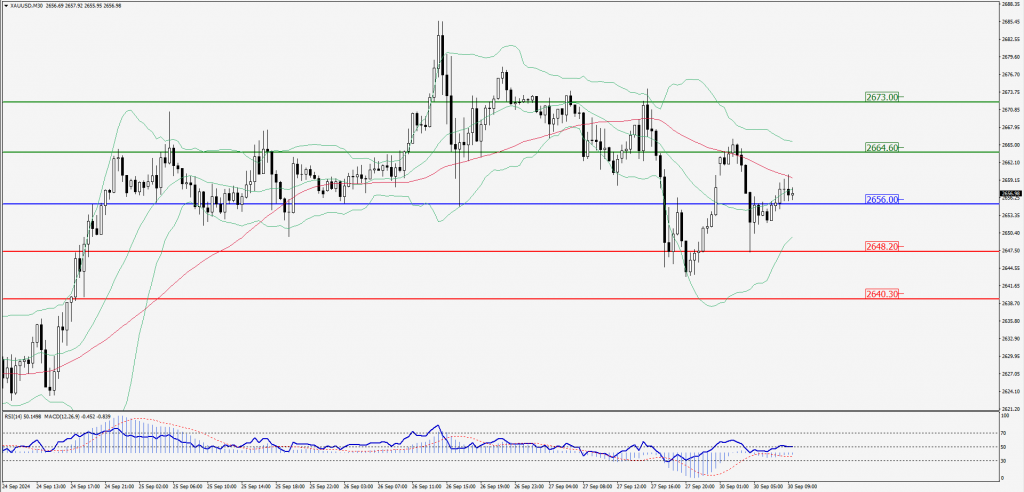
Green Lines Indicate Resistance Levels – Red Lines Indicate Support Levels
Light Blue is a Pivot Point – Black represents the price when the report was produced
Dow Jones Intraday: Trend on the downside
Our pivot point is 42,309.30
Preferable Price Action: Take sell positions below the pivot with targets at 42,191.60 & 42,088.20.
Alternative Price Action: Above 42,309.30 looks for further upside to 42,433.70 & 42,533.80.
Comment: RSI is below 50 levels and pairs below its 55MA & 20MA.
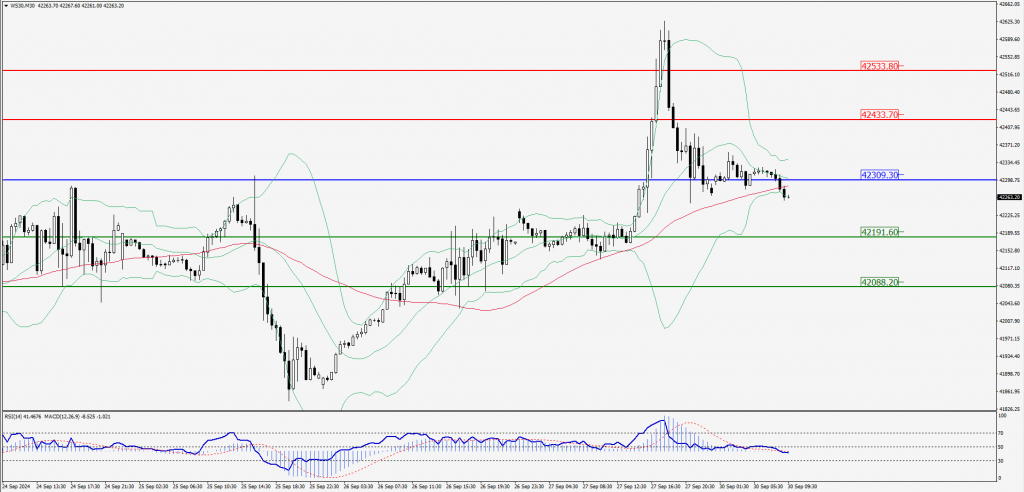
Green Lines Indicate Resistance Levels – Red Lines Indicate Support Levels
Light Blue is a Pivot Point – Black represents the price when the report was produced