Market Wrap: Stocks, Bonds, Commodities
The dollar rebounded from a 13-month low against the euro on Friday before Federal Reserve Chair Jerome Powell is due to speak on Friday and as the greenback’s recent weakness was seen as being overdone.
The Dow Jones Industrial Average fell 177.71 points to 40,712.78, the S&P 500 loss 0.89% to 5,570.64 and the Nasdaq Composite ascend 299.64 points to 17,619.35.
MSCI’s index of Asia-Pacific stocks outside Japan is down 0.10% to 703.15 levels. The Australian index was lower by 0.04% to 8,023.90. Japanese Nikkei Index increase 0.55% today.
European stocks were mixed on Friday, with the Stoxx Europe 50 Index increase 0.54% to 4,896.65, Germany’s DAX ascend 0.34% to 18,558.15, and France’s CAC higher 0.35% to 7,550.18and U.K.’s FTSE 100 gain 0.20% to 8,304.49.
Benchmark 10-year U.S. Treasury fell as demand for safe assets slipped again, today 10-year bond yields 0.13% to 3.8570.
Oil prices were little changed on Friday but on track to end the week lower, as weaker U.S. employment data raised concerns over demand, and renewed ceasefire talks in Gaza eased worries about supply disruptions.
Spot Brent crude oil increase 0.69% to $77.75 per barrel. US West Texas Intermediate crude is decrease 0.70% to $73.52 a barrel.
The yellow metal gold is up 0.61% to 2,532.10 dollars per ounce.
Market Wrap: Forex
The dollar fell to a more than one-year low against the euro and sterling on Friday after data showed employers added 818,000 fewer jobs in the year to March than previously thought.
Today, the U.S. dollar index measures the Greenback against a trade-weighted basket of six major currencies, which decrease 0.13% to 101.380.
The Euro US Dollar (EUR/USD) is a widely traded pair that is increase 0.09% today. This left the pair trading around $1.11220.
The Japanese yen was will move positive against the U.S. dollar on Tuesday. Today USD/JPY is trades pair that decrease 0.31% to the 145.800level.
Another commodity-related currency positive against the U.S dollar, AUD/USD gain 0.26% to 0.67220, and NZD/USD increase 0.25% to 0.6150 level.
EUR/USD Intraday: Trend on the upside
Our pivot point is at 1.11210
Preferable Price Action: Take buy positions above pivot level with targets at 1.11420 & 1.11570 in extension.
Alternative Price Action: Sell pivot looks for a further downside to 1.10990 & 1.10840.
Comment: RSI is above 50 levels and Pairs above its 20MA.
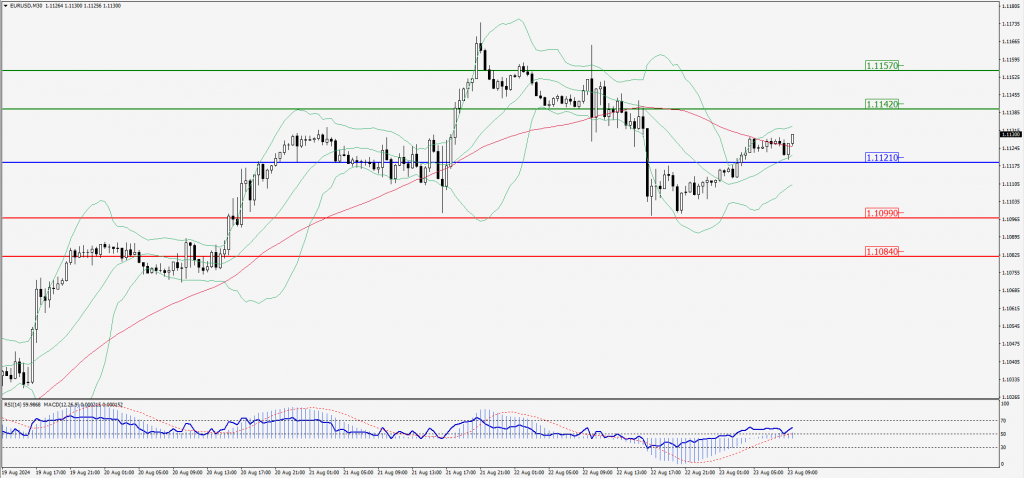
Green Lines Indicate Resistance Levels – Red Lines Indicate Support Levels
Light Blue is a Pivot Point – Black represents the price when the report was produced
GBP/USD Intraday: Trend on the upside
Our pivot point is at 1.31110
Preferable Price Action: Buy positions above pivot with targets at 1.31440 & 1.31680 in extension.
Alternative Price Action: The price below pivot would call for further downside to 1.30810 & 1.30530.
Comment: RSI is above 50 levels and Pairs above its 20MA & 55MA.
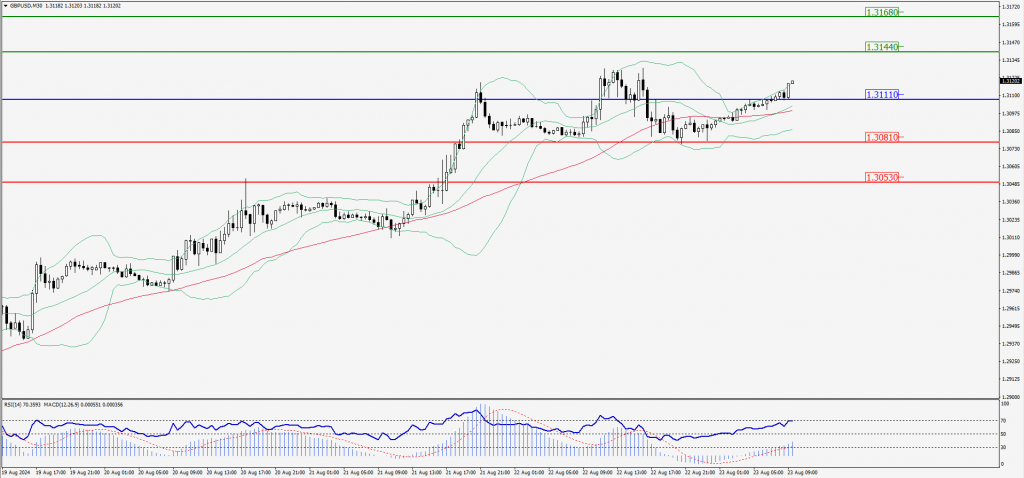
Green Lines Indicate Resistance Levels – Red Lines Indicate Support Levels
Light Blue is a Pivot Point – Black represents the price when the report was produced
USD/JPY Intraday: Incansolidation at 145.670
Our pivot point is at 145.670
Preferable Price Action: Buy position above pivot with the target at 145.230 and 144.870 in extension.
Alternative Price Action: The upside breakout of the pivot would call for 146.090 and 146.420.
Comment: MACD is 50 levels and Pairs above its 20MA & 55MA.
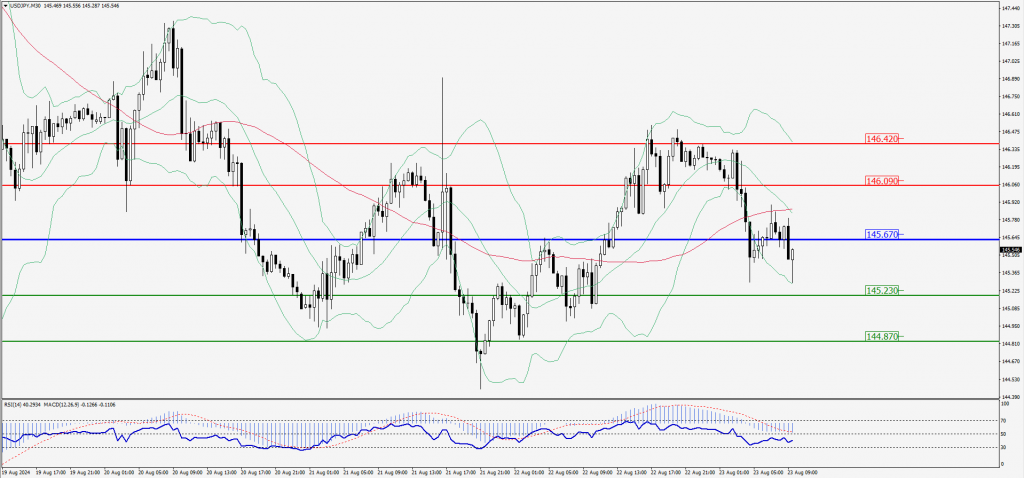
Green Lines Indicate Resistance Levels – Red Lines Indicate Support Levels
Light Blue is a Pivot Point – Black represents the price when the report was produced
AUD/USD Intraday: Trend on the upside
Our pivot point is at 0.67230
Preferable Price Action: Buy positions above pivot with targets at 0.67330 & 0.67410 in extension.
Alternative Price Action: Below pivot a further downside with 0.67130 & 0.67050 as targets.
Comment: RSI is above 50 levels and pairs above its 20MA.
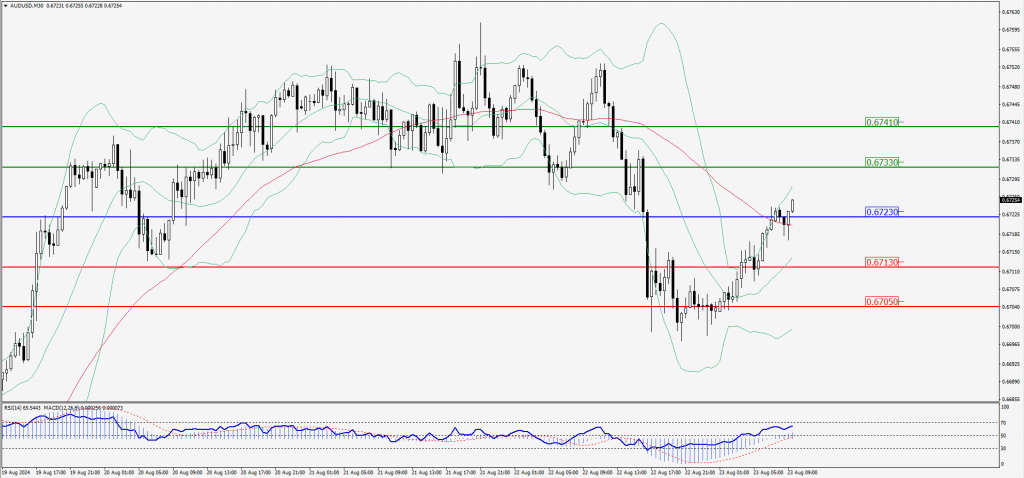
Green Lines Indicate Resistance Levels – Red Lines Indicate Support Levels
Light Blue is a Pivot Point – Black represents the price when the report was produced
CRUDEOIL Intraday: Trend on the upside
Our pivot point is at 72.98
Preferable Price Action: Above pivot buy oil with 73.67 & 74.22 as targets.
Alternative Price Action: Sell crude below pivot with targets at 72.33 and 71.75 in extension.
Comment: RSI is at above 50 levels and pairs above its 20MA & 55MA.
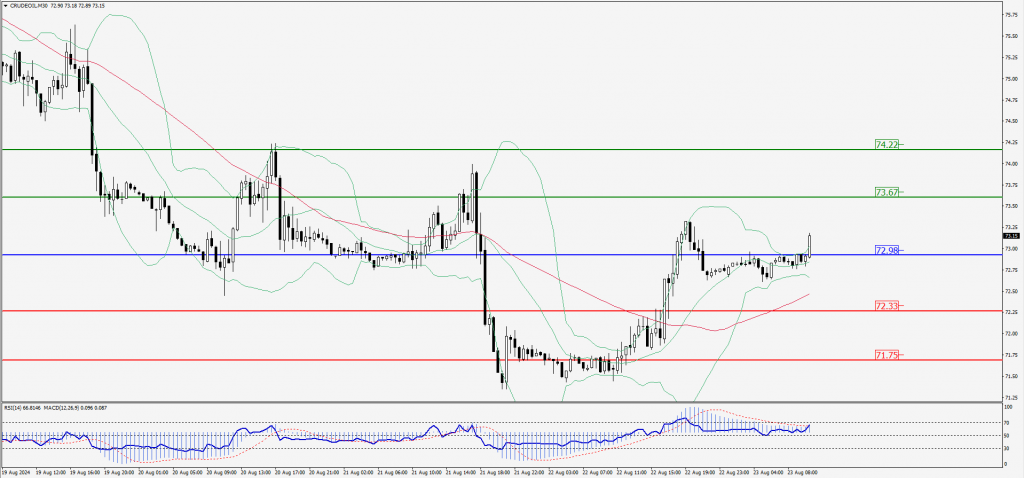
Green Lines Indicate Resistance Levels – Red Lines Indicate Support Levels
Light Blue is a Pivot Point – Black represents the price when the report was produced
XAU/USD Intraday: Trend on the downside
Our pivot point is at 2490.70
Preferable Price Action: Further upside to 2500.20 and 2507.70.
Alternative Price Action: If the price gives an downside breakout of a pivot, then the price extends to 2481.30 and 2473.40.
Comment: MACD is above 50 levels and pairs above its 20MA.
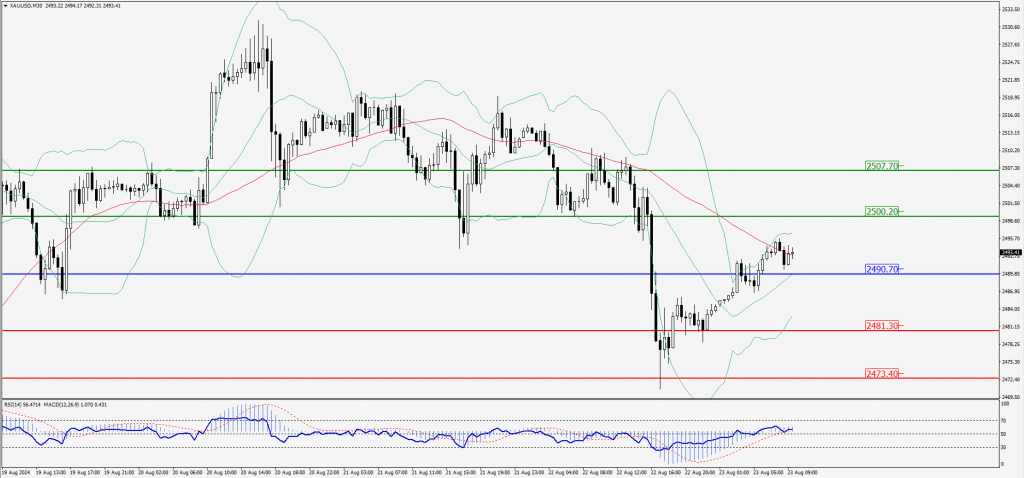
Green Lines Indicate Resistance Levels – Red Lines Indicate Support Levels
Light Blue is a Pivot Point – Black represents the price when the report was produced
Dow Jones Intraday: Trend on the upside
Our pivot point is 40816.60
Preferable Price Action: Take buy positions above the pivot with targets at 40883.60 & 40935.10.
Alternative Price Action: Below 40816.60 looks for further downside to 40749.50 & 40694.80.
Comment: RSI is above 50 levels and pairs above its 20MA.
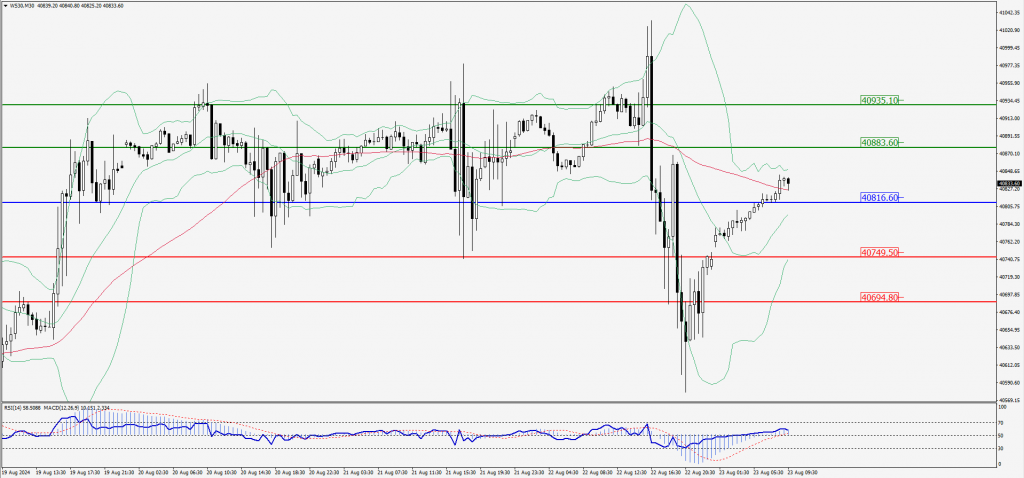
Green Lines Indicate Resistance Levels – Red Lines Indicate Support Levels
Light Blue is a Pivot Point – Black represents the price when the report was produced