Market Wrap: Stocks, Bonds, Commodities
The dollar and yen kept within close ranges on Tuesday as traders awaited key central bank decisions, kicking off with midweek monetary policy meetings from the Bank of Japan and Federal Reserve that could set the tone for coming weeks.
The Dow Jones Industrial Average fell 49.41 points to 40,539.93, the S&P 500 gain 0.08% to 5,463.54 and the Nasdaq Composite ascend 12.32 points to 17,370.20.
MSCI’s index of Asia-Pacific stocks outside Japan is down 0.50% to 685.23 levels. The Australian index was lower by 0.46% to 7,953.20. Japanese Nikkei Index decrease 0.01% today.
European stocks were mixed on Tuesday, with the Stoxx Europe 50 Index increase 0.60% to 4,844.30, Germany’s DAX ascend 0.34% to 18,388.45, and France’s CAC higher 0.45% to 7,477.10 and U.K.’s FTSE 100 loss 0.46% to 8,253.97.
Benchmark 10-year U.S. Treasury rose as demand for safe assets slipped again, today 10-year bond yields increase 0.02% to 4.1780.
Oil prices fell on Tuesday, extending losses from the previous session amid concerns about demand in China, the world’s largest crude importer, while the market shrugged off the risk of conflict escalating in the Middle East.
Spot Brent crude oil decrease 0.28% to $78.83 per barrel. US West Texas Intermediate crude is decrease 0.26% to $75.61 a barrel.
The yellow metal gold is up 0.39% to 2,435.05 dollars per ounce.
Market Wrap: Forex
Most Asian currencies kept to a tight range on Tuesday amid caution before a string of economic signals this week, with the yen steadying amid uncertainty over a potential interest rate hike by the Bank of Japan.
Today, the U.S. dollar index measures the Greenback against a trade-weighted basket of six major currencies, which increase 0.07% to 104.3820.
The Euro US Dollar (EUR/USD) is a widely traded pair that is increase 0.05% today. This left the pair trading around $1.08250.
The Japanese yen was will move positive against the U.S. dollar on Tuesday. Today USD/JPY is trades pair that increase 0.54% to the 154.840 level.
Another commodity-related currency positive against the U.S dollar, AUD/USD rose 0.09% to 0.65540, and NZD/USD increase 0.36% to 0.58950 level.
EUR/USD Intraday: Trend on the upside
Our pivot point is at 1.08210
Preferable Price Action: Take buy positions above pivot level with targets at 1.08300 & 1.08380 in extension.
Alternative Price Action: Sell pivot looks for a further downside to 1.08120 & 1.08040.
Comment: RSI is above 50 levels and Pairs above its 55MA.
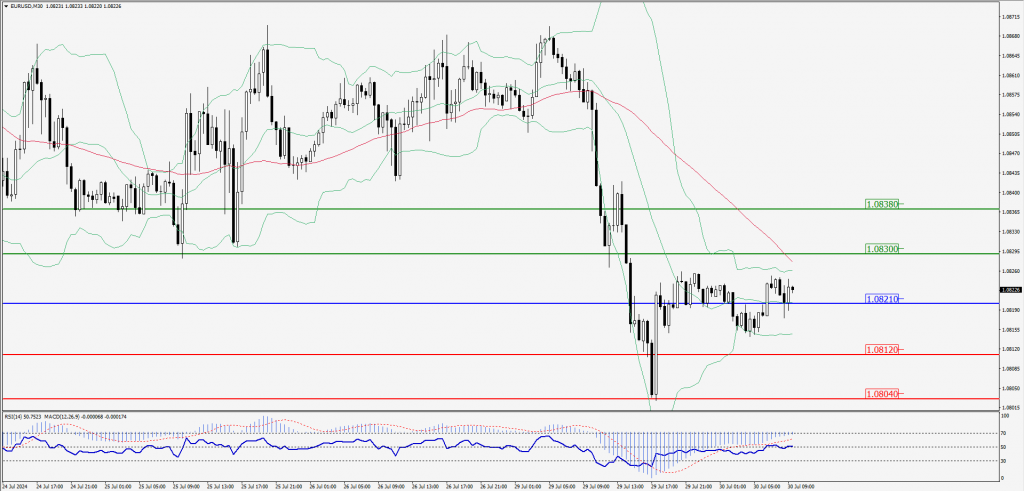
Green Lines Indicate Resistance Levels – Red Lines Indicate Support Levels
Light Blue is a Pivot Point – Black represents the price when the report was produced
GBP/USD Intraday: Trend on the downside
Our pivot point is at 1.28600
Preferable Price Action: Sell positions below pivot with targets at 1.28420 & 1.28260 in extension.
Alternative Price Action: The price above pivot would call for further upside to 1.28790 & 1.28940.
Comment: RSI is below 50 levels and Pairs above its 20MA.
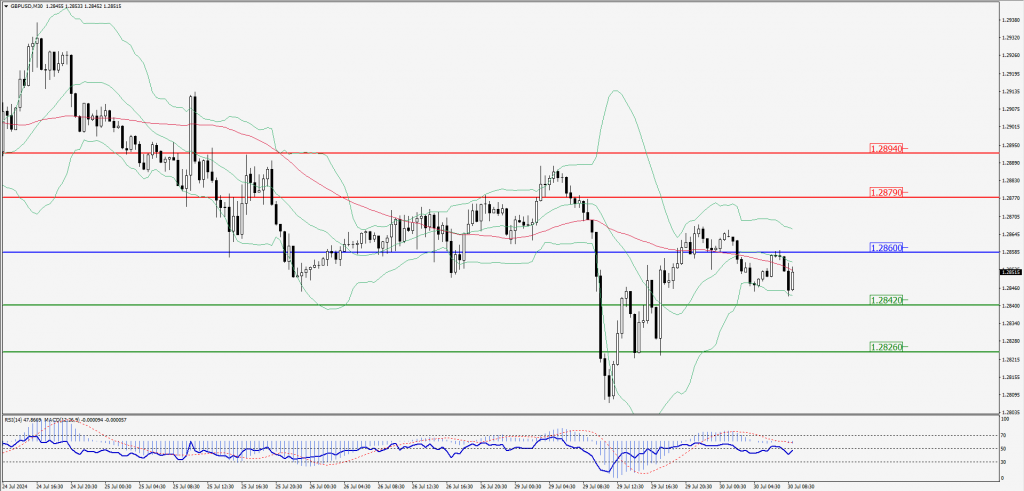
Green Lines Indicate Resistance Levels – Red Lines Indicate Support Levels
Light Blue is a Pivot Point – Black represents the price when the report was produced
USD/JPY Intraday: Major trend on the upside
Our pivot point is at 154.980
Preferable Price Action: Buy position above pivot with the target at 155.560 and 156.070 in extension.
Alternative Price Action: The downside breakout of the pivot would call for 154.420 and 153.880.
Comment: MACD is above 50 levels and Pairs above its 55MA & 20MA.
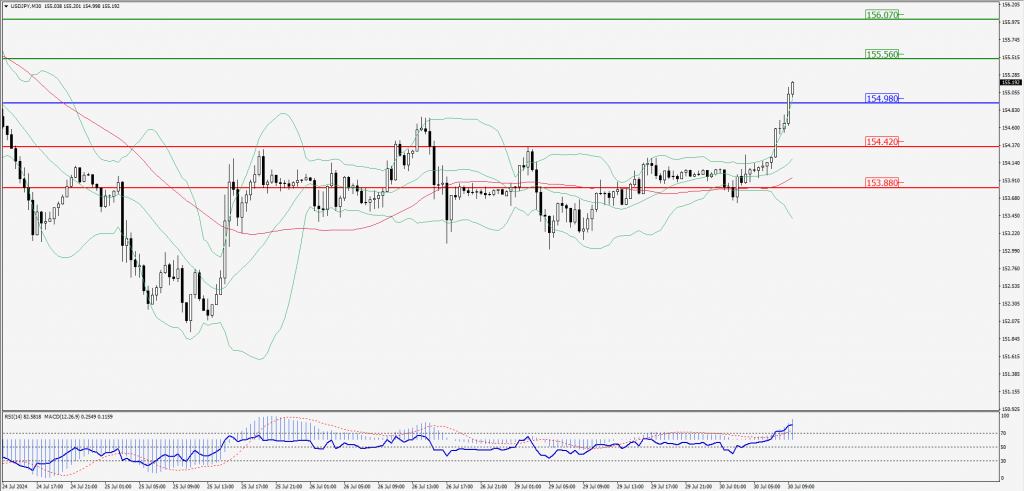
Green Lines Indicate Resistance Levels – Red Lines Indicate Support Levels
Light Blue is a Pivot Point – Black represents the price when the report was produced
AUD/USD Intraday: Support level at 0.65520
Our pivot point is at 0.65520
Preferable Price Action: Buy positions above pivot with targets at 0.65660 & 0.65790 in extension.
Alternative Price Action: Below pivot a further downside with 0.65380 & 0.65250 as targets.
Comment: RSI is above 50 levels and Pairs above its 55MA & 20MA.
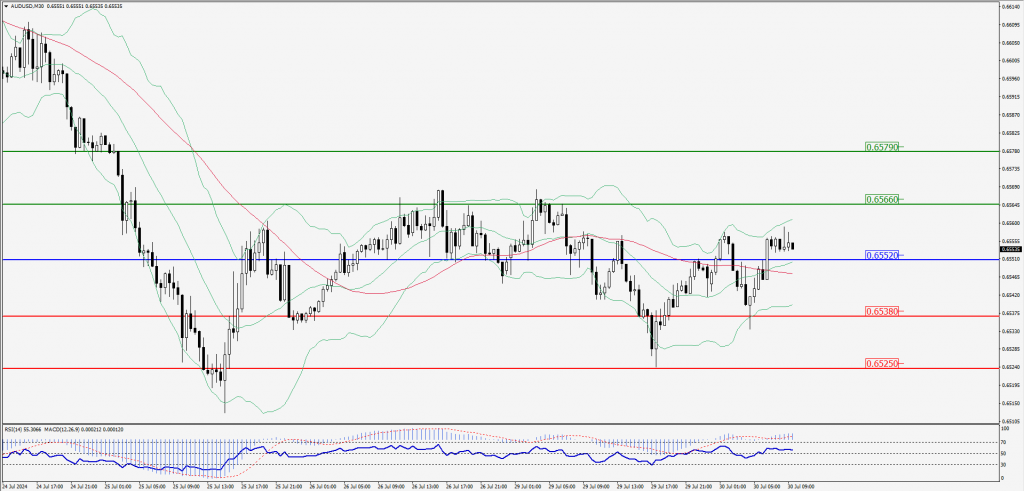
Green Lines Indicate Resistance Levels – Red Lines Indicate Support Levels
Light Blue is a Pivot Point – Black represents the price when the report was produced
CRUDEOIL Intraday: Trend on the downside
Our pivot point is at 75.18
Preferable Price Action: Below pivot sell oil with 74.53 & 73.94 as targets.
Alternative Price Action: Buy crude above pivot with targets at 75.89 and 76.52 in extension.
Comment: RSI is below 50 levels and pairs below its 20MA & 55MA.
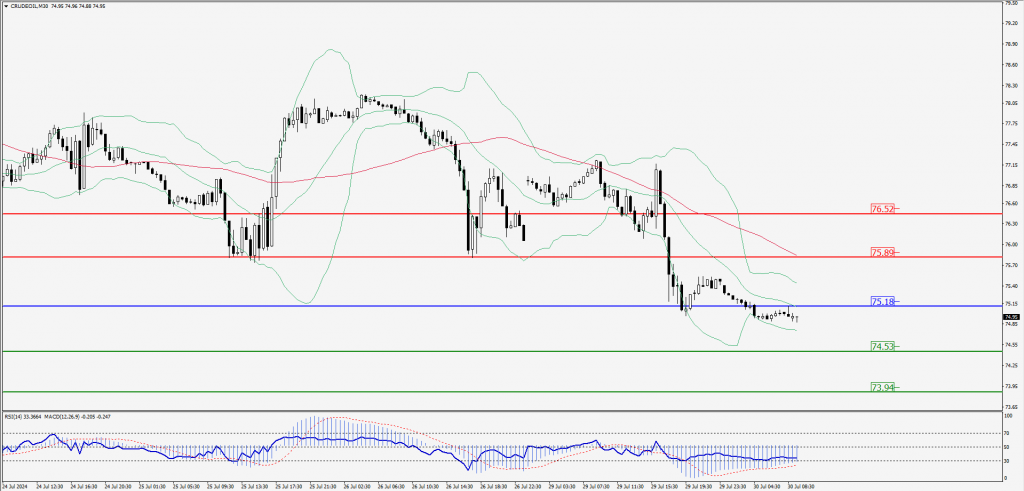
Green Lines Indicate Resistance Levels – Red Lines Indicate Support Levels
Light Blue is a Pivot Point – Black represents the price when the report was produced
XAU/USD Intraday: Trend on the upside
Our pivot point is at 2386.00
Preferable Price Action: Further upside to 2398.50 and 2409.40.
Alternative Price Action: If the price gives an downside breakout of a pivot, then the price extends to 2374.00 and 2362.60.
Comment: MACD is above 50 levels and pairs above its 55MA & 20MA.
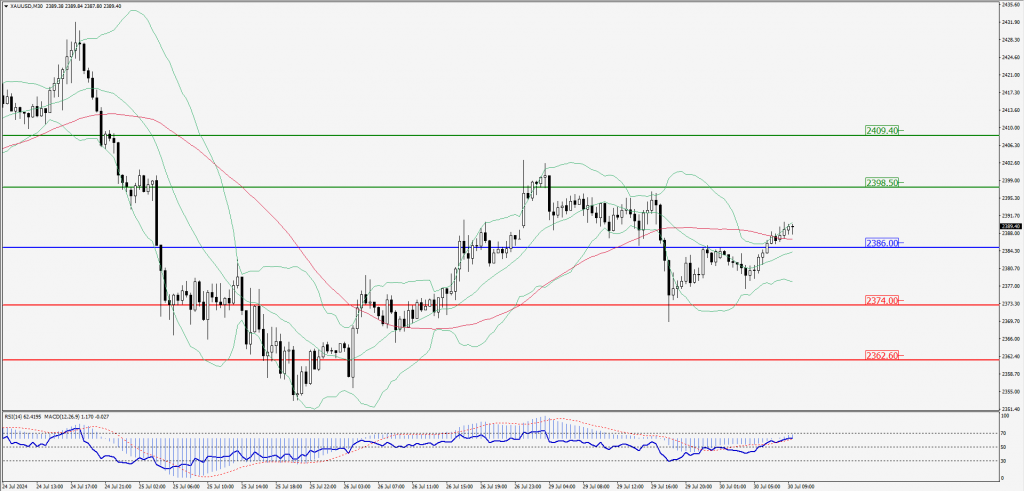
Green Lines Indicate Resistance Levels – Red Lines Indicate Support Levels
Light Blue is a Pivot Point – Black represents the price when the report was produced
Dow Jones Intraday: Trend on the upside
Our pivot point is 40,508.40
Preferable Price Action: Take buy positions above the pivot with targets at 40,672.50 & 40,828.20.
Alternative Price Action: Below 40,508.40 looks for further downside to 40,339.90 & 40,174.30.
Comment: RSI is above 50 levels and pairs above its 20MA.
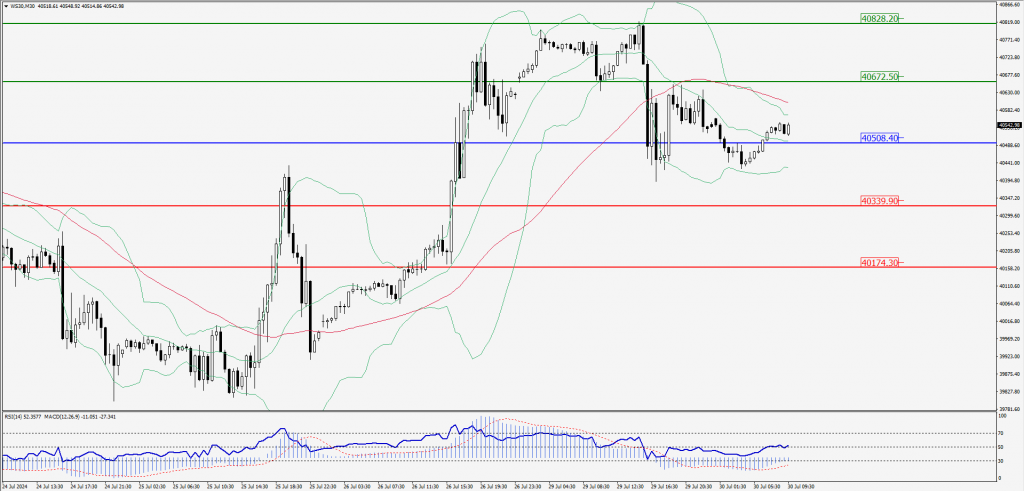
Green Lines Indicate Resistance Levels – Red Lines Indicate Support Levels
Light Blue is a Pivot Point – Black represents the price when the report was produced