Market Wrap: Stocks, Bonds, Commodities
Most Asian currencies firmed on Monday, while the dollar retreated before a Federal Reserve meeting this week that is likely to yield more cues on the bank’s plans to cut interest rates.
The Dow Jones Industrial Average rose 654.27 points to 40,589.34, the S&P 500 gain 1.11% to 5,459.10 and the Nasdaq Composite ascend 176.16 points to 17,357.88.
MSCI’s index of Asia-Pacific stocks outside Japan is up 0.78% to 689.60 levels. The Australian index was higher by 0.86% to 7,989.60. Japanese Nikkei Index increase 2.29% today.
European stocks were mixed on Monday, with the Stoxx Europe 50 Index increase 0.13% to 4,868.60, Germany’s DAX ascend 0.34% to 18,485.45, and France’s CAC lower 0.14% to 7,507.21 and U.K.’s FTSE 100 gain 0.59% to 8,335.00.
Benchmark 10-year U.S. Treasury rose as demand for safe assets slipped again, today 10-year bond yields decrease 0.72% to 4.1710.
Oil prices rose on Monday, paring last week’s loss, on fears of a widening conflict in the Middle East following a rocket strike in the Israeli-occupied Golan Heights, which Israel and the United States blamed on Lebanese armed group Hezbollah.
Spot Brent crude oil increase 0.02% to $80.30 per barrel. US West Texas Intermediate crude is decrease 0.02% to $77.16 a barrel.
The yellow metal gold is up 0.38% to 2,437.15 dollars per ounce.
Market Wrap: Forex
The yen edged higher on Monday, reversing early declines, with sentiment still fragile following the Japanese currency’s best weekly rally since late April after a U.S. tech-led stock rout ignited demand for safe haven assets.
Today, the U.S. dollar index measures the Greenback against a trade-weighted basket of six major currencies, which increase 0.05% to 104.1120.
The Euro US Dollar (EUR/USD) is a widely traded pair that is decrease 0.06% today. This left the pair trading around $1.08510.
The Japanese yen was will move negative against the U.S. dollar on Monday. Today USD/JPY is trades pair that decrease 0.10% to the 153.560 level.
Another commodity-related currency negative against the U.S dollar, AUD/USD fail 0.02% to 0.65470, and NZD/USD decrease 0.19% to 0.58840 level.
EUR/USD Intraday: Resistance level at 1.08580
Our pivot point is at 1.08580
Preferable Price Action: Take sell positions below pivot level with targets at 1.08510 & 1.08440 in extension.
Alternative Price Action: Buy pivot looks for a further upside to 1.08650 & 1.08710.
Comment: RSI is below 50 levels and Pairs below its 55MA & 20MA.
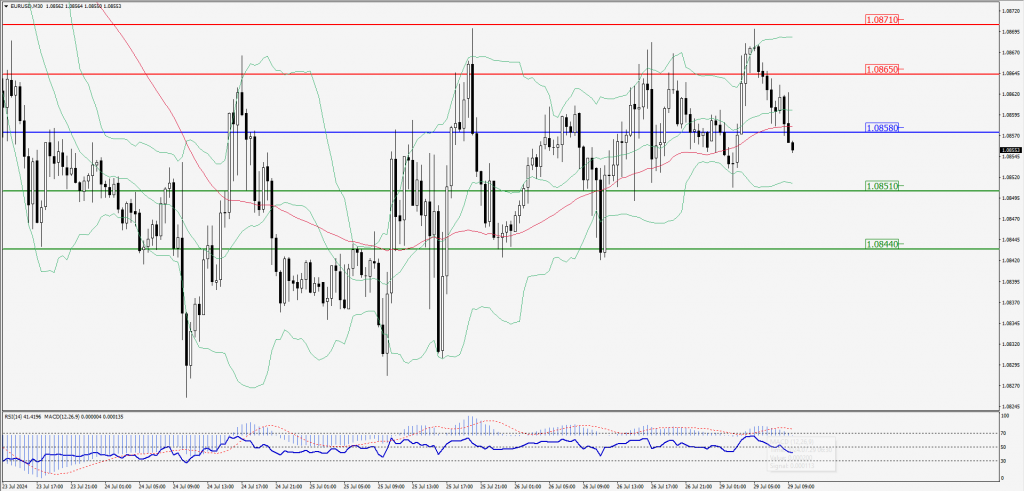
Green Lines Indicate Resistance Levels – Red Lines Indicate Support Levels
Light Blue is a Pivot Point – Black represents the price when the report was produced
GBP/USD Intraday: Trend on the downside
Our pivot point is at 1.28760
Preferable Price Action: Sell positions below pivot with targets at 1.28630 & 1.28520 in extension.
Alternative Price Action: The price above pivot would call for further upside to 1.28890 & 1.29010.
Comment: RSI is below 50 levels.
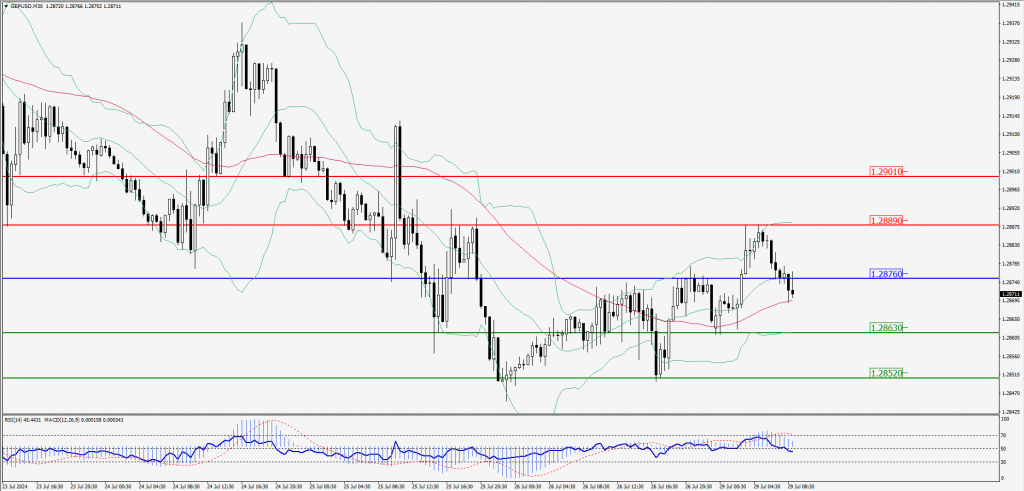
Green Lines Indicate Resistance Levels – Red Lines Indicate Support Levels
Light Blue is a Pivot Point – Black represents the price when the report was produced
USD/JPY Intraday: Trend on the downside
Our pivot point is at 153.670
Preferable Price Action: Sell position below pivot with the target at 152.960 and 152.280 in extension.
Alternative Price Action: The upside breakout of the pivot would call for 154.410 and 155.060.
Comment: MACD is below 50 levels and Pairs below its 55MA & 20MA.
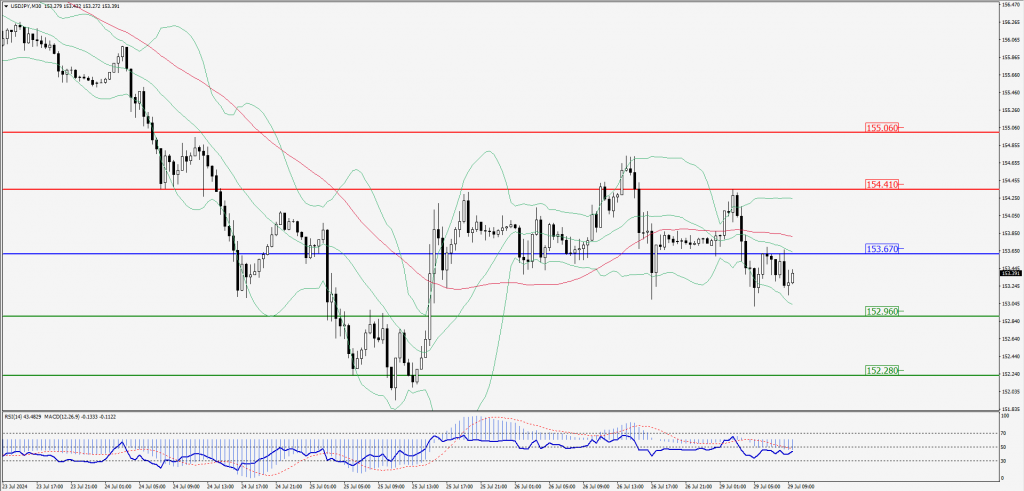
Green Lines Indicate Resistance Levels – Red Lines Indicate Support Levels
Light Blue is a Pivot Point – Black represents the price when the report was produced
AUD/USD Intraday: Trend on the downside
Our pivot point is at 0.65630
Preferable Price Action: Sell positions below pivot with targets at 0.65450 & 0.65300 in extension.
Alternative Price Action: Above pivot a further upside with 0.65820 & 0.65980 as targets.
Comment: RSI is above 50 levels.
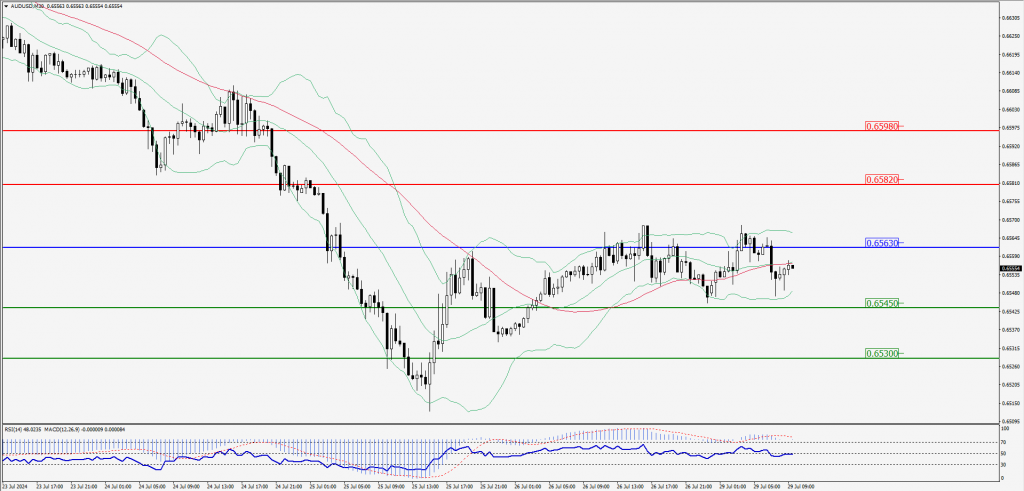
Green Lines Indicate Resistance Levels – Red Lines Indicate Support Levels
Light Blue is a Pivot Point – Black represents the price when the report was produced
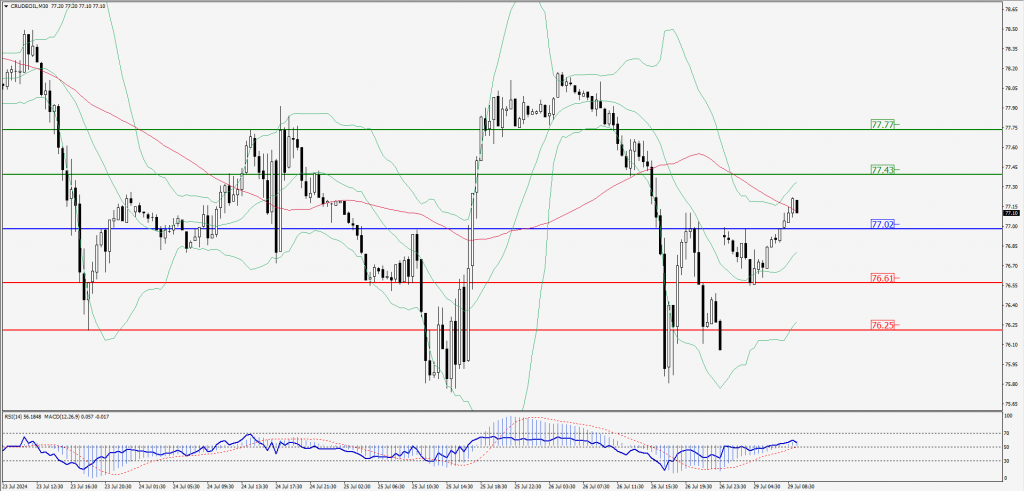
CRUDEOIL Intraday: Trend on the upside
Our pivot point is at 77.02
Preferable Price Action: Above pivot buy oil with 77.43 & 77.77 as targets.
Alternative Price Action: Sell crude below pivot with targets at 76.61 and 76.25 in extension.
Comment: RSI is above 50 levels and pairs above its 20MA.
Green Lines Indicate Resistance Levels – Red Lines Indicate Support Levels
Light Blue is a Pivot Point – Black represents the price when the report was produced
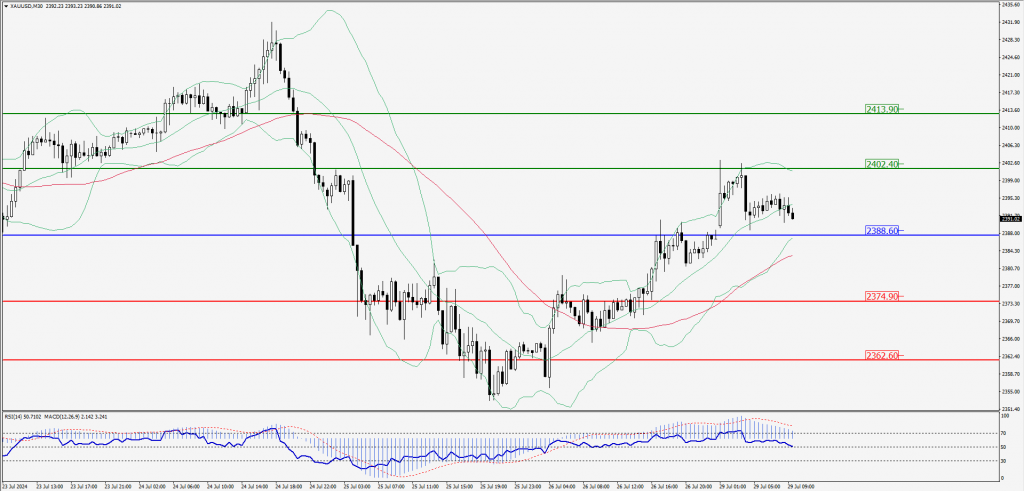
XAU/USD Intraday: Trend on the upside
Our pivot point is at 2388.60
Preferable Price Action: Further upside to 2402.40 and 2413.90.
Alternative Price Action: If the price gives an downside breakout of a pivot, then the price extends to 2374.90 and 2362.60.
Comment: MACD is above 50 levels and pairs above its 55MA.
Green Lines Indicate Resistance Levels – Red Lines Indicate Support Levels
Light Blue is a Pivot Point – Black represents the price when the report was produced
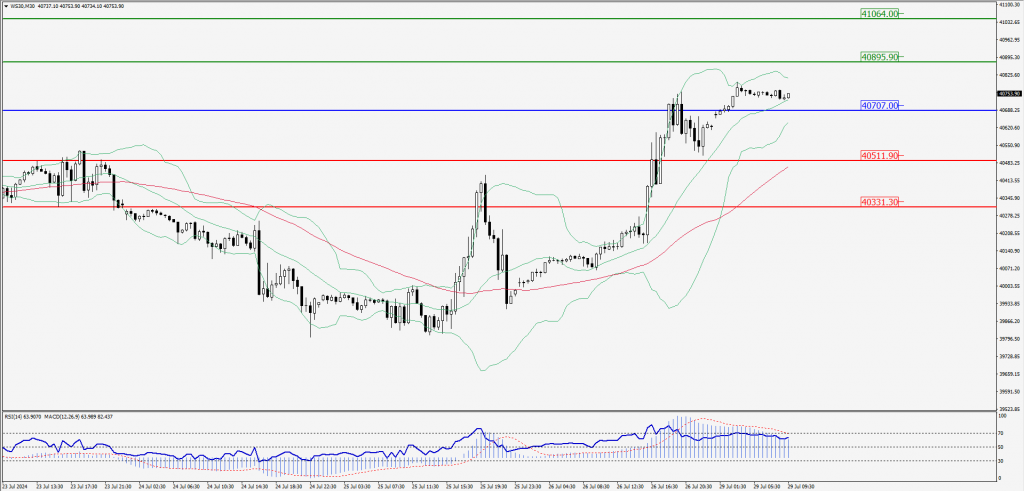
Dow Jones Intraday: Trend on the upside
Our pivot point is 40,707.00
Preferable Price Action: Take buy positions above the pivot with targets at 40,895.90 & 41,064.00.
Alternative Price Action: Below 40,707.00 looks for further downside to 40,511.90 & 40,331.30.
Comment: RSI is above 50 levels and pairs above its 55MA & 20MA.
Green Lines Indicate Resistance Levels – Red Lines Indicate Support Levels
Light Blue is a Pivot Point – Black represents the price when the report was produced