Market Wrap: Stocks, Bonds, Commodities
Most Asian currencies rose on Wednesday before more cues on interest rate cuts from the Federal Reserve, while the Japanese yen was volatile following mixed signals from the Bank of Japan.
The Dow Jones Industrial Average rose 203.40 points to 40,743.33, the S&P 500 loss 0.50% to 5,436.44 and the Nasdaq Composite descend 222.78 points to 17,147.42.
MSCI’s index of Asia-Pacific stocks outside Japan is up 1.18% to 692.52 levels. The Australian index was higher by 1.75% to 8,092.30. Japanese Nikkei Index increase 1.59% today.
European stocks were positive on Wednesday, with the Stoxx Europe 50 Index increase 1.11% to 4,894.55, Germany’s DAX ascend 0.57% to 18,528.85, and France’s CAC higher 1.15% to 7,560.54 and U.K.’s FTSE 100 gain 1.23% to 8,376.56.
Benchmark 10-year U.S. Treasury rose as demand for safe assets slipped again, today 10-year bond yields increase 0.15% to 4.1470.
Oil futures rebounded more than $1 a barrel from 7-week lows on Wednesday after the killing of Hamas leader Ismail Haniyeh in Iran ratcheted up tensions in the Middle East, but prices stayed under pressure from concerns about weak China demand.
Spot Brent crude oil increase 1.88% to $79.54 per barrel. US West Texas Intermediate crude is increase 2.07% to $76.28 a barrel.
The yellow metal gold is up 0.43% to 2,462.45 dollars per ounce.
Market Wrap: Forex
Japan will retain its basic approach on the yen with intervention remaining an option to tackle excessively volatile moves in the exchange rate, the country’s new top currency diplomat Atsushi Mimura told Reuters.
Today, the U.S. dollar index measures the Greenback against a trade-weighted basket of six major currencies, which decrease 0.15% to 104.1650.
The Euro US Dollar (EUR/USD) is a widely traded pair that is increase 0.01% today. This left the pair trading around $1.08170.
The Japanese yen was will move negative against the U.S. dollar on Wednesday. Today USD/JPY is trades pair that decrease 0.42% to the 152.120 level.
Another commodity-related currency mixed against the U.S dollar, AUD/USD loss 0.50% to 0.65040, and NZD/USD increase 0.32% to 0.59220 level.
EUR/USD Intraday: Support level at 1.08190
Our pivot point is at 1.08190
Preferable Price Action: Take buy positions above pivot level with targets at 1.08300 & 1.08400 in extension.
Alternative Price Action: Sell pivot looks for a further downside to 1.08080 & 1.07990.
Comment: RSI is above 50 levels.
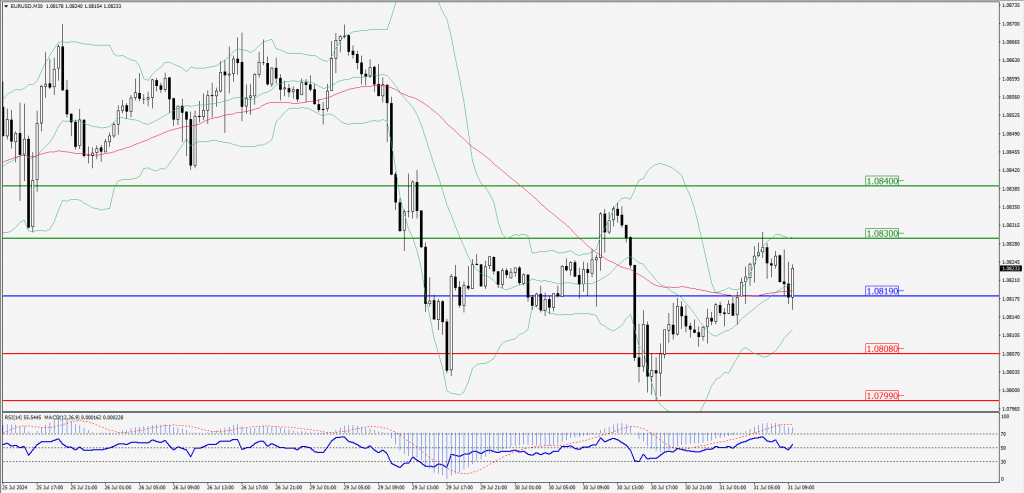
Green Lines Indicate Resistance Levels – Red Lines Indicate Support Levels
Light Blue is a Pivot Point – Black represents the price when the report was produced
GBP/USD Intraday: Trend on the downside
Our pivot point is at 1.28410
Preferable Price Action: Sell positions below pivot with targets at 1.28280 & 1.28170 in extension.
Alternative Price Action: The price above pivot would call for further upside to 1.28550 & 1.28660.
Comment: RSI is below 50 levels.
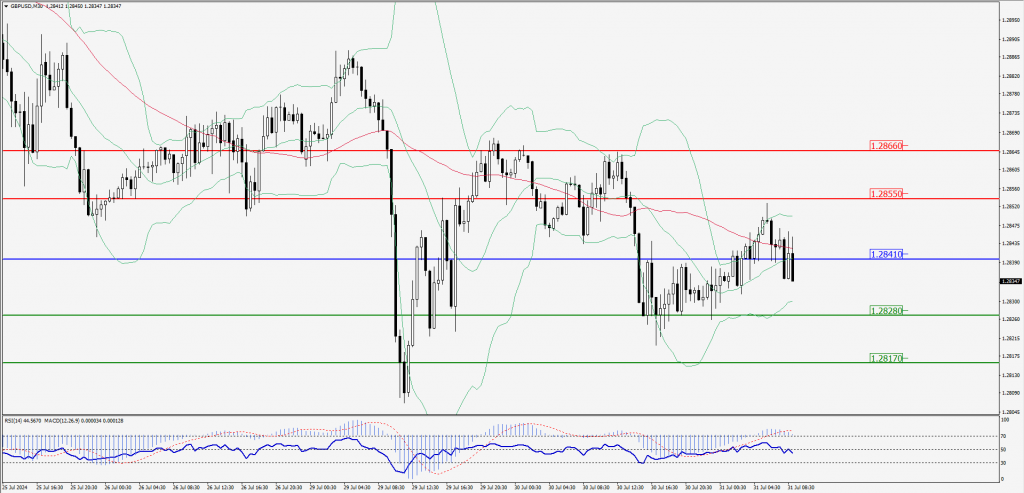
Green Lines Indicate Resistance Levels – Red Lines Indicate Support Levels
Light Blue is a Pivot Point – Black represents the price when the report was produced
USD/JPY Intraday: Trend on the downside
Our pivot point is at 153.070
Preferable Price Action: Sell position below pivot with the target at 152.450 and 151.950 in extension.
Alternative Price Action: The upside breakout of the pivot would call for 153.670 and 154.160.
Comment: MACD is below 50 levels and Pairs below its 55MA.
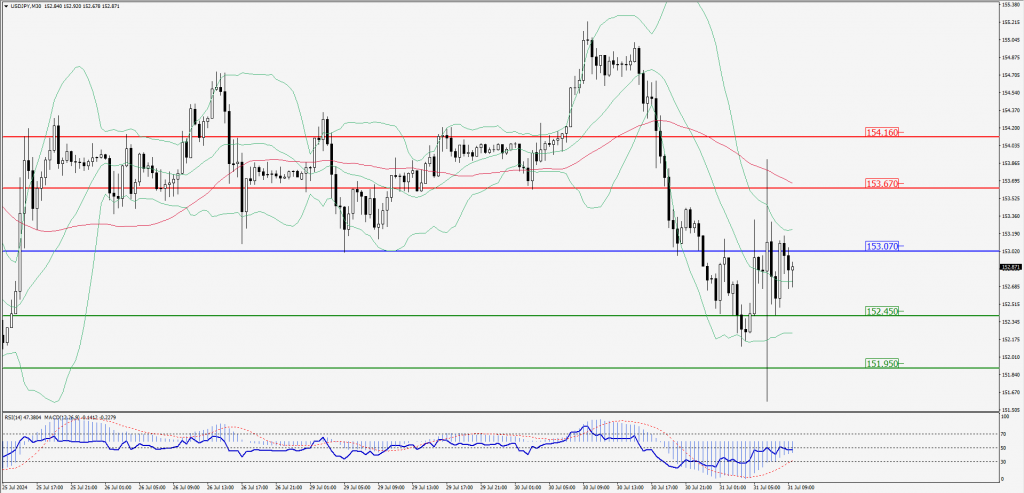
Green Lines Indicate Resistance Levels – Red Lines Indicate Support Levels
Light Blue is a Pivot Point – Black represents the price when the report was produced
AUD/USD Intraday: Trend on the downside
Our pivot point is at 0.65000
Preferable Price Action: Sell positions below pivot with targets at 0.64880 & 0.64790 in extension.
Alternative Price Action: Above pivot a further upside with 0.65120 & 0.65220 as targets.
Comment: RSI is below 50 levels and Pairs below its 55MA & 20MA.
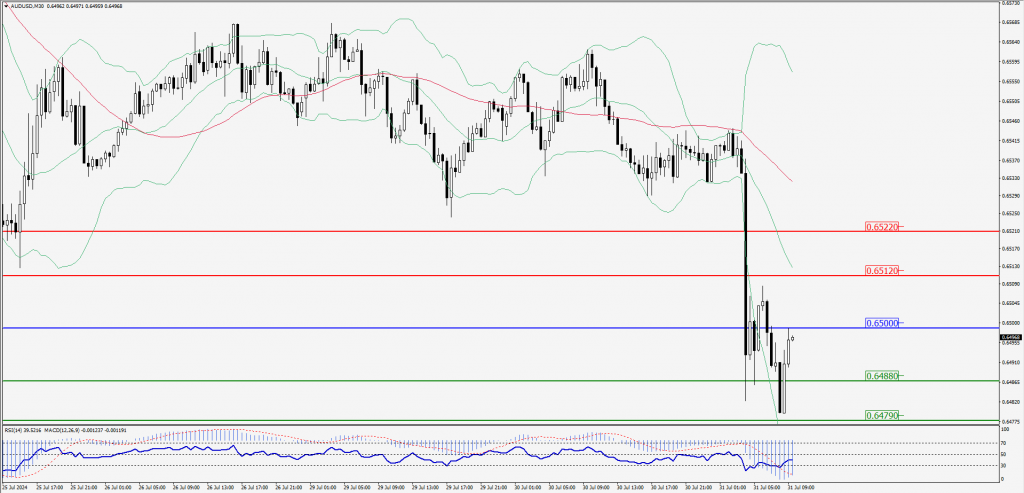
Green Lines Indicate Resistance Levels – Red Lines Indicate Support Levels
Light Blue is a Pivot Point – Black represents the price when the report was produced
CRUDEOIL Intraday: Trend on the upside
Our pivot point is at 75.65
Preferable Price Action: Above pivot buy oil with 76.28 & 76.78 as targets.
Alternative Price Action: Sell crude below pivot with targets at 75.05 and 74.55 in extension.
Comment: RSI is above 50 levels and pairs above its 20MA & 55MA.
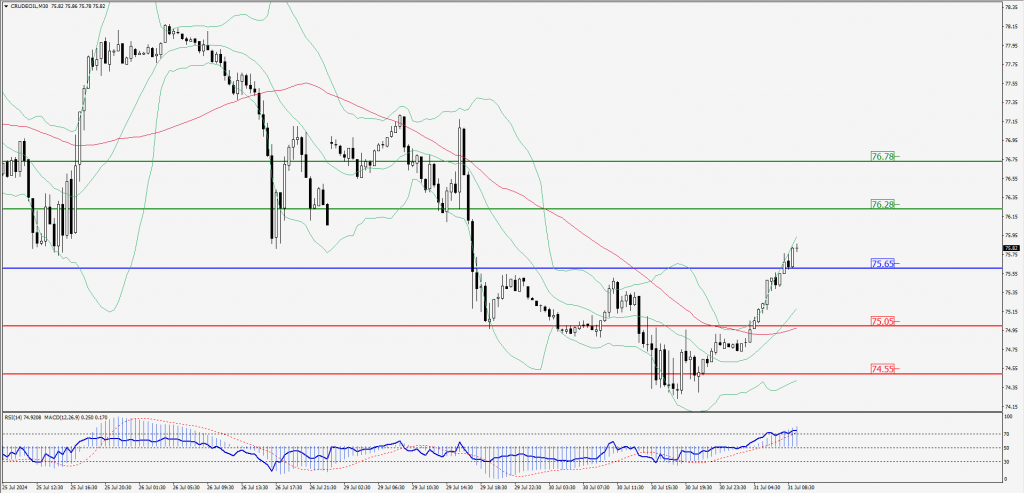
Green Lines Indicate Resistance Levels – Red Lines Indicate Support Levels
Light Blue is a Pivot Point – Black represents the price when the report was produced
XAU/USD Intraday: Trend on the upside
Our pivot point is at 2418.50
Preferable Price Action: Further upside to 2428.50 and 2437.20.
Alternative Price Action: If the price gives an downside breakout of a pivot, then the price extends to 2408.30 and 2398.80.
Comment: MACD is above 50 levels and pairs above its 55MA & 20MA.
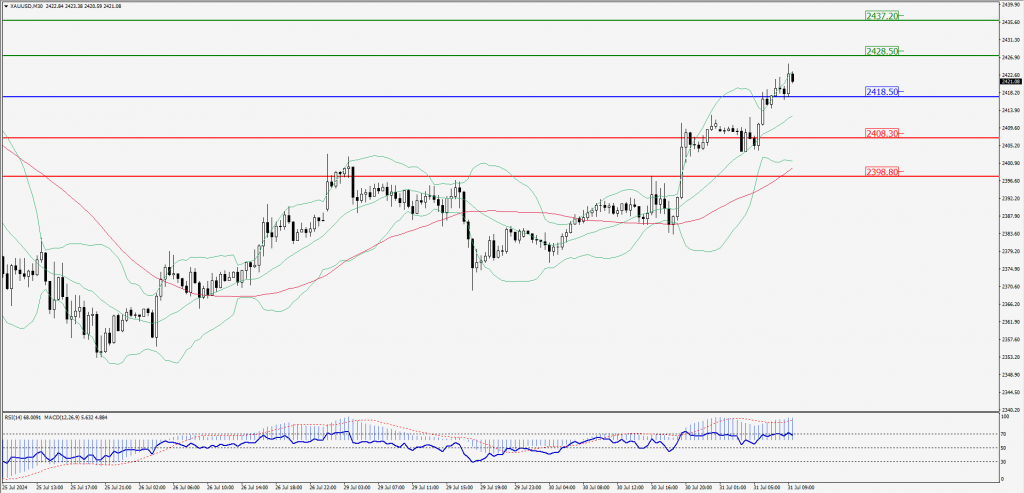
Green Lines Indicate Resistance Levels – Red Lines Indicate Support Levels
Light Blue is a Pivot Point – Black represents the price when the report was produced
Dow Jones Intraday: Trend on the upside
Our pivot point is 40,782.40
Preferable Price Action: Take buy positions above the pivot with targets at 40,963.50 & 41,136.00.
Alternative Price Action: Below 40,782.40 looks for further downside to 40,592.70 & 40,422.40.
Comment: RSI is above 50 levels and pairs above its 20MA & 50MA.
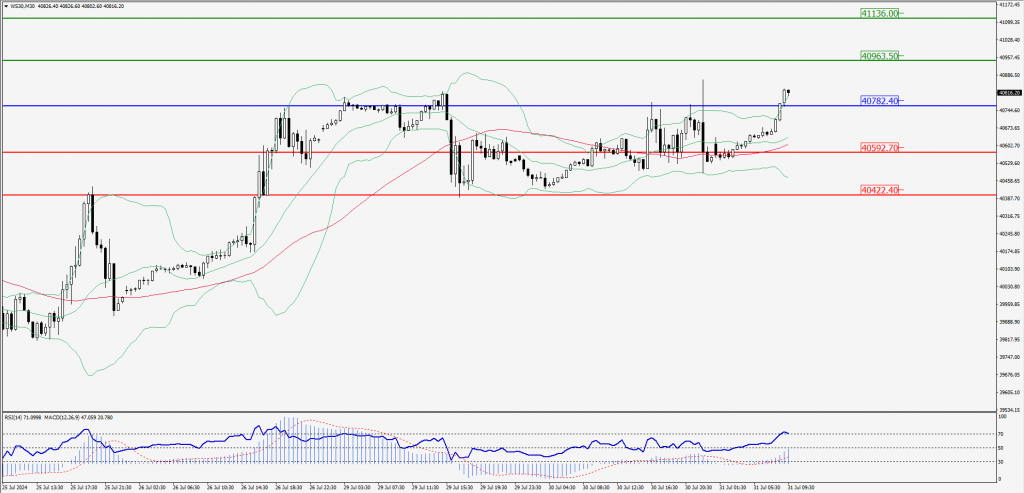
Green Lines Indicate Resistance Levels – Red Lines Indicate Support Levels
Light Blue is a Pivot Point – Black represents the price when the report was produced