Market Wrap: Stocks, Bonds, Commodities
Most Asian currencies moved in a flat-to-low range on Friday with the Chinese yuan logging wild swings amid suspected intervention by the People’s Bank, while the dollar steadied ahead of key inflation data.
The Dow Jones Industrial Average rose 81.20 points to 39,935.07, the S&P 500 loss 0.51% to 5,399.22 and the Nasdaq Composite descend 160.69 points to 17,181.72.
MSCI’s index of Asia-Pacific stocks outside Japan is down 0.34% to 683.60 levels. The Australian index was higher by 0.76% to 7,921.30. Japanese Nikkei Index decrease 0.64% today.
European stocks were positive on Friday, with the Stoxx Europe 50 Index increase 0.77% to 4,848.10, Germany’s DAX ascend 0.22% to 18,343.35, and France’s CAC higher 0.86% to 7,491.16 and U.K.’s FTSE 100 gain 0.92% to 8,261.50.
Benchmark 10-year U.S. Treasury rose as demand for safe assets slipped again, today 10-year bond yields decrease 0.05% to 4.2570.
Oil prices were little changed on Friday but on track for a third consecutive weekly decline, pressured by muted demand in China and expectations of a Gaza ceasefire deal that could ease Middle East tensions and accompanying supply concerns.
Spot Brent crude oil decrease 0.05% to $82.33 per barrel. US West Texas Intermediate crude is decrease 0.10% to $78.20 a barrel.
The yellow metal gold is up 0.74% to 2,370.85 dollars per ounce.
Market Wrap: Forex
The reading pushed up hopes that the U.S. economy was headed for a soft landing, where growth will remain steady while inflation eases.
Today, the U.S. dollar index measures the Greenback against a trade-weighted basket of six major currencies, which increase 0.06% to 104.1670.
The Euro US Dollar (EUR/USD) is a widely traded pair that is either up or down 0.02% today. This left the pair trading around $1.08440.
The Japanese yen was will move positive against the U.S. dollar on Friday. Today USD/JPY is trades pair that increase 0.19% to the 154.230 level.
Another commodity-related currency positive against the U.S dollar, AUD/USD rose 0.28% to 0.65560, and NZD/USD increase 0.17% to 0.58960 level.
EUR/USD Intraday: Resistance level at 1.08560
Our pivot point is at 1.08560
Preferable Price Action: Take sell positions below pivot level with targets at 1.08460 & 1.08360 in extension.
Alternative Price Action: Buy pivot looks for a further upside to 1.08670 & 1.08770.
Comment: RSI is below 50 levels and Pairs below its 20MA.
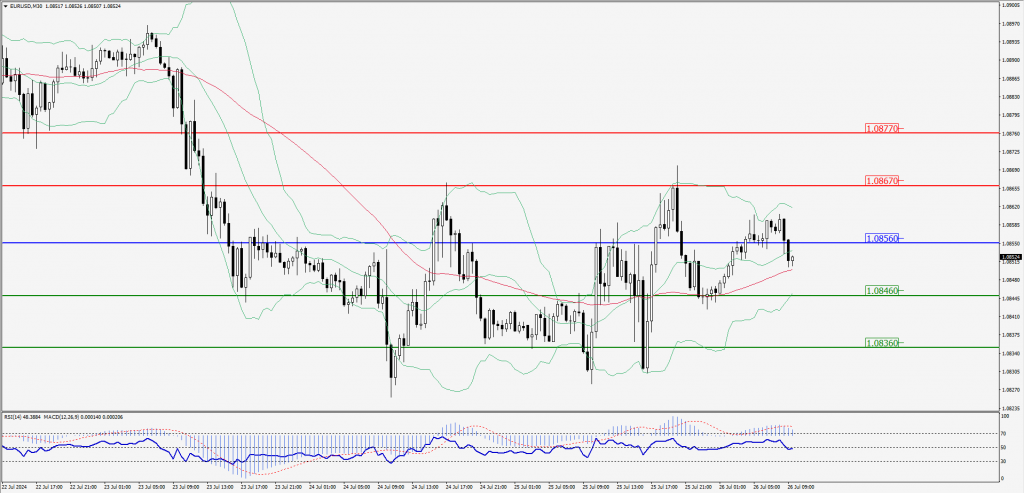
Green Lines Indicate Resistance Levels – Red Lines Indicate Support Levels
Light Blue is a Pivot Point – Black represents the price when the report was produced
GBP/USD Intraday: Trend on the downside
Our pivot point is at 1.28660
Preferable Price Action: Sell positions below pivot with targets at 1.28530 & 1.28420 in extension.
Alternative Price Action: The price above pivot would call for further upside to 1.28790 & 1.28910.
Comment: RSI is below 50 levels and Pairs below its 55MA.
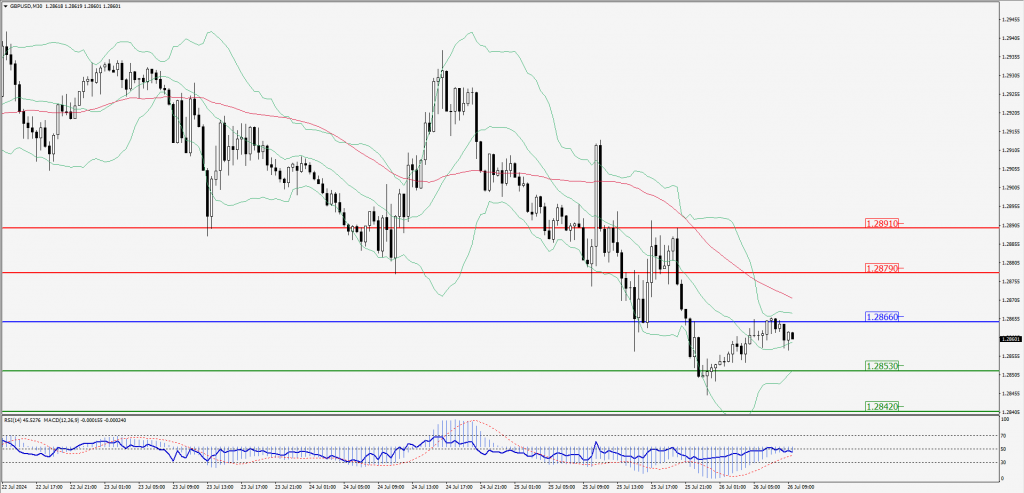
Green Lines Indicate Resistance Levels – Red Lines Indicate Support Levels
Light Blue is a Pivot Point – Black represents the price when the report was produced
USD/JPY Intraday: Trend on the downside
Our pivot point is at 153.930
Preferable Price Action: Sell position below pivot with the target at 153.240 and 152.560 in extension.
Alternative Price Action: The upside breakout of the pivot would call for 154.660 and 155.320.
Comment: MACD is below 50 levels.
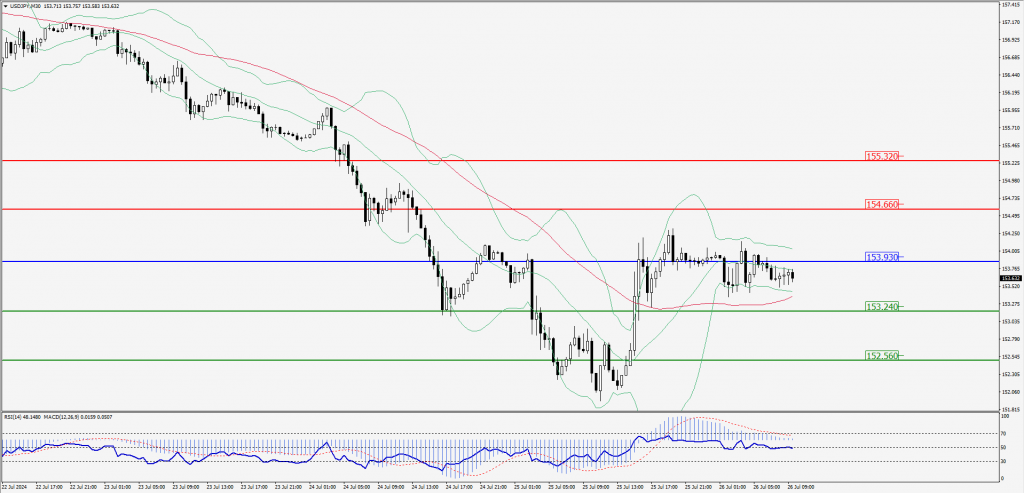
Green Lines Indicate Resistance Levels – Red Lines Indicate Support Levels
Light Blue is a Pivot Point – Black represents the price when the report was produced
AUD/USD Intraday: Trend on the upside
Our pivot point is at 0.65500
Preferable Price Action: Buy positions above pivot with targets at 0.65710 & 0.65880 in extension.
Alternative Price Action: Below pivot a further downside with 0.65300 & 0.65130 as targets.
Comment: RSI is above 50 levels and Pairs above its 55MA & 20MA.
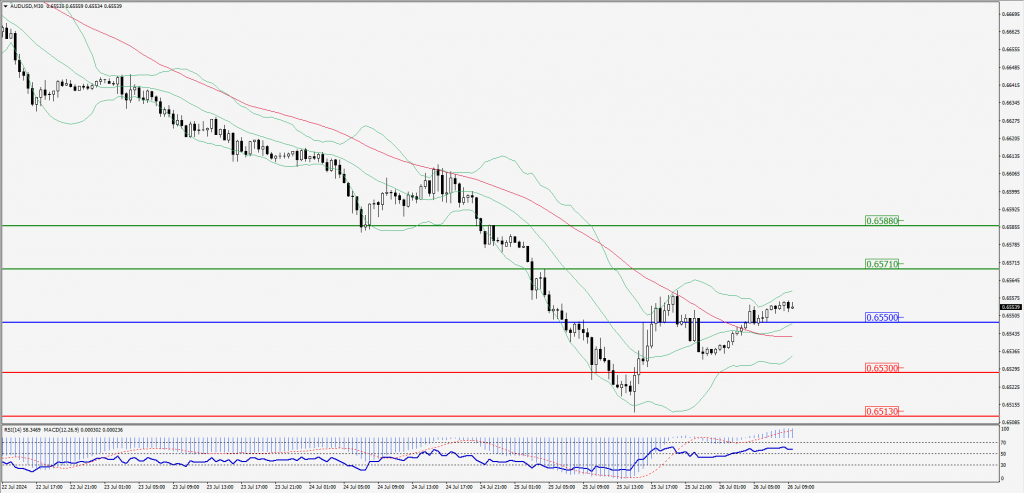
Green Lines Indicate Resistance Levels – Red Lines Indicate Support Levels
Light Blue is a Pivot Point – Black represents the price when the report was produced
CRUDEOIL Intraday: Trend on the upside
Our pivot point is at 77.96
Preferable Price Action: Above pivot buy oil with 78.38 & 78.77 as targets.
Alternative Price Action: Sell crude below pivot with targets at 77.53 and 77.14 in extension.
Comment: RSI is above 50 levels and pairs above its 55MA.
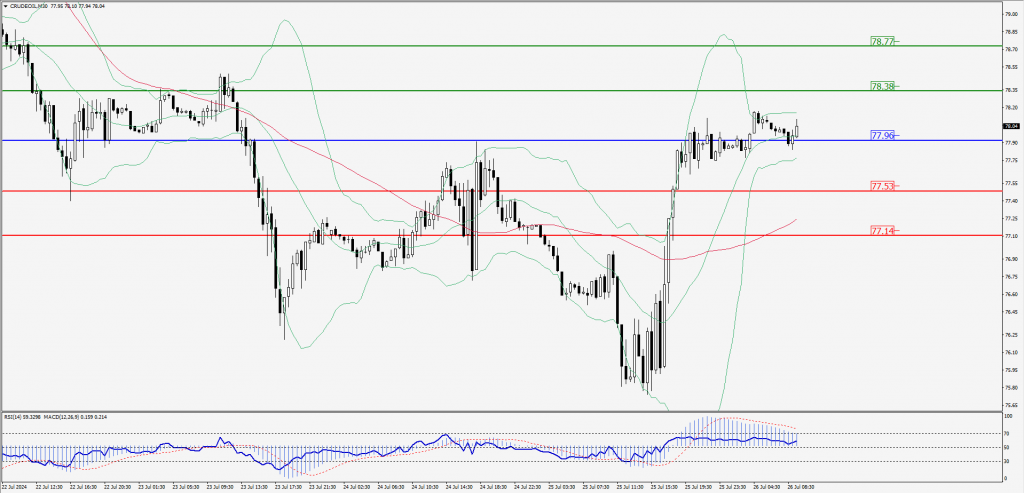
Green Lines Indicate Resistance Levels – Red Lines Indicate Support Levels
Light Blue is a Pivot Point – Black represents the price when the report was produced
XAU/USD Intraday: Trend on the upside
Our pivot point is at 2367.20
Preferable Price Action: Further upside to 2377.20 and 2386.20.
Alternative Price Action: If the price gives an downside breakout of a pivot, then the price extends to 2357.50 and 2349.10.
Comment: MACD is above 50 levels.
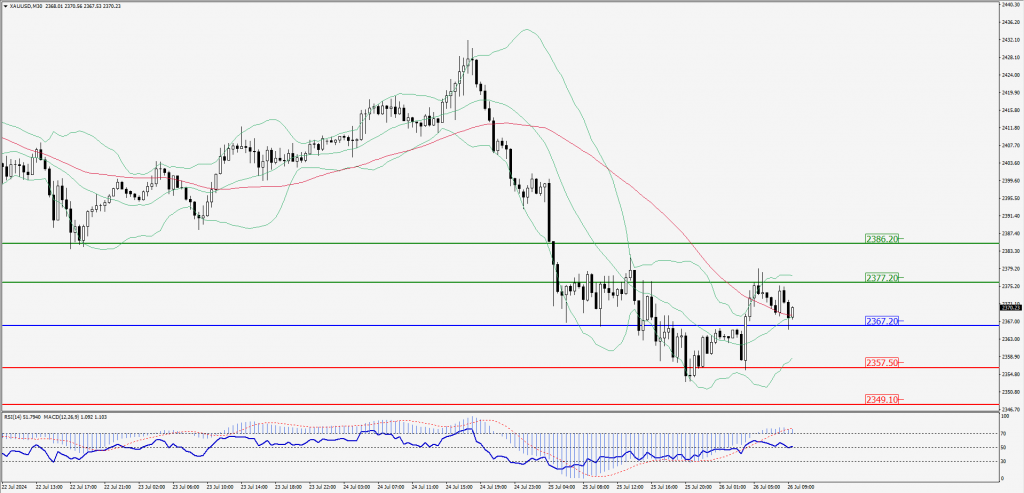
Green Lines Indicate Resistance Levels – Red Lines Indicate Support Levels
Light Blue is a Pivot Point – Black represents the price when the report was produced
Dow Jones Intraday: Trend on the upside
Our pivot point is 40,066.30
Preferable Price Action: Take buy positions above the pivot with targets at 40,164.30 & 40,247.00.
Alternative Price Action: Below 40,066.30 looks for further downside to 39,970.40 & 39,878.50.
Comment: RSI is above 50 levels and pairs above its 55MA & 20MA.
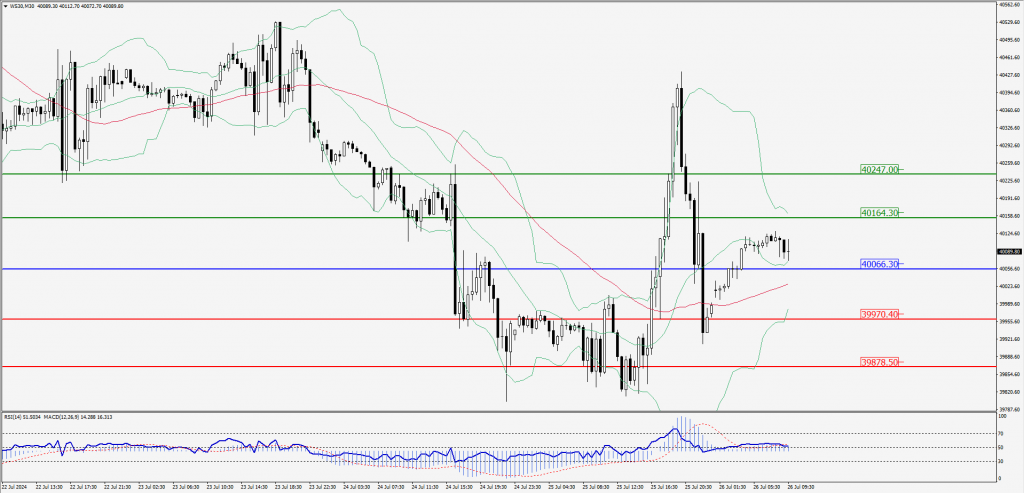
Green Lines Indicate Resistance Levels – Red Lines Indicate Support Levels
Light Blue is a Pivot Point – Black represents the price when the report was produced