Market Wrap: Stocks, Bonds, Commodities
Stocks soared Friday, led by tech, after a weak jobs report. Warren Buffett’s imminent appearance and AI earnings add to the buzz.
The Dow Jones Industrial Average rose 450.02 points to 38,675.68, the S&P 500 gain 1.26% to 5,127.79 and the Nasdaq Composite surged 315.37 points to 16,156.33.
MSCI’s index of Asia-Pacific stocks outside Japan is surged 0.62% to 677.51 levels. The Australian index was high by 0.70% to 7,682.40. Japanese Nikkei Index decline 0.10% today.
European stocks were positive on Monday, with the Stoxx Europe 50 Index increase 0.73% to 4,957.65, Germany’s DAX surged 0.89% to 18,153.95, and France’s CAC higher 0.71% to 8,014.00 and U.K.’s FTSE 100 gain 0.51% to 8,213.49.
Benchmark 10-year U.S. Treasury rose as demand for safe assets slipped again, today 10-year bond yields negative 0.62% to 4.4700.
Oil prices rose in early trading after Israel closed the Kerem Shalom humanitarian crossing into Gaza on Sunday, responding to a rocket barrage fired by Hamas.
Spot Brent crude oil surged 0.80% to $83.62 per barrel. US West Texas Intermediate crude is up 1.01% to $78.90 a barrel.
The yellow metal gold is increase 0.89% to 2,329.15 dollars per ounce.
Market Wrap: Forex
The U.S. dollar steadied on Monday after slumping in the prior week on weaker-than-anticipated nonfarm payrolls data, which led traders to push up the timeline for potential Federal Reserve interest rate cuts this year.
Today, the U.S. dollar index measures the Greenback against a trade-weighted basket of six major currencies, which surged 0.01% to 104.930.
The Euro US Dollar (EUR/USD) is a widely traded pair that is up 0.13% today. This left the pair trading around $1.07720.
The Japanese yen was negative against the U.S. dollar on Monday. Today USD/JPY is higher 0.47% to the 153.700 level.
Another commodity-related currency positive against the U.S dollar, AUD/USD rose 0.29% to 0.66270, and NZD/USD ascend 0.15% to 0.60190 level.
EUR/USD Intraday: Support level at 1.07600
Our pivot point is at 1.07600
Preferable Price Action: Take buy positions above pivot level with targets at 1.07840 & 1.08020 in extension.
Alternative Price Action: Below pivot looks for a further downside to 1.07360 & 1.07160.
Comment: RSI is above 50 levels and pairs above 55MA.
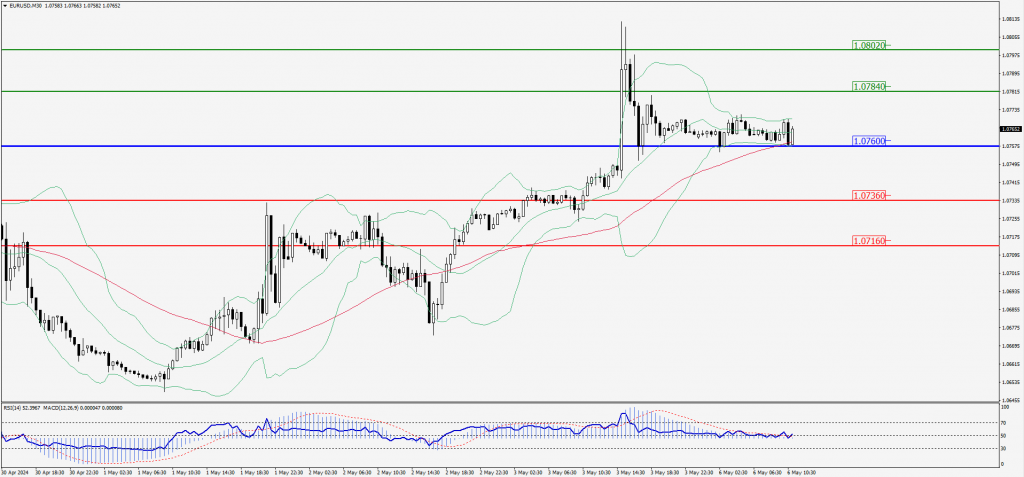
Green Lines Indicate Resistance Levels – Red Lines Indicate Support Levels
Light Blue is a Pivot Point – Black represents the price when the report was produced
GBP/USD Intraday: Trend on the upside
Our pivot point is at 1.25610
Preferable Price Action: Buy positions above pivot with targets at 1.25890 & 1.26090 in extension.
Alternative Price Action: The price below pivot would call for further downside to 1.25340 & 1.25120.
Comment: RSI is above 50 levels and pairs above its 20MA & 55MA.
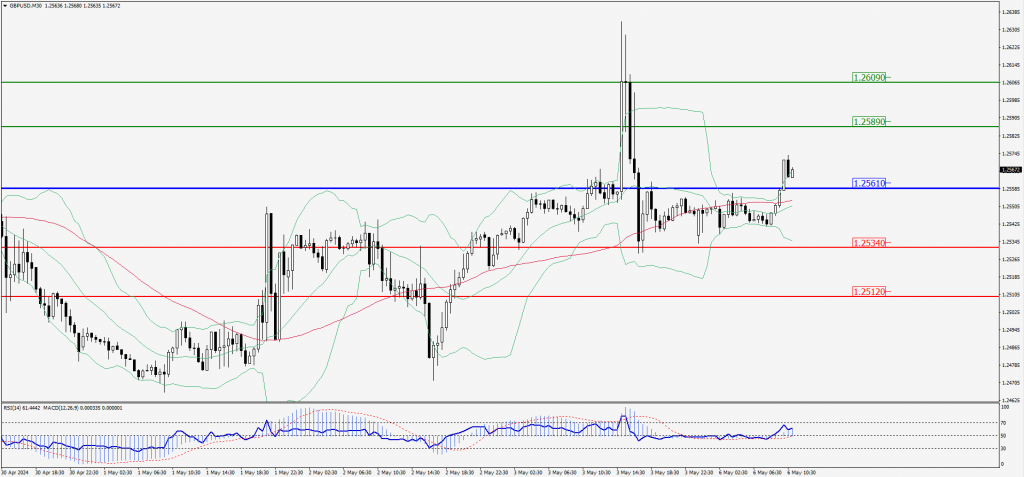
Green Lines Indicate Resistance Levels – Red Lines Indicate Support Levels
Light Blue is a Pivot Point – Black represents the price when the report was produced
USD/JPY Intraday: Trend on the upside
Our pivot point is at 153.600
Preferable Price Action: Buy position above pivot with the target at 154.580 and 155.330 in extension.
Alternative Price Action: The downside breakout of the pivot would call for 152.660 and 151.890.
Comment: MACD is above 50 levels and Pairs above its 55MA.
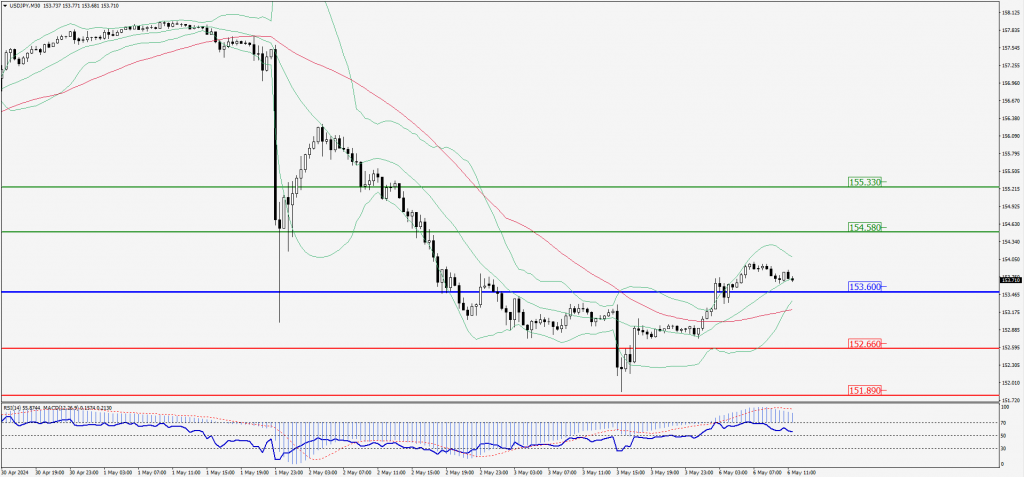
Green Lines Indicate Resistance Levels – Red Lines Indicate Support Levels
Light Blue is a Pivot Point – Black represents the price when the report was produced
AUD/USD Intraday: Trend on the upside
Our pivot point is at 0.66180
Preferable Price Action: Buy positions above pivot with targets at 0.66520 & 0.66780 in extension.
Alternative Price Action: Below pivot looks for a further downside with 0.65830 & 0.65550 as targets.
Comment: RSI is above 50 levels and pairs above its 55MA.
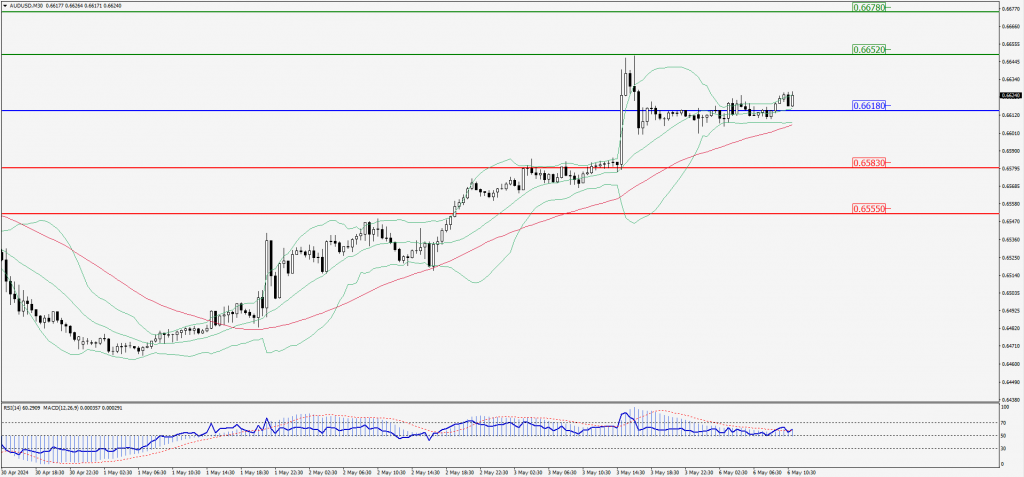
Green Lines Indicate Resistance Levels – Red Lines Indicate Support Levels
Light Blue is a Pivot Point – Black represents the price when the report was produced
CRUDEOIL Intraday: Trend on the upside
Our pivot point is at 78.52
Preferable Price Action: Above pivot buy oil with 79.53 & 80.59 as targets.
Alternative Price Action: Sell crude below pivot with targets at 77.51 and 76.58 in extension.
Comment: MACD is positive territory and pairs above its 20MA & 55MA.
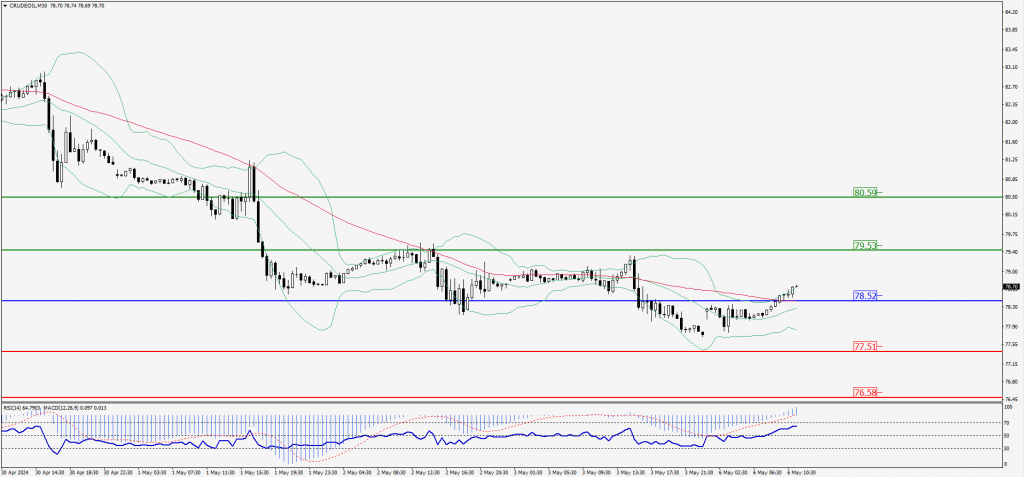
Green Lines Indicate Resistance Levels – Red Lines Indicate Support Levels
Light Blue is a Pivot Point – Black represents the price when the report was produced
XAU/USD Intraday: Major trend on the upside
Our pivot point is 2319.20
Preferable Price Action: Further upside to 2328.10 and 2334.00.
Alternative Price Action: If the price gives an downside breakout of a pivot, then the price extends to 2310.80 and 2303.70.
Comment: MACD is above 50 levels and pairs above its 20MA & 55MA.
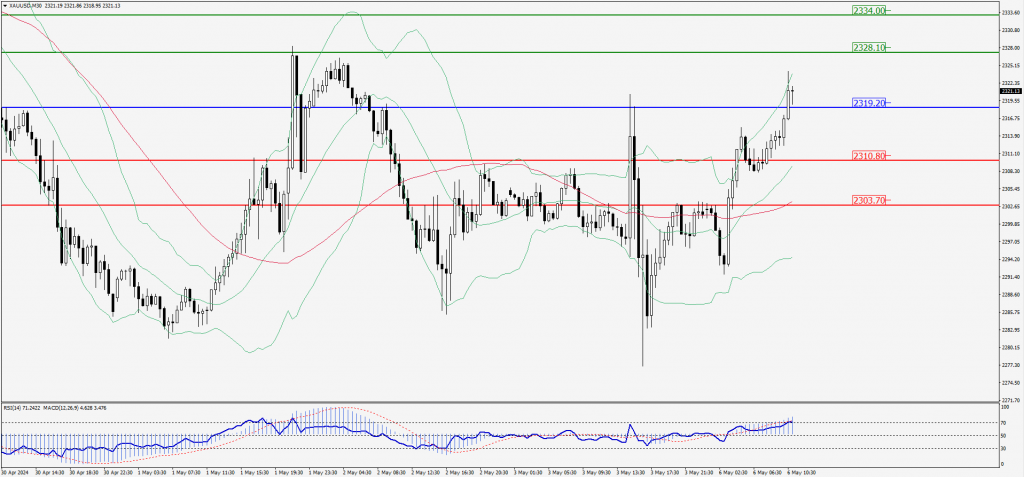
Green Lines Indicate Resistance Levels – Red Lines Indicate Support Levels
Light Blue is a Pivot Point – Black represents the price when the report was produced
Dow Jones Intraday: Trend on the upside
Our pivot point is 38,711.60
Preferable Price Action: Take buy positions above the pivot with targets at 38,900.90 & 39,057.20.
Alternative Price Action: Above 38,711.60 looks for further downside to 38,522.30 & 38,361.60.
Comment: RSI is above 50 levels and Pairs above its 55MA.
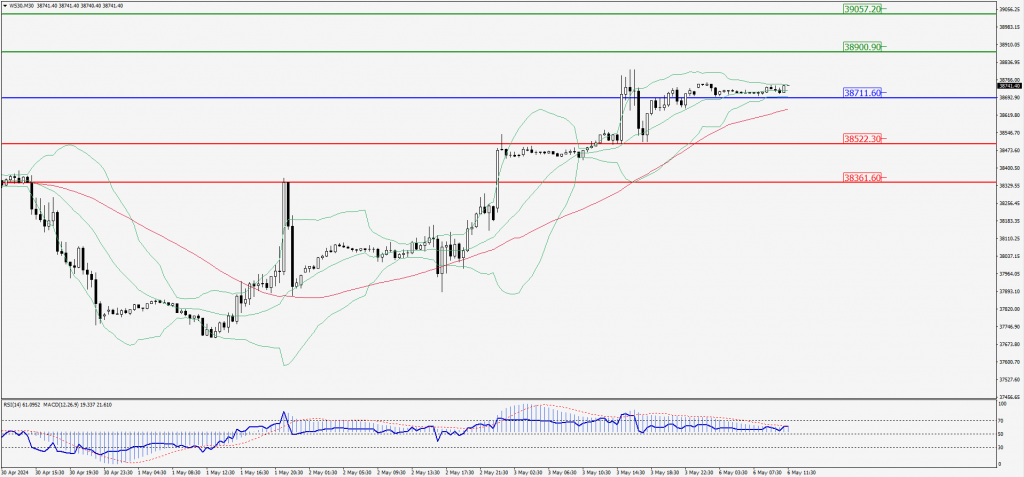
Green Lines Indicate Resistance Levels – Red Lines Indicate Support Levels
Light Blue is a Pivot Point – Black represents the price when the report was produced