Market Wrap: Stocks, Bonds, Commodities
US stocks ended lower on Tuesday as markets weighed economic data showing rising labor costs and deteriorating consumer confidence on the day of a key Federal Reserve policy decision the direction of interest rates.
The Dow Jones Industrial Average rose 87.37 points to 37,903.29, the S&P 500 lose 0.34% to 5,018.39 and the Nasdaq Composite drop 52.34 points to 15,605.48.
MSCI’s index of Asia-Pacific stocks outside Japan is surged 0.59% to 665.99 levels. The Australian index was high by 0.23% to 7,587.00. Japanese Nikkei Index slipped 0.10% today.
European stocks were mixed on Thursday, with the Stoxx Europe 50 Index decline 0.448% to 4,897.65, Germany’s DAX surged 0.01% to 17,923.45, and France’s CAC lower 0.81% to 7,920.17 and U.K.’s FTSE 100 gain 0.36% to 8,150.69.
Benchmark 10-year U.S. Treasury rose as demand for safe assets slipped again, today 10-year bond yields positive 0.46% to 4.6130.
Oil prices fell about 2% to a seven-week low on Wednesday on a surprise build in U.S. crude stocks, the prospect of a Middle East ceasefire agreement and persistent U.S. inflation dampening the expected pace of interest rate cuts and oil demand growth.
Spot Brent crude oil surged 0.77% to $84.08 per barrel. US West Texas Intermediate crude is up 0.72% to $79.57 a barrel.
The yellow metal gold is increase 0.19% to 2,315.50 dollars per ounce.
Market Wrap: Forex
The yen dropped against the dollar on Thursday, reversing direction after a sudden surge late on Wednesday that traders and analysts were quick to attribute to intervention by Japanese authorities.
Today, the U.S. dollar index measures the Greenback against a trade-weighted basket of six major currencies, which drop 0.01% to 105.625.
The Euro US Dollar (EUR/USD) is a widely traded pair that is down 0.04% today. This left the pair trading around $1.0705.
The Japanese yen was negative against the U.S. dollar on Thursday. Today USD/JPY is higher 0.53% to the 155.30 level.
Another commodity-related currency positive against the U.S dollar, AUD/USD rose 0.29% to 0.65420, and NZD/USD ascend 0.13% to 0.59360 level.
EUR/USD Intraday: Trend on the upside
Our pivot point is at 1.07130
Preferable Price Action: Take buy positions above pivot level with targets at 1.07270 & 1.07390 in extension.
Alternative Price Action: Below pivot looks for a further downside to 1.07000 & 1.06890.
Comment: RSI is above 50 levels and pairs above 55MA.
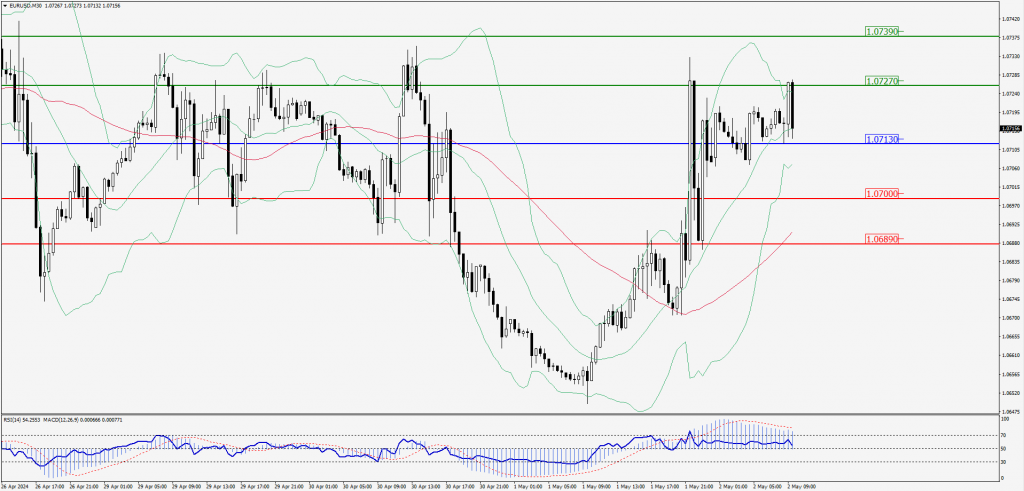
Green Lines Indicate Resistance Levels – Red Lines Indicate Support Levels
Light Blue is a Pivot Point – Black represents the price when the report was produced
GBP/USD Intraday: Support level at 1.25230
Our pivot point is at 1.25230
Preferable Price Action: Buy positions above pivot with targets at 1.25400 & 1.25550 in extension.
Alternative Price Action: The price below pivot would call for further downside to 1.25050 & 1.24900.
Comment: RSI is above 50 levels and pairs above 55MA.
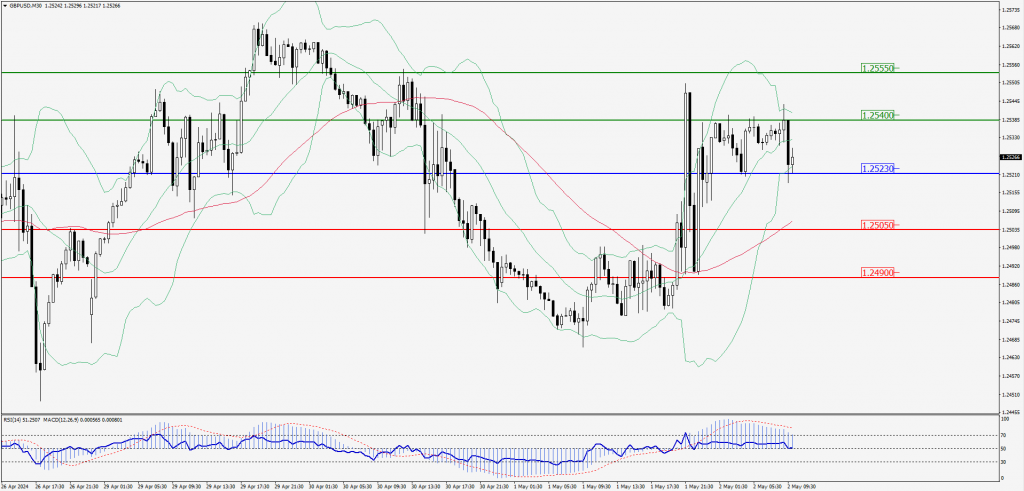
Green Lines Indicate Resistance Levels – Red Lines Indicate Support Levels
Light Blue is a Pivot Point – Black represents the price when the report was produced
USD/JPY Intraday: Trend on the downside
Our pivot point is at 155.710
Preferable Price Action: Sell position below pivot with the target at 154.590 and 153.710 in extension.
Alternative Price Action: The upside breakout of the pivot would call for 156.970 and 157.890.
Comment: MACD is below 50 levels and Pairs below its 20MA & 55MA.
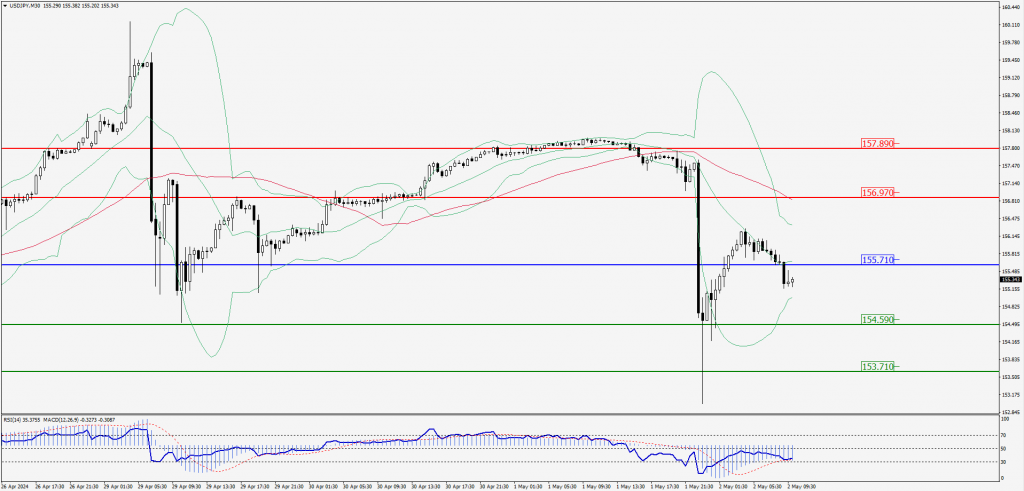
Green Lines Indicate Resistance Levels – Red Lines Indicate Support Levels
Light Blue is a Pivot Point – Black represents the price when the report was produced
AUD/USD Intraday: Trend on the upside
Our pivot point is at 0.65360
Preferable Price Action: Buy positions above pivot with targets at 0.65540 & 0.65690 in extension.
Alternative Price Action: Below pivot looks for a further downside with 0.65170 & 0.65020 as targets.
Comment: RSI is above 50 levels and pairs above its 20MA & 55MA.
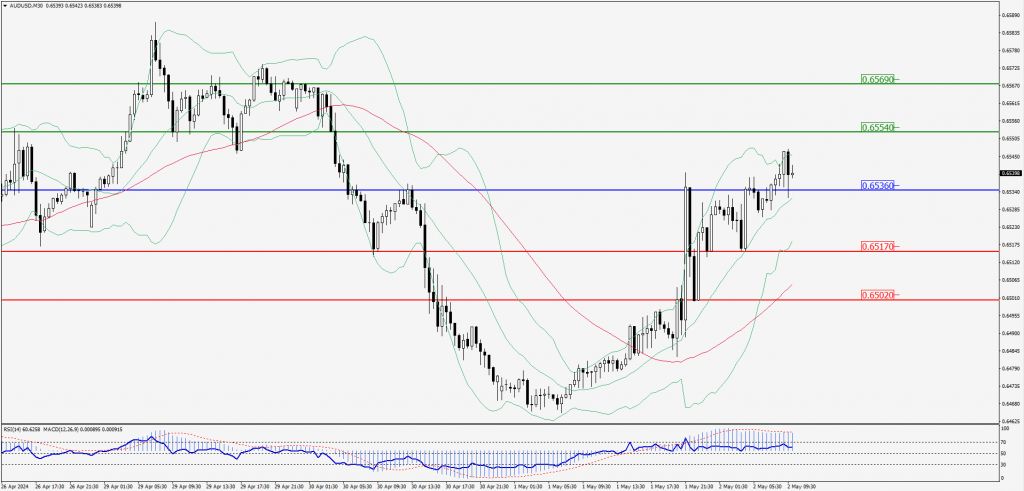
Green Lines Indicate Resistance Levels – Red Lines Indicate Support Levels
Light Blue is a Pivot Point – Black represents the price when the report was produced
CRUDEOIL Intraday: In a consolidation state at 79.48
Our pivot point is at 79.48
Preferable Price Action: Below pivot sell oil with 78.55 & 77.85 as targets.
Alternative Price Action: Buy crude above pivot with targets at 80.39 and 81.15 in extension.
Comment: MACD is negative territory and pairs below its 55MA.
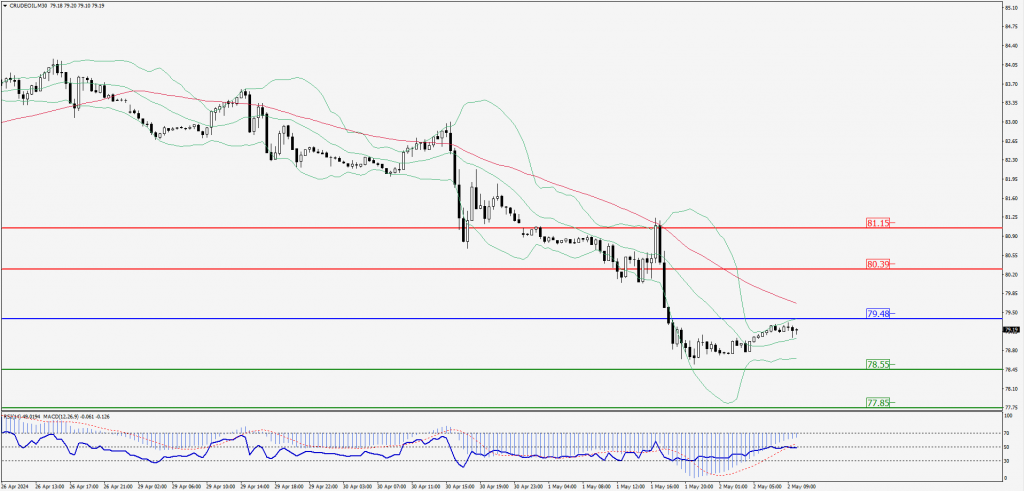
Green Lines Indicate Resistance Levels – Red Lines Indicate Support Levels
Light Blue is a Pivot Point – Black represents the price when the report was produced
XAU/USD Intraday: Trend at the downside
Our pivot point is 2315.90
Preferable Price Action: Further downside to 2299.00 and 2285.70.
Alternative Price Action: If the price gives an upside breakout of a pivot, then the price extends to 2332.80 and 2346.00.
Comment: MACD is below 50 levels and pairs below its 20MA.
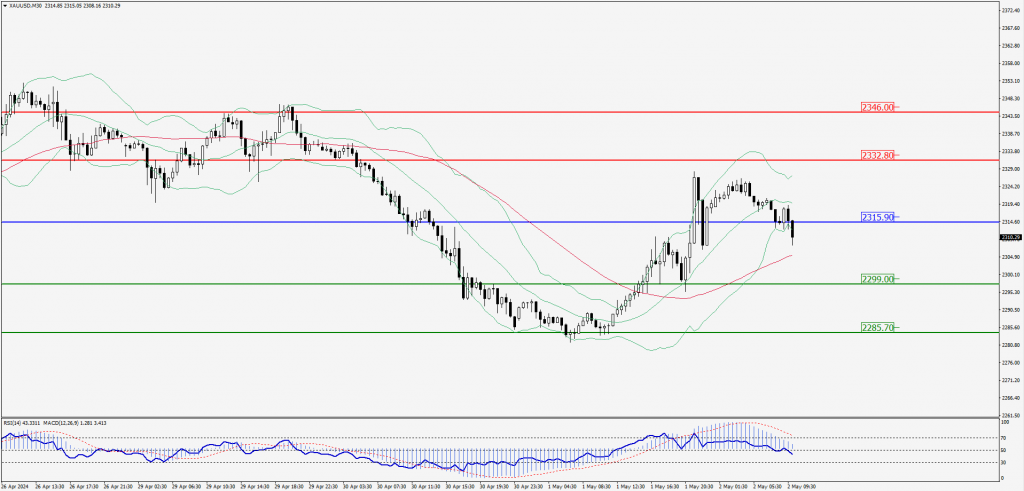
Green Lines Indicate Resistance Levels – Red Lines Indicate Support Levels
Light Blue is a Pivot Point – Black represents the price when the report was produced
Dow Jones Intraday: Trend on the upside
Our pivot point is 38,012.80
Preferable Price Action: Take buy positions above the pivot with targets at 38,118.50 & 38,200.20.
Alternative Price Action: Above 38,012.80 looks for further downside to 37,907.00 & 37824.40.
Comment: RSI is above 50 levels and Pairs above its 55MA.
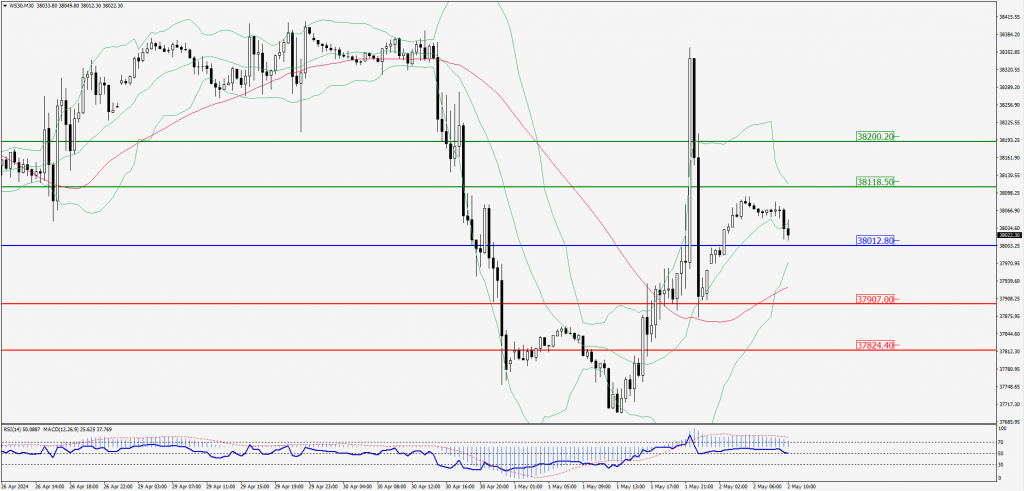
Green Lines Indicate Resistance Levels – Red Lines Indicate Support Levels
Light Blue is a Pivot Point – Black represents the price when the report was produced