Market Wrap: Stocks, Bonds, Commodities
US stocks closed lower on Wednesday as crude prices tumbled and investors weighed cautious US Federal Reserve commentary and ongoing geopolitical strife against mixed quarterly earnings.
The Dow Jones Industrial Average fell 45.66 points to 37,753.31, the S&P 500 loss 0.58% to 5,022.21 and the Nasdaq Composite descend 181.88 points to 15,683.37.
MSCI’s index of Asia-Pacific stocks outside Japan is increase 0.98% to 641.81 levels. The Australian index was higher by 0.48% to 7,642.10. Japanese Nikkei Index surged 0.14% today.
European stocks were mixed on Thursday, with the Stoxx Europe 50 Index increase 0.42% to 4,934.45, Germany’s DAX drop 0.05% to 17,781.45, and France’s CAC higher 0.47% to 8,019.61 and U.K.’s FTSE 100 gain 0.49% to 7,887.06.
Benchmark 10-year U.S. Treasury rose as demand for safe assets surged again, today 10-year bond yields negative 0.37% to 4.567.
Oil prices were little changed after a 3% drop in the previous session as the market remains concerned about demand this year and on signs that a wider conflict in the key Middle East producing region could be avoided.
Spot Brent crude oil descend 0.32% to $87.02 per barrel. US West Texas Intermediate crude is down 0.46% to $82.36 a barrel.
The yellow metal gold is increase 0.28% to 2,395.15 dollars per ounce.
Market Wrap: Forex
The dollar fell for a second day on Thursday after a rare warning by the finance chiefs of the United States, Japan and Korea over the sharp decline in other currencies, which in turn offered the yen some rare respite.
Today, the U.S. dollar index measures the Greenback against a trade-weighted basket of six major currencies, which drop 0.07% to 105.690.
The Euro US Dollar (EUR/USD) is a widely traded pair that is up 0.04% today. This left the pair trading around $1.06750.
The Japanese yen was negative against the U.S. dollar on Thursday. Today USD/JPY is drop 0.03% to the 154.34 level.
Another commodity-related currency positive against the U.S dollar, AUD/USD rose 0.22% to 0.64490, and NZD/USD surged 0.22% to 0.59280 level.
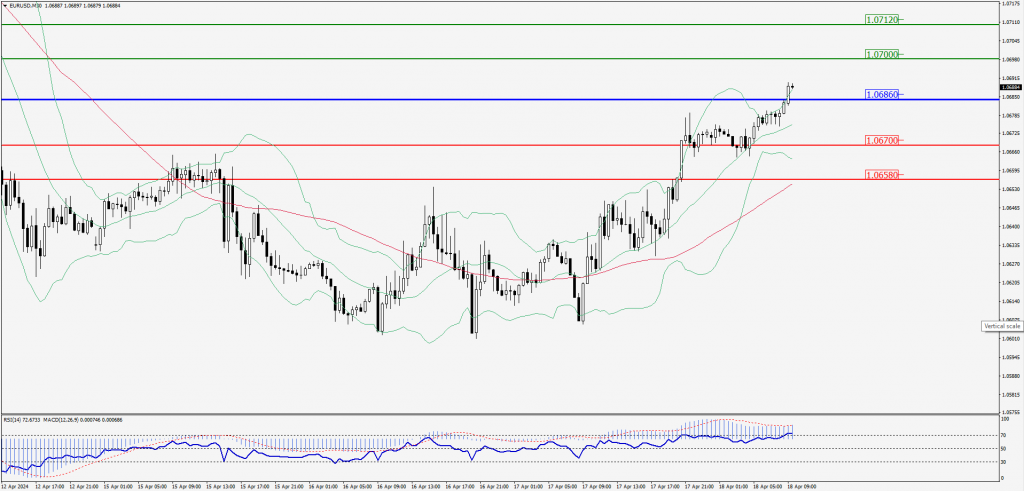
EUR/USD Intraday: Major trend on the upside
Our pivot point is at 1.06860
Preferable Price Action: Take buy positions above pivot level with targets at 1.07000 & 1.07120 in extension.
Alternative Price Action: Below pivot looks for a further downside to 1.06700 & 1.06580.
Comment: RSI is above 50 levels and pairs above its 20MA & 55MA.
Green Lines Indicate Resistance Levels – Red Lines Indicate Support Levels
Light Blue is a Pivot Point – Black represents the price when the report was produced
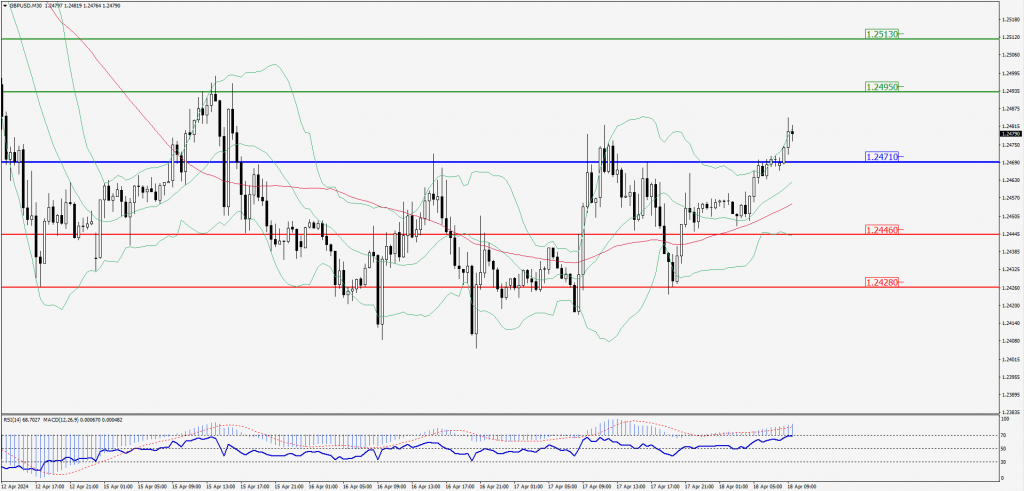
GBP/USD Intraday: Major trend on the upside
Our pivot point is at 1.24710
Preferable Price Action: Buy positions above pivot with targets at 1.24950 & 1.25130 in extension.
Alternative Price Action: The price below pivot would call for further downside to 1.24460 & 1.24280.
Comment: RSI is above 50 levels and Pairs above its 20MA & 55MA.
Green Lines Indicate Resistance Levels – Red Lines Indicate Support Levels
Light Blue is a Pivot Point – Black represents the price when the report was produced
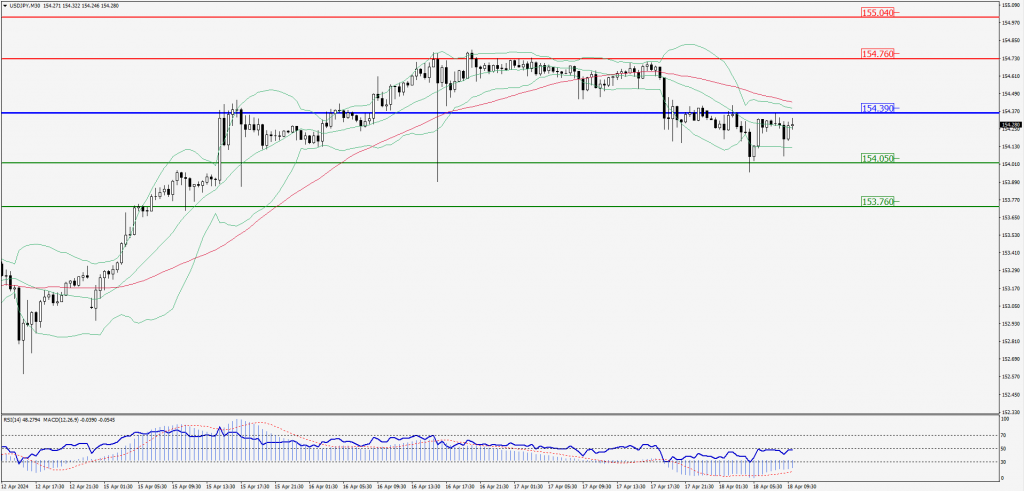
USD/JPY Intraday: Trend on the downside
Our pivot point is at 154.390
Preferable Price Action: Sell position below pivot with the target at 154.050 and 153.760 in extension.
Alternative Price Action: The upside breakout of the pivot would call for 154.760 and 155.040.
Comment: MACD is below 50 levels and Pairs below its 55MA.
Green Lines Indicate Resistance Levels – Red Lines Indicate Support Levels
Light Blue is a Pivot Point – Black represents the price when the report was produced
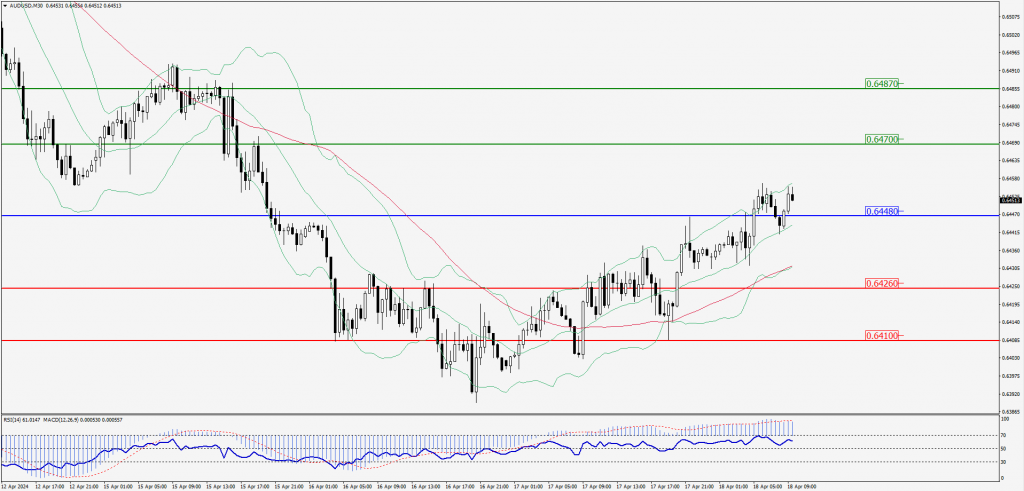
AUD/USD Intraday: Trend on the upside
Our pivot point is at 0.64480
Preferable Price Action: Buy positions above pivot with targets at 0.64700 & 0.64870 in extension.
Alternative Price Action: Below pivot looks for a further downside with 0.64260 & 0.64100 as targets.
Comment: RSI is above 50 levels and pairs above its 20MA & 55MA.
Green Lines Indicate Resistance Levels – Red Lines Indicate Support Levels
Light Blue is a Pivot Point – Black represents the price when the report was produced
CRUDEOIL Intraday: Resistance level at 82.43
Our pivot point is at 82.43
Preferable Price Action: Below pivot sell oil with 81.55 & 80.85 as targets.
Alternative Price Action: Buy crude above pivot with targets at 83.33 and 84.14 in extension.
Comment: MACD is negative territory and pairs below its 55MA.
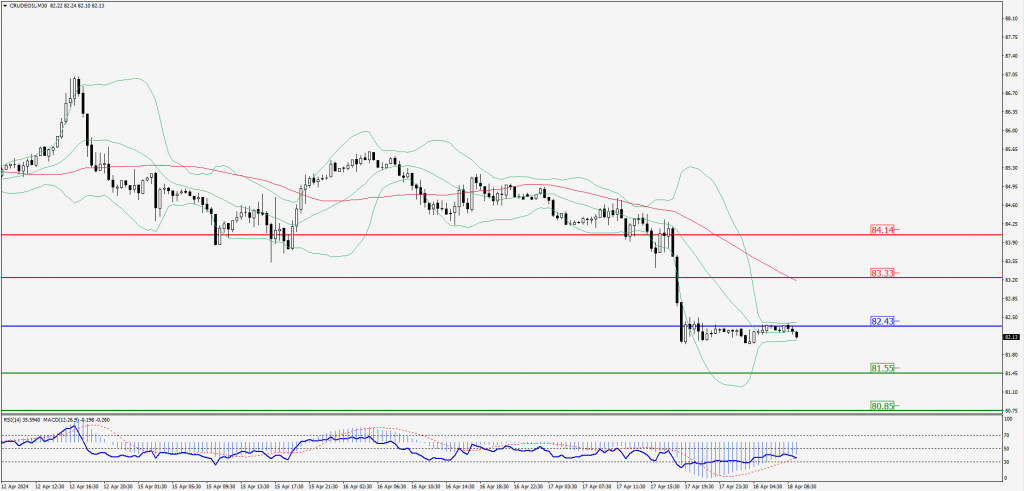
Green Lines Indicate Resistance Levels – Red Lines Indicate Support Levels
Light Blue is a Pivot Point – Black represents the price when the report was produced
XAU/USD Intraday: Trend on the upside
Our pivot point is 2375.70
Preferable Price Action: Further upside to 2392.40 and 2404.80.
Alternative Price Action: If the price gives an downside breakout of a pivot, then the price extends to 2360.60 and 2348.00.
Comment: MACD is above 50 levels and pairs above its 20MA.
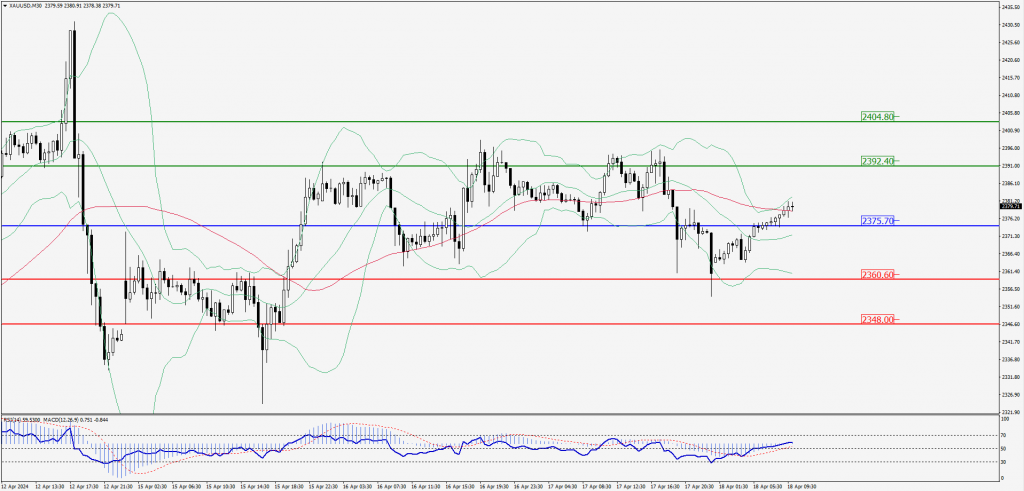
Green Lines Indicate Resistance Levels – Red Lines Indicate Support Levels
Light Blue is a Pivot Point – Black represents the price when the report was produced
Dow Jones Intraday: Trend on the upside
Our pivot point is 37,838.70
Preferable Price Action: Take buy positions above the pivot with targets at 37,990.30 & 38,106.10.
Alternative Price Action: Below 37,838.70 looks for further downside to 37,699.50 & 37,594.80.
Comment: RSI is above 50 levels and Pairs above its 20MA & 50MA.
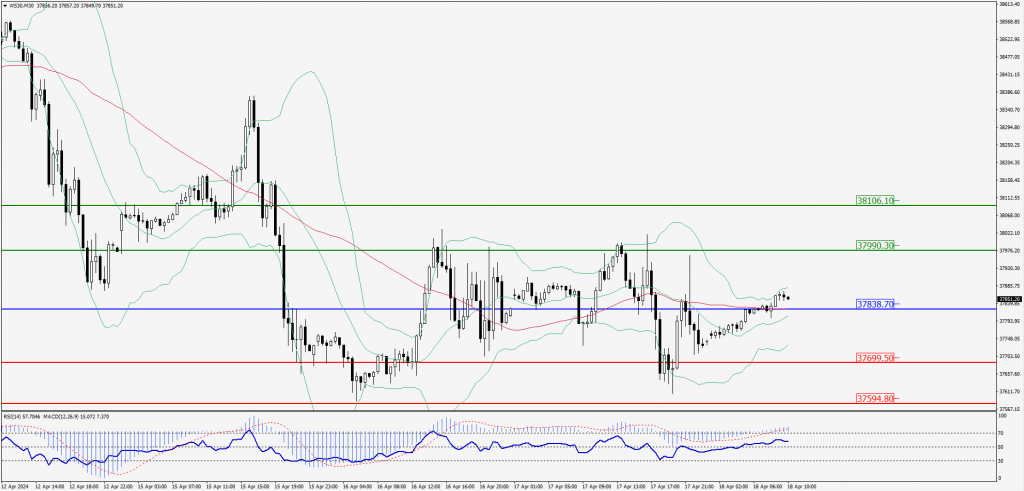
Green Lines Indicate Resistance Levels – Red Lines Indicate Support Levels
Light Blue is a Pivot Point – Black represents the price when the report was produced