Market Wrap: Stocks, Bonds, Commodities
US stocks vacillated on Thursday, swinging from red to green and back as investors contended with the push-pull of a strong economy and restrictive Federal Reserve policy.
The Dow Jones Industrial Average rose 22.07 points to 37,775.38, the S&P 500 loss 0.22% to 5,011.12 and the Nasdaq Composite descend 81.87 points to 15,601.50.
MSCI’s index of Asia-Pacific stocks outside Japan is decrease 1.76% to 629.09 levels. The Australian index was lower by 0.98% to 7,567.30. Japanese Nikkei Index drop 2.53% today.
European stocks were negative on Friday, with the Stoxx Europe 50 Index decrease 0.83% to 4,895.85, Germany’s DAX drop 1.01% to 17,671.25, and France’s CAC lower 0.74% to 7,964.91 and U.K.’s FTSE 100 loss 0.69% to 7,823.24.
Benchmark 10-year U.S. Treasury rose as demand for safe assets surged again, today 10-year bond yields negative 1.31% to 4.588.
Oil prices slipped in early trade on Friday as US jobs data pointed to higher interest rates for longer and easing tensions in the Middle East dampened supply concerns. The market largely shrugged off sanctions on Venezuela and Iran.
Spot Brent crude oil ascend 0.48% to $87.52 per barrel. US West Texas Intermediate crude is up 0.69% to $83.28 a barrel.
The yellow metal gold is decrease 0.02% to 2,397.60 dollars per ounce.
Market Wrap: Forex
The dollar rose on Thursday as a mixed batch of U.S. data did little to shake views that the economy is still on solid ground, suggesting the Federal Reserve will likely delay the timing of its first interest rate cut since 2020 to later this year.
Today, the U.S. dollar index measures the Greenback against a trade-weighted basket of six major currencies, which drop 0.06% to 105.900.
The Euro US Dollar (EUR/USD) is a widely traded pair that is up 0.09% today. This left the pair trading around $1.0653.
The Japanese yen was negative against the U.S. dollar on Friday. Today USD/JPY is drop 0.11% to the 154.47 level.
Another commodity-related currency negative against the U.S dollar, AUD/USD fell 0.02% to 0.6420, and NZD/USD drop 0.08% to 0.58970 level.
EUR/USD Intraday: Trend on the downside
Our pivot point is at 1.06400
Preferable Price Action: Take sell positions below pivot level with targets at 1.06250 & 1.06140 in extension.
Alternative Price Action: Above pivot looks for a further upside to 1.06550 & 1.06660.
Comment: RSI is below 50 levels and pairs below its 55MA.
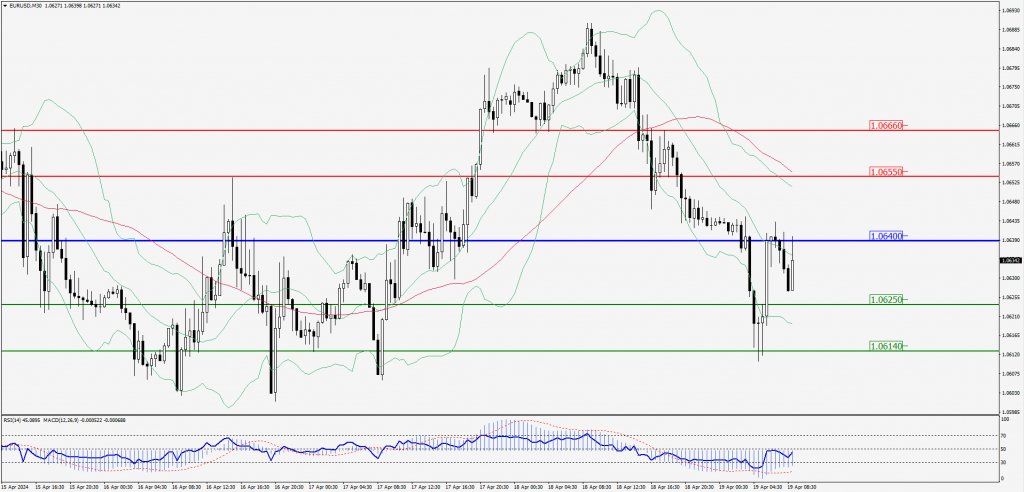
Green Lines Indicate Resistance Levels – Red Lines Indicate Support Levels
Light Blue is a Pivot Point – Black represents the price when the report was produced
GBP/USD Intraday: Trend on the downside
Our pivot point is at 1.24280
Preferable Price Action: Sell positions below pivot with targets at 1.24060 & 1.23910 in extension.
Alternative Price Action: The price above pivot would call for further upside to 1.24500 & 1.24660.
Comment: RSI is below 50 levels and Pairs below its 55MA.
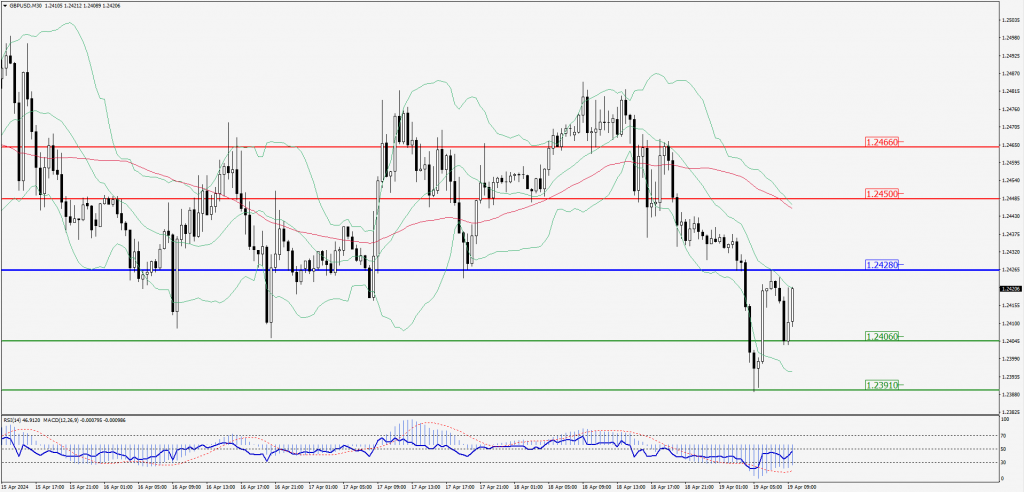
Green Lines Indicate Resistance Levels – Red Lines Indicate Support Levels
Light Blue is a Pivot Point – Black represents the price when the report was produced
USD/JPY Intraday: In a consolidation zone
Our pivot point is at 154.390
Preferable Price Action: Buy position above pivot with the target at 154.580 and 154.720 in extension.
Alternative Price Action: The downside breakout of the pivot would call for 154.220 and 154.080.
Comment: MACD is at 50 levels.
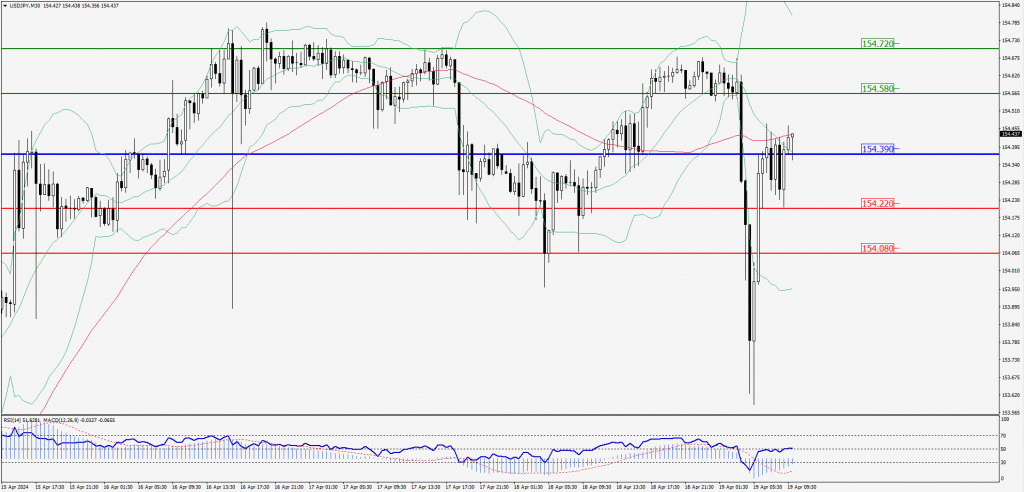
Green Lines Indicate Resistance Levels – Red Lines Indicate Support Levels
Light Blue is a Pivot Point – Black represents the price when the report was produced
AUD/USD Intraday: Trend on the upside
Our pivot point is at 0.64120
Preferable Price Action: Buy positions above pivot with targets at 0.64330 & 0.64490 in extension.
Alternative Price Action: Below pivot looks for a further downside with 0.63910 & 0.63760 as targets.
Comment: RSI is above 50 levels and pairs above its 20MA.
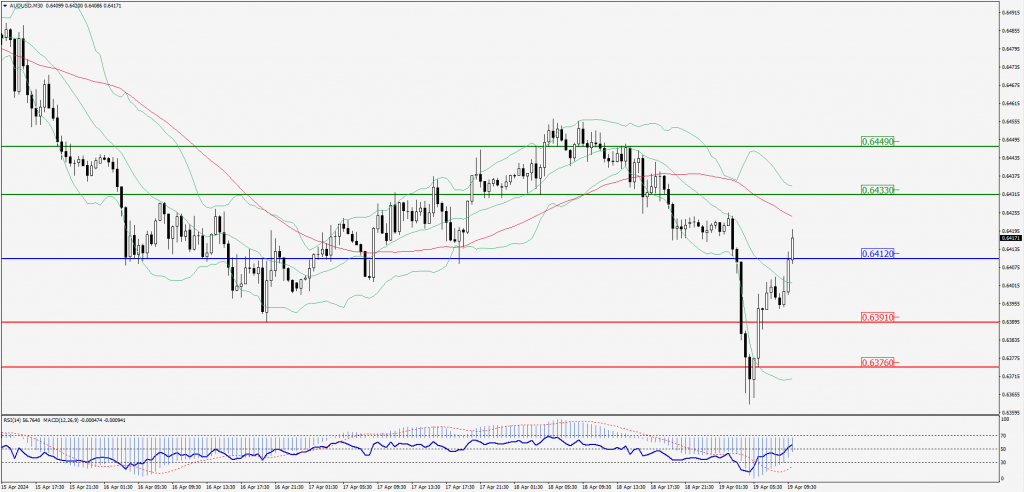
Green Lines Indicate Resistance Levels – Red Lines Indicate Support Levels
Light Blue is a Pivot Point – Black represents the price when the report was produced
CRUDEOIL Intraday: Trend on downside
Our pivot point is at 83.37
Preferable Price Action: Below pivot sell oil with 82.65 & 82.11 as targets.
Alternative Price Action: Buy crude above pivot with targets at 84.12 and 84.63 in extension.
Comment: MACD is negative territory and pairs below its 20MA.
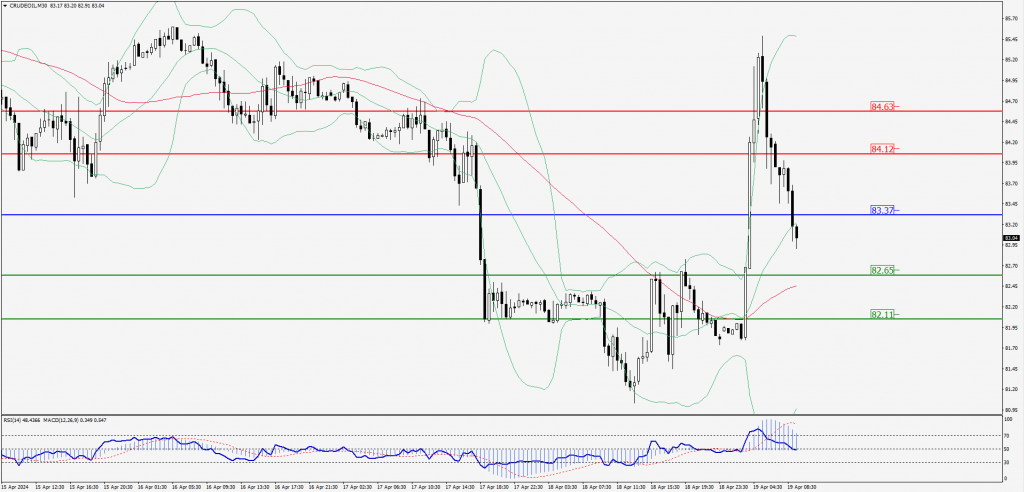
Green Lines Indicate Resistance Levels – Red Lines Indicate Support Levels
Light Blue is a Pivot Point – Black represents the price when the report was produced
XAU/USD Intraday: Support level at 2388.10
Our pivot point is 2388.10
Preferable Price Action: Further upside to 2405.30 and 2418.20.
Alternative Price Action: If the price gives an downside breakout of a pivot, then the price extends to 2370.90 and 2358.00.
Comment: MACD is above 50 levels and pairs above its 55MA.
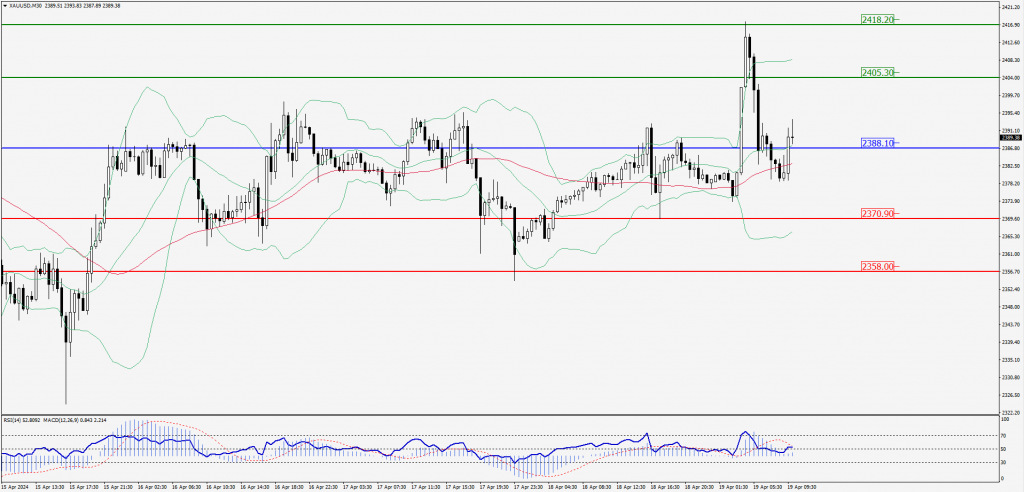
Green Lines Indicate Resistance Levels – Red Lines Indicate Support Levels
Light Blue is a Pivot Point – Black represents the price when the report was produced
Dow Jones Intraday: Trend on the upside
Our pivot point is 37,595.60
Preferable Price Action: Take buy positions above the pivot with targets at 37,754.30 & 37,885.90.
Alternative Price Action: Below 37,595.60 looks for further downside to 37,438.40 & 37,303.60.
Comment: RSI is above 50 levels and Pairs above its 20MA.
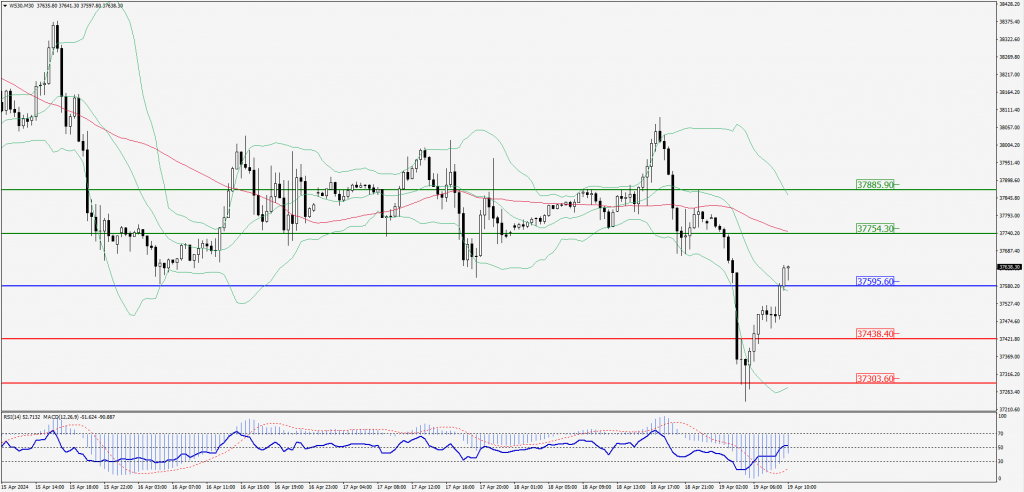
Green Lines Indicate Resistance Levels – Red Lines Indicate Support Levels
Light Blue is a Pivot Point – Black represents the price when the report was produced