Market Wrap: Stocks, Bonds, Commodities
Japanese companies are increasingly hitching their growth plans to the United States, as concerns about Chinese demand and Beijing’s influence over supply chains prompt a noticeable pivot toward the world’s largest economy.
The Dow Jones Industrial Average rose 63.86 points to 37,798.97, the S&P 500 loss 0.21% to 5,051.41 and the Nasdaq Composite descend 19.77 points to 15,865.25.
MSCI’s index of Asia-Pacific stocks outside Japan is increase 0.39% to 636.24 levels. The Australian index was lower by 6.90% to 7,605.60. Japanese Nikkei Index drop 1.22% today.
European stocks were positive on Wednesday, with the Stoxx Europe 50 Index increase 0.60% to 4,946.65, Germany’s DAX surged 0.53% to 17,861.08, and France’s CAC higher 1.15% to 8,023.52 and U.K.’s FTSE 100 gain 0.49% to 7,858.83.
Benchmark 10-year U.S. Treasury rose as demand for safe assets surged again, today 10-year bond yields negative 0.43% to 4.642.
Oil prices extended losses on Wednesday as worries about global demand due to weak economic momentum in China and a likely rise in U.S. commercial stockpiles outweighed supply fears from heightened tensions in the Middle East.
Spot Brent crude oil descend 0.36% to $89.69 per barrel. US West Texas Intermediate crude is down 0.36% to $85.06 a barrel.
The yellow metal gold is decrease 0.03% to 2,407.60 dollars per ounce.
Market Wrap: Forex
The dollar edged down but was still within striking distance of its 5-1/2-month high on Wednesday, keeping the yen rooted near 34-year lows after Federal Reserve officials reiterated interest rates are likely to stay higher for longer.
Today, the U.S. dollar index measures the Greenback against a trade-weighted basket of six major currencies, which drop 0.09% to 105.970.
The Euro US Dollar (EUR/USD) is a widely traded pair that is up 0.20% today. This left the pair trading around $1.0638.
The Japanese yen was negative against the U.S. dollar on Wednesday. Today USD/JPY is drop 0.08% to the 154.57 level.
Another commodity-related currency positive against the U.S dollar, AUD/USD rose 0.33% to 0.64220, and NZD/USD surged 0.45% to 0.59050 level.
EUR/USD Intraday: Trend on the upside
Our pivot point is at 1.06340
Preferable Price Action: Take buy positions above pivot level with targets at 1.06620 & 1.06840 in extension.
Alternative Price Action: Below pivot looks for a further downside to 1.06060 & 1.05860.
Comment: RSI is above 50 levels.
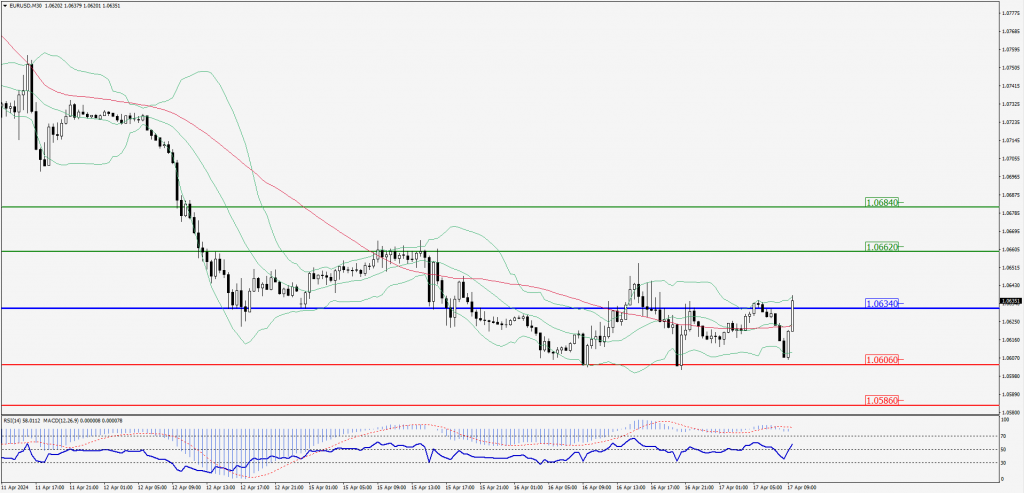
Green Lines Indicate Resistance Levels – Red Lines Indicate Support Levels
Light Blue is a Pivot Point – Black represents the price when the report was produced
GBP/USD Intraday: Trend on the upside
Our pivot point is at 1.24610
Preferable Price Action: Buy positions below pivot with targets at 1.24850 & 1.25050 in extension.
Alternative Price Action: The price below pivot would call for further downside to 1.24360 & 1.24160.
Comment: RSI is above 50 levels and Pairs above its 20MA & 55MA.
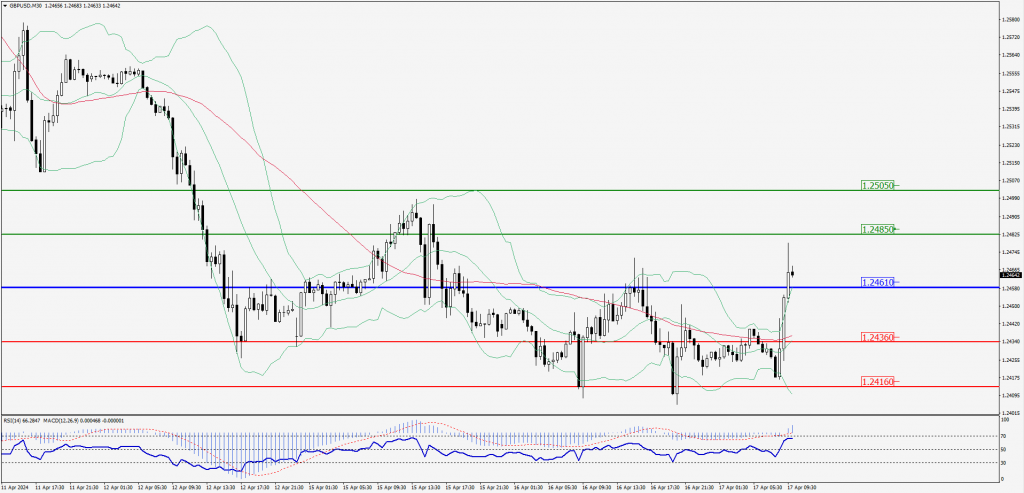
Green Lines Indicate Resistance Levels – Red Lines Indicate Support Levels
Light Blue is a Pivot Point – Black represents the price when the report was produced
USD/JPY Intraday: Resistance level at 154.800
Our pivot point is at 154.800
Preferable Price Action: Sell position below pivot with the target at 154.340 and 153.980 in extension.
Alternative Price Action: The upside breakout of the pivot would call for 155.200 and 155.530.
Comment: MACD is below 50 levels and Pairs below its 20MA & 55MA.
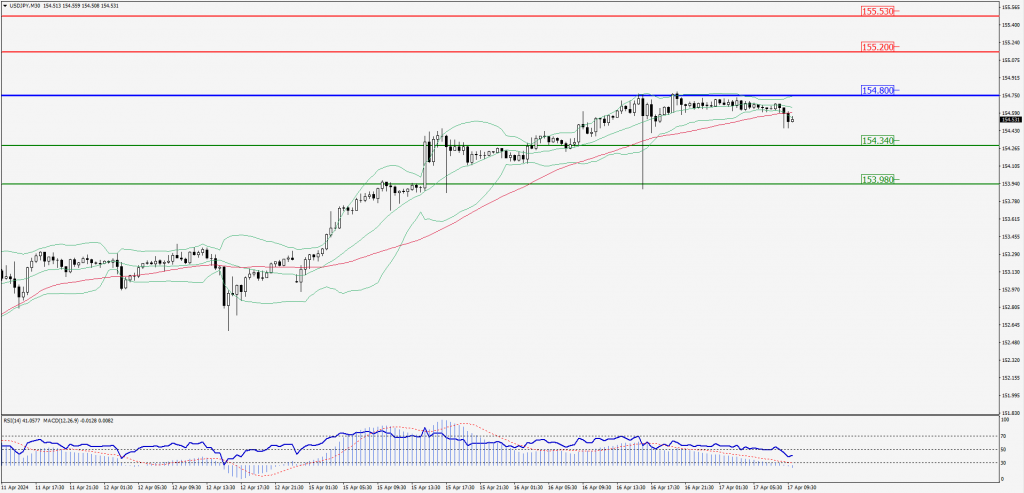
Green Lines Indicate Resistance Levels – Red Lines Indicate Support Levels
Light Blue is a Pivot Point – Black represents the price when the report was produced
AUD/USD Intraday: Trend on the upside
Our pivot point is at 0.64240
Preferable Price Action: Buy positions above pivot with targets at 0.64560 & 0.64830 in extension.
Alternative Price Action: Below pivot looks for a further downside with 0.63920 & 0.63650 as targets.
Comment: RSI is above 50 levels and pairs above its 20MA & 55MA.
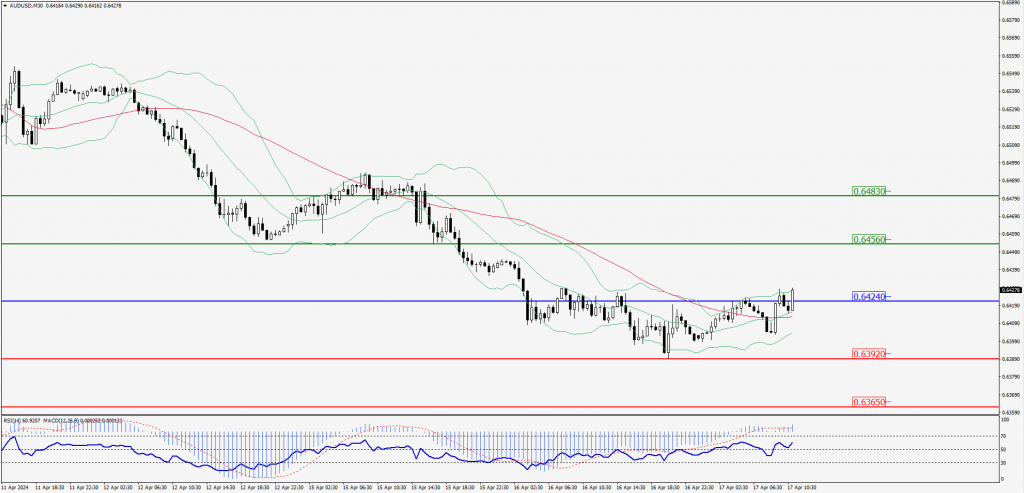
Green Lines Indicate Resistance Levels – Red Lines Indicate Support Levels
Light Blue is a Pivot Point – Black represents the price when the report was produced
CRUDEOIL Intraday: Trend on the downside
Our pivot point is at 84.69
Preferable Price Action: Below pivot sell oil with 84.09 & 83.65 as targets.
Alternative Price Action: Buy crude above pivot with targets at 85.31 and 85.76 in extension.
Comment: MACD is negative territory and pairs below its 55MA.
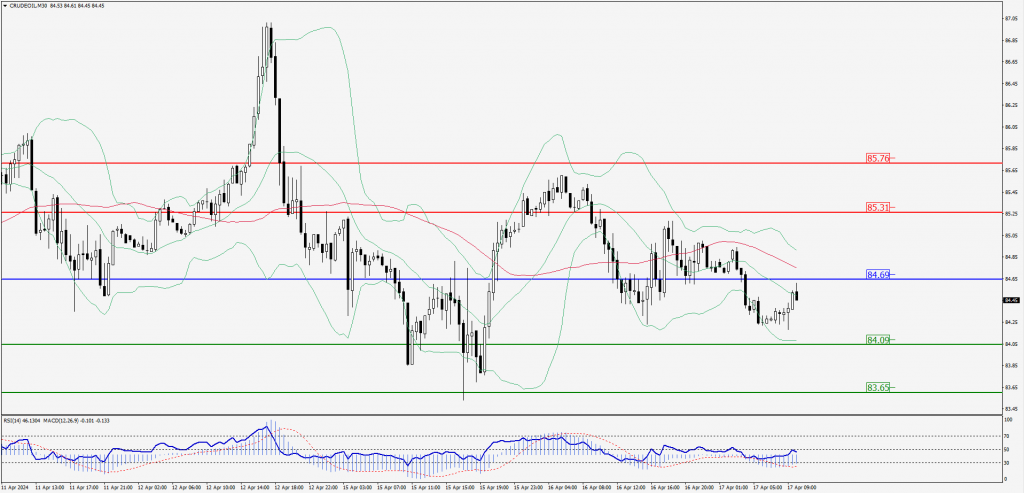
Green Lines Indicate Resistance Levels – Red Lines Indicate Support Levels
Light Blue is a Pivot Point – Black represents the price when the report was produced
XAU/USD Intraday: Trend on the downside
Our pivot point is 2385.10
Preferable Price Action: Further downside to 2367.90 and 2355.20.
Alternative Price Action: If the price gives an upside breakout of a pivot, then the price extends to 2402.70 and 2414.80.
Comment: MACD is below 50 levels and pairs below its 20MA.
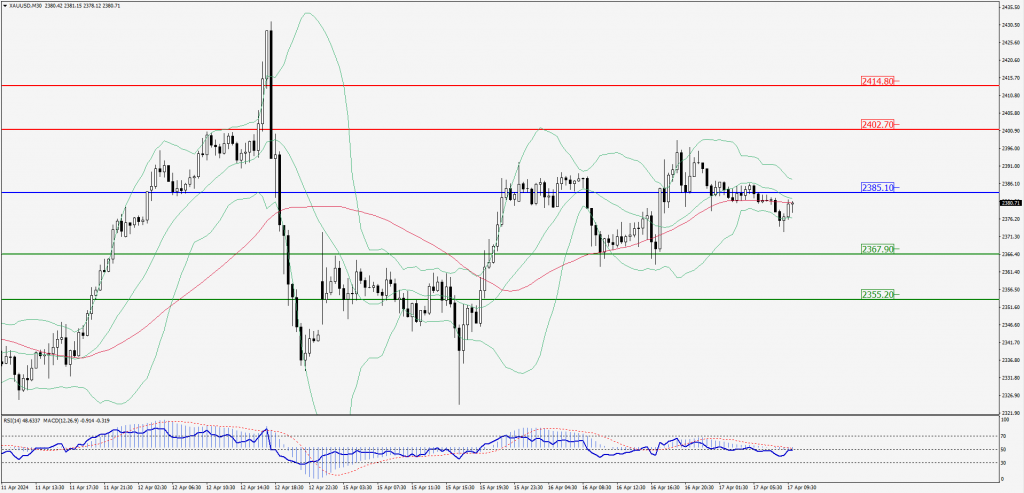
Green Lines Indicate Resistance Levels – Red Lines Indicate Support Levels
Light Blue is a Pivot Point – Black represents the price when the report was produced
Dow Jones Intraday: Trend on the downside
Our pivot point is 37,887.80
Preferable Price Action: Take sell positions below the pivot with targets at 37,721.50 & 37,604.90.
Alternative Price Action: Above 37,887.80 looks for further upside to 38,049.80 & 38,166.40.
Comment: RSI is below 50 levels and Pairs below its 20MA.
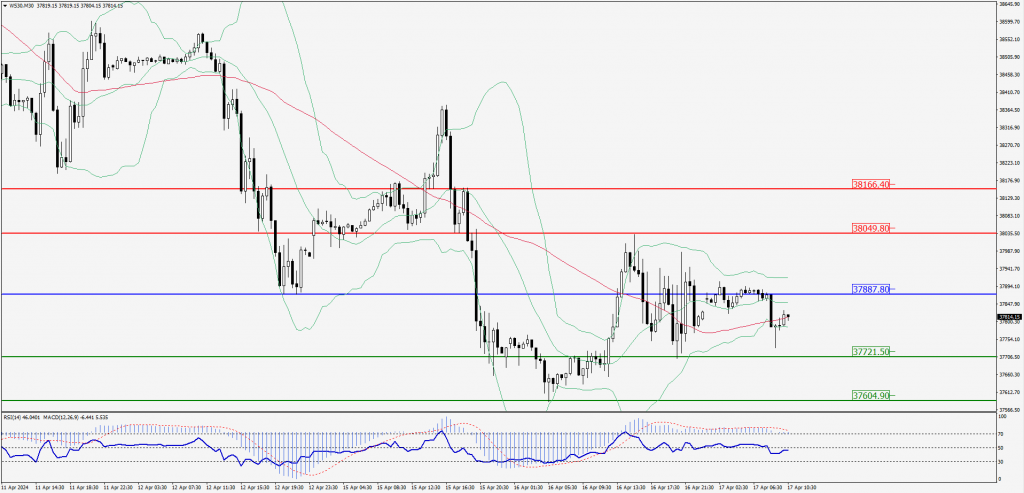
Green Lines Indicate Resistance Levels – Red Lines Indicate Support Levels
Light Blue is a Pivot Point – Black represents the price when the report was produced