Market Wrap: Stocks, Bonds, Commodities
US stocks closed sharply lower on Monday, as an early lift from a strong retail sales report succumbed to a jump in Treasury yields and concerns about rising geopolitical tensions between Iran and Israel.
The Dow Jones Industrial Average fell 248.13 points to 37,735.11, the S&P 500 loss 1.20% to 5,061.82 and the Nasdaq Composite descend 290.08 points to 15,885.02.
MSCI’s index of Asia-Pacific stocks outside Japan is decline 1.96% to 633.96 levels. The Australian index was lower by 1.81% to 7,612.50. Japanese Nikkei Index drop 1.88% today.
European stocks were negative on Tuesday, with the Stoxx Europe 50 Index decrease 1.37% to 4,915.95, Germany’s DAX drop 1.25% to 17,780.05, and France’s CAC lower 1.25% to 7,944.22 and U.K.’s FTSE 100 loss 1.42% to 7,853.03.
Benchmark 10-year U.S. Treasury rose as demand for safe assets surged again, today 10-year bond yields positive 0.15% to 4.6360.
Oil prices rose on Tuesday amid heightened tensions in the Middle East after Israel’s military chief said his country would respond to Iran’s weekend missile and drone attack amid calls for restraint by allies.
Spot Brent crude oil descend 0.13% to $90.01 per barrel. US West Texas Intermediate crude is down 0.16% to $85.31 a barrel.
The yellow metal gold is increase 0.13% to 2,385.75 dollars per ounce.
Market Wrap: Forex
The dollar rose to a five-month high against the pound and euro on Tuesday, a day after stronger-than-expected U.S. retail sales sent Treasury yields higher, raising worries of an intervention from Tokyo as the yen languished at its lowest since 1990.
Today, the U.S. dollar index measures the Greenback against a trade-weighted basket of six major currencies, which surged 0.11% to 106.110.
The Euro US Dollar (EUR/USD) is a widely traded pair that is down 0.05% today. This left the pair trading around $1.06180.
The Japanese yen was positive against the U.S. dollar on Tuesday. Today USD/JPY is surged 0.17% to the 154.520 level.
Another commodity-related currency negative against the U.S dollar, AUD/USD fell 0.43% to 0.64140, and NZD/USD drop 0.25% to 0.58880 level.
EUR/USD Intraday: Trend on the downside
Our pivot point is at 1.06320
Preferable Price Action: Take sell positions below pivot level with targets at 1.05740 & 1.05320 in extension.
Alternative Price Action: Above pivot looks for a further upside to 1.06890 & 1.07340.
Comment: RSI is below 50 levels and Pairs below its 20MA & 55MA.
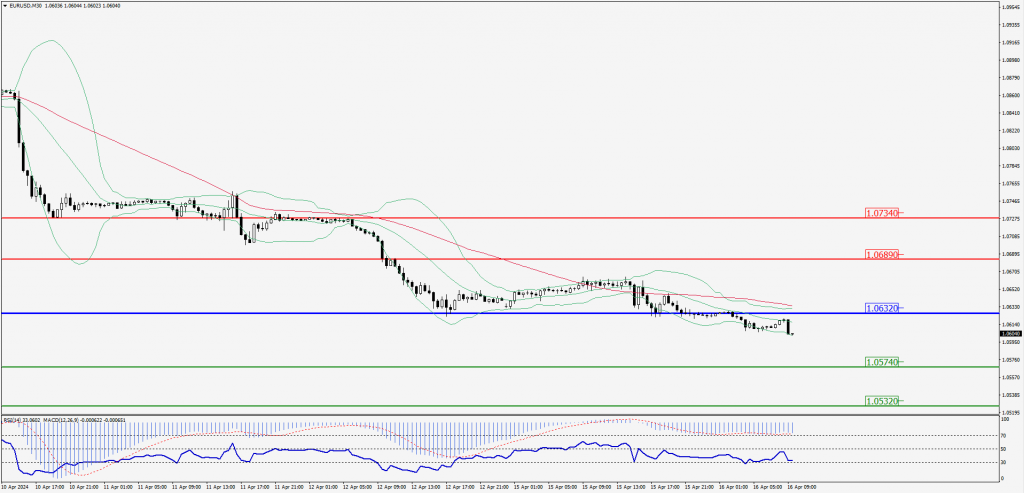
Green Lines Indicate Resistance Levels – Red Lines Indicate Support Levels
Light Blue is a Pivot Point – Black represents the price when the report was produced
GBP/USD Intraday: Trend on the downside
Our pivot point is at 1.24340
Preferable Price Action: Sell positions below pivot with targets at 1.23740 & 1.23270 in extension.
Alternative Price Action: The price above pivot would call for further upside to 1.24980 & 1.25460.
Comment: RSI is below 50 levels and Pairs below 20MA & 55MA.
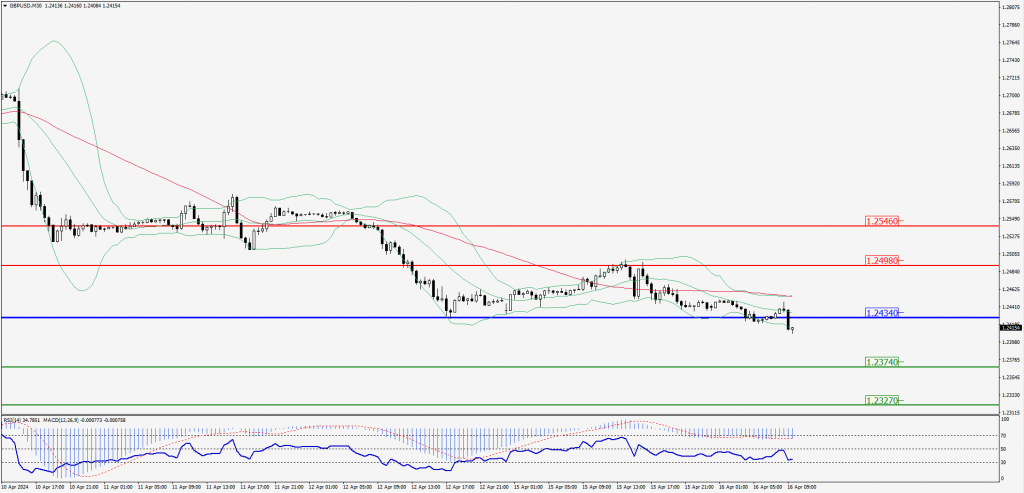
Green Lines Indicate Resistance Levels – Red Lines Indicate Support Levels
Light Blue is a Pivot Point – Black represents the price when the report was produced
USD/JPY Intraday: Major trend on the upside
Our pivot point is at 154.500
Preferable Price Action: Buy position above pivot with the target at 154.990 and 155.370 in extension.
Alternative Price Action: The downside breakout of the pivot would call for 154.010 and 153.590.
Comment: MACD is above 50 levels and Pairs above its 20MA & 55MA.
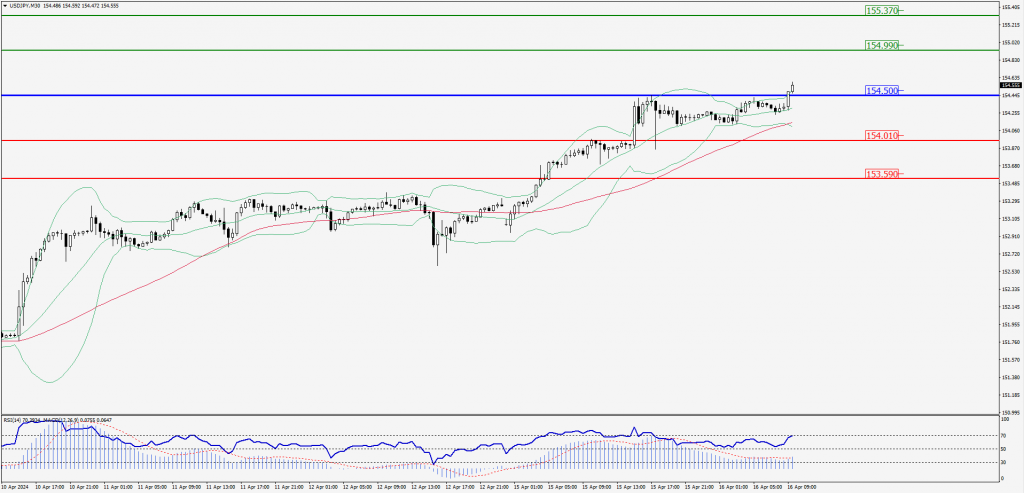
Green Lines Indicate Resistance Levels – Red Lines Indicate Support Levels
Light Blue is a Pivot Point – Black represents the price when the report was produced
AUD/USD Intraday: Trend on the downside
Our pivot point is at 0.64320
Preferable Price Action: Sell positions below pivot with targets at 0.63930 & 0.63670 in extension.
Alternative Price Action: Above pivot looks for a further upside with 0.64710 & 0.64990 as targets.
Comment: RSI is below 50 levels and pairs below its 20MA & 55MA.
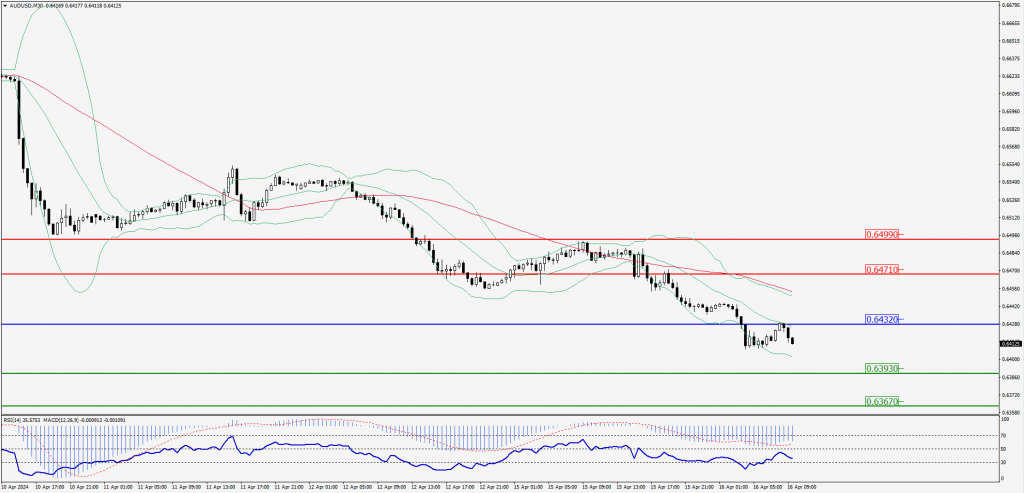
Green Lines Indicate Resistance Levels – Red Lines Indicate Support Levels
Light Blue is a Pivot Point – Black represents the price when the report was produced
CRUDEOIL Intraday: Trend on the downside
Our pivot point is at 85.31
Preferable Price Action: Below pivot sell oil with 84.81 & 84.41 as targets.
Alternative Price Action: Buy crude above pivot with targets at 85.81 and 86.21 in extension.
Comment: MACD is negative territory and pairs below 20MA.
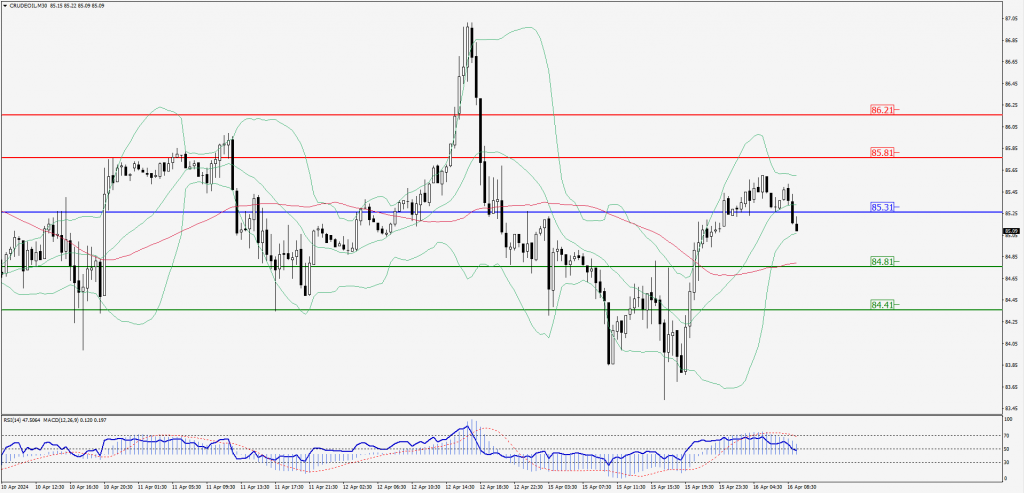
Green Lines Indicate Resistance Levels – Red Lines Indicate Support Levels
Light Blue is a Pivot Point – Black represents the price when the report was produced
XAU/USD Intraday: Trend on the downside
Our pivot point is 2378.40
Preferable Price Action: Further downside to 2364.80 and 2353.30.
Alternative Price Action: If the price gives an upside breakout of a pivot, then the price extends to 2390.70 and 2402.60.
Comment: MACD is below 50 levels and pairs below its 20MA.
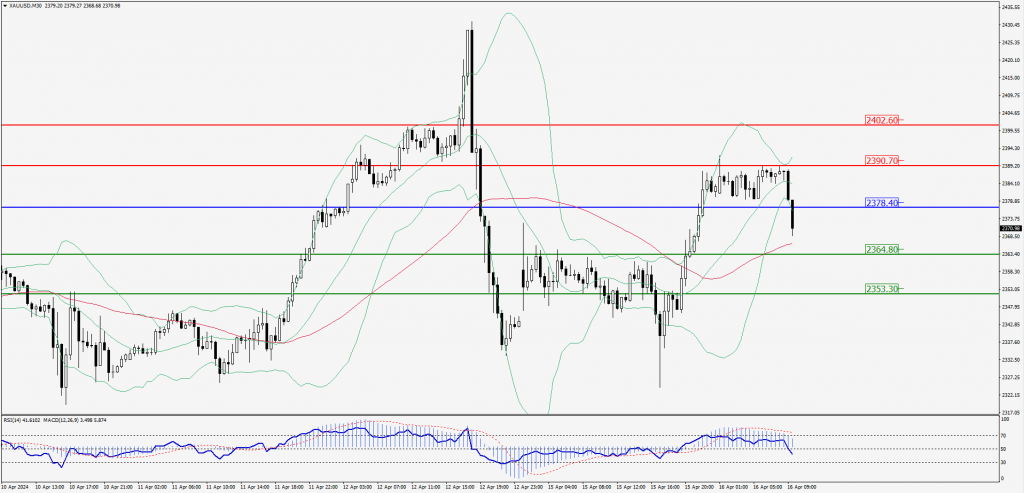
Green Lines Indicate Resistance Levels – Red Lines Indicate Support Levels
Light Blue is a Pivot Point – Black represents the price when the report was produced
Dow Jones Intraday: Trend on the downside
Our pivot point is 37,745.90
Preferable Price Action: Take sell positions below the pivot with targets at 37,510.20 & 37,325.70.
Alternative Price Action: Above 37,745.90 looks for further upside to 37,978.60 & 38,180.20.
Comment: RSI is below 50 levels and Pairs below its 20MA & 55MA.
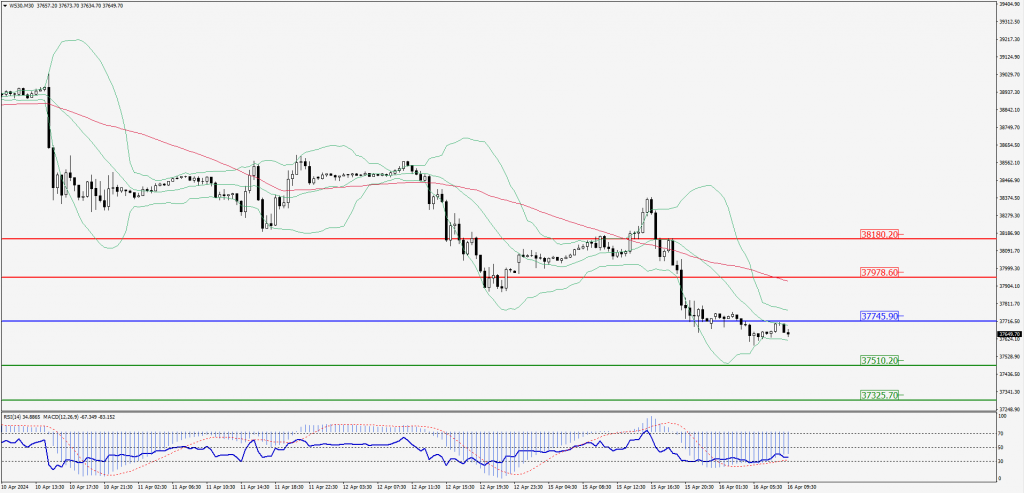
Green Lines Indicate Resistance Levels – Red Lines Indicate Support Levels
Light Blue is a Pivot Point – Black represents the price when the report was produced