Market Wrap: Stocks, Bonds, Commodities
A gauge of global stocks retreated for a second straight session on Monday, easing further from a record high ahead of U.S. inflation data this week which could heavily influence the Federal Reserve’s interest rate path.
The Dow Jones Industrial Average rose 46.97 points to 38,769.66, the S&P 500 lose 0.11% to 5,117.94 and the Nasdaq Composite subtract 65.84 points to 16,019.27.
MSCI’s index of Asia-Pacific stocks outside Japan is advance 1.15% to 662.36 levels. The Australian index was higher by 0.11% to 7,712.50. Japanese Nikkei Index drop 0.05% today.
European stocks were positive on Tuesday, with the Stoxx Europe 50 Index rose 0.19% to 4,939.95, Germany’s DAX ascend 0.16% to 17,783.55, and France’s CAC advance 0.10% to 8027.95 and U.K.’s FTSE 100 add 0.74% to 7,725.99.
Benchmark 10-year U.S. Treasury fell as demand for safe assets ascend again, today 10-year bond yields negative 0.22% to 4.099.
Oil slipped on Monday, with global benchmark Brent dipping below $82 a barrel as concern faded about fighting in the Middle East disrupting supply and softening demand in China also weighed.
Spot Brent crude oil Ascend 0.86% to $82.92 per barrel. US West Texas Intermediate crude is up 0.85% to $78.59 a barrel.
The yellow metal gold is decline 0.27% to 2,182.65 dollars per ounce.
Market Wrap: Forex
The U.S. dollar slipped lower in early European trade Monday, trading near two-month lows ahead of the release of key U.S. inflation data for more clues over the timing of the start of the anticipated Federal Reserve rate-cutting cycle.
Today, the U.S. dollar index measures the Greenback against a trade-weighted basket of six major currencies, which surged 0.03% to 102.489.
The Euro US Dollar (EUR/USD) is a widely traded pair that is up 0.03% today. This left the pair trading around $1.09290.
The Japanese yen was positive against the U.S. dollar on Tuesday. Today USD/JPY is surged 0.33% to the 147.420 level.
Another commodity-related currency negative against the U.S dollar, AUD/USD fell 0.02% to 0.66130, and NZD/USD slipped 0.07% to 0.61620 level.
EUR/USD Intraday: Trend on the upside
Our pivot point is at 1.09330
Preferable Price Action: Take buy positions above pivot level with targets at 1.09490 & 1.09610 in extension.
Alternative Price Action: Below pivot looks for a further downside to 1.09170 & 1.09060.
Comment: RSI is above 50 levels and pairs above its 20AM & 55MA
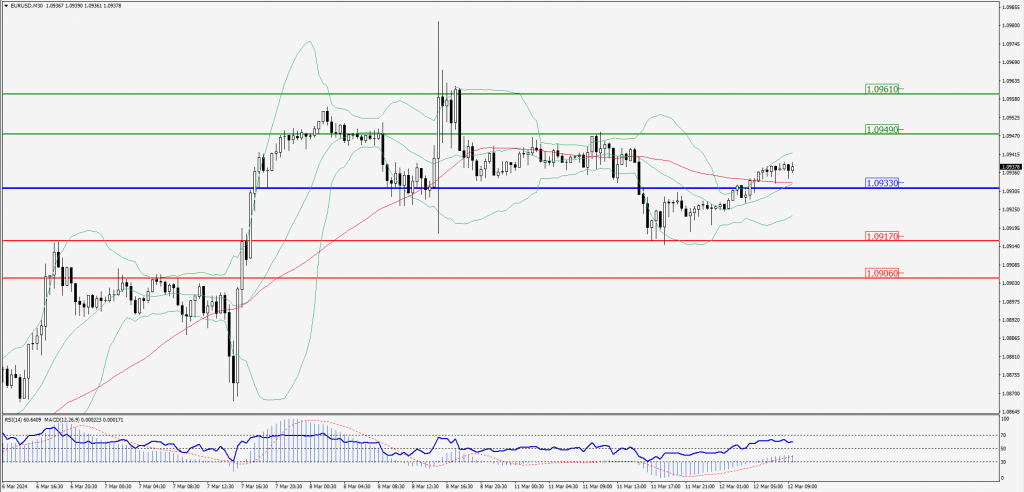
Green Lines Indicate Resistance Levels – Red Lines Indicate Support Levels
Light Blue is a Pivot Point – Black represents the price when the report was produced
GBP/USD Intraday: Trend on the downside
Our pivot point is at 1.28290
Preferable Price Action: Sell positions below pivot with targets at 1.28020 & 1.27820 in extension.
Alternative Price Action: The price above pivot would call for further upside to 1.28570 & 1.28750.
Comment: RSI is below 50 levels and Pairs below 55MA.
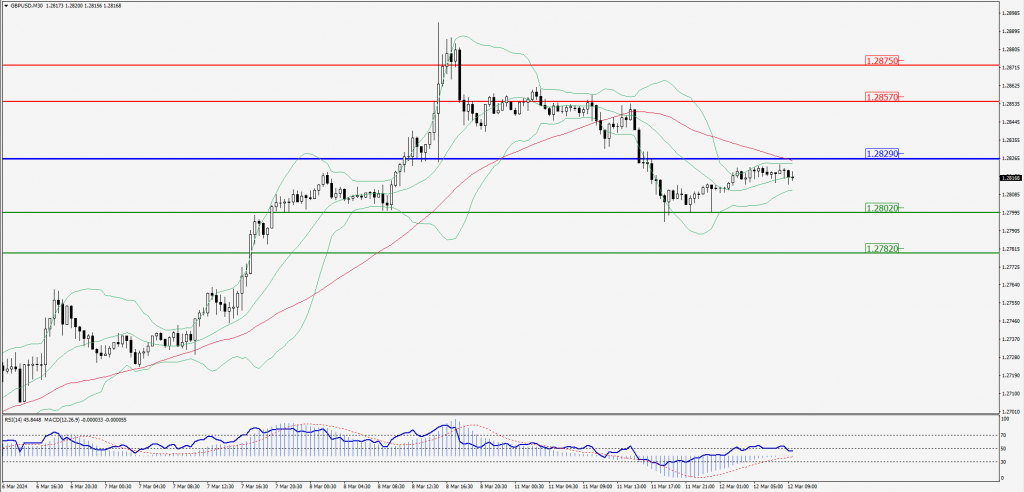
Green Lines Indicate Resistance Levels – Red Lines Indicate Support Levels
Light Blue is a Pivot Point – Black represents the price when the report was produced
USD/JPY Intraday: Trend on the upside
Our pivot point is at 147.290
Preferable Price Action: Buy position above pivot with the target at 147.880 and 148.280 in extension.
Alternative Price Action: The downside breakout of the pivot would call for 146.690 and 146.280.
Comment: MACD is above 50 level and Pairs above its 20MA & 55MA.
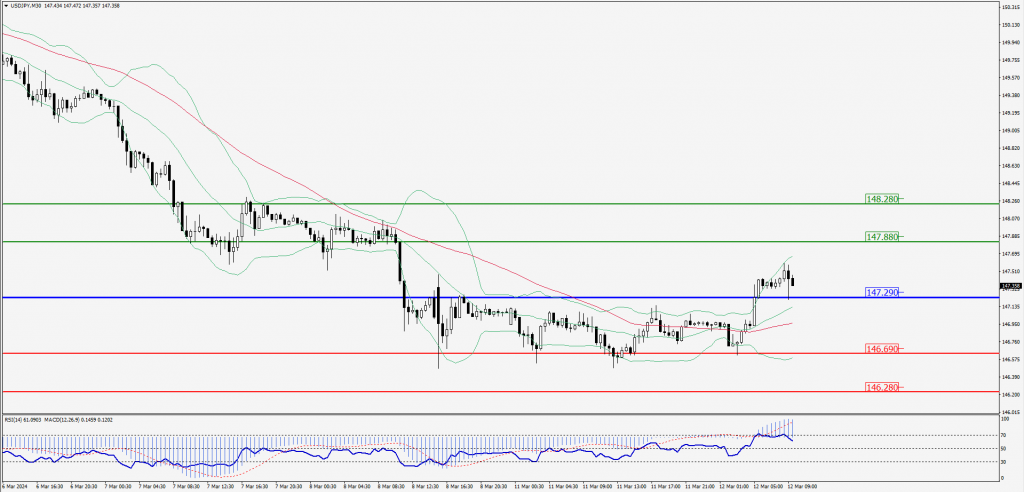
Green Lines Indicate Resistance Levels – Red Lines Indicate Support Levels
Light Blue is a Pivot Point – Black represents the price when the report was produced
AUD/USD Intraday: Support level at 0.66120
Our pivot point is at 0.66120
Preferable Price Action: Buy positions above pivot with targets at 0.66320 & 0.66470 in extension.
Alternative Price Action: Below pivot looks for a further downside with 0.65930 & 0.65780 as targets.
Comment: RSI is above 50 levels.
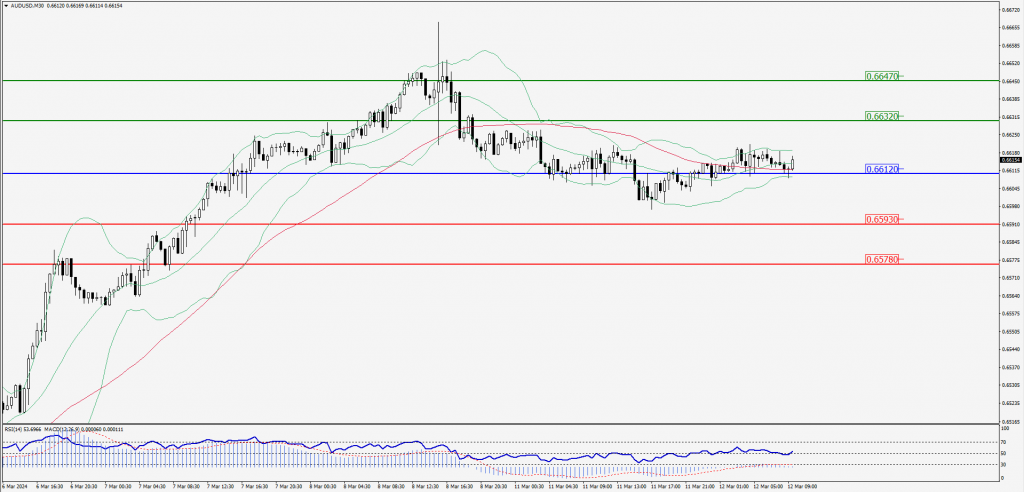
Green Lines Indicate Resistance Levels – Red Lines Indicate Support Levels
Light Blue is a Pivot Point – Black represents the price when the report was produced
CRUDEOIL Intraday: Trend on the upside
Our pivot point is at 77.84
Preferable Price Action: Above pivot buy oil with 78.37 & 78.75 as targets.
Alternative Price Action: Sell crude below pivot with targets at 77.25 and 76.84 in extension.
Comment: MACD is positive territory and Pairs above 55MA.
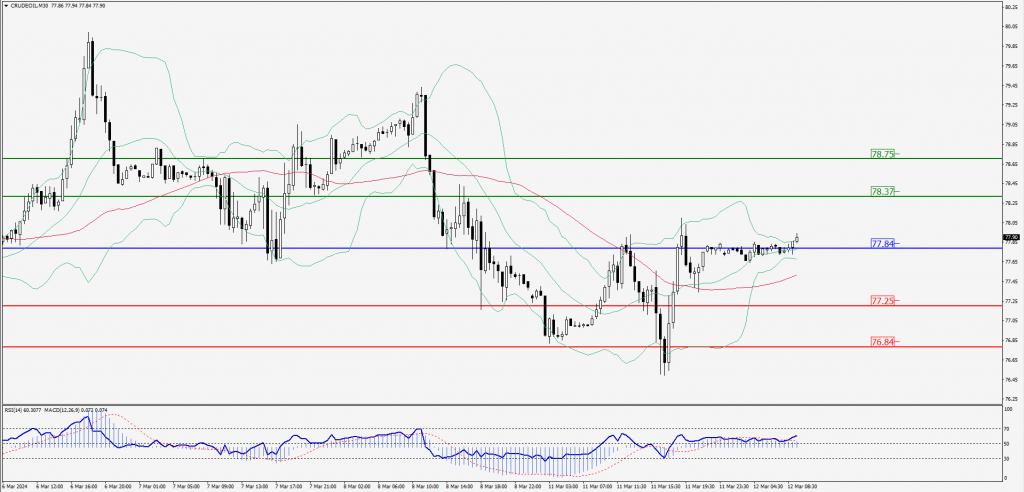
Green Lines Indicate Resistance Levels – Red Lines Indicate Support Levels
Light Blue is a Pivot Point – Black represents the price when the report was produced
XAU/USD Intraday: Trend on the downside
Our pivot point is 2178.70
Preferable Price Action: Further downside to 2168.70 and 2161.10.
Alternative Price Action: If the price gives an upside breakout of a pivot, then the price extends to 2188.70 and 2196.40.
Comment: MACD is above 50 level and Pairs Below its 20MA & 55MA.
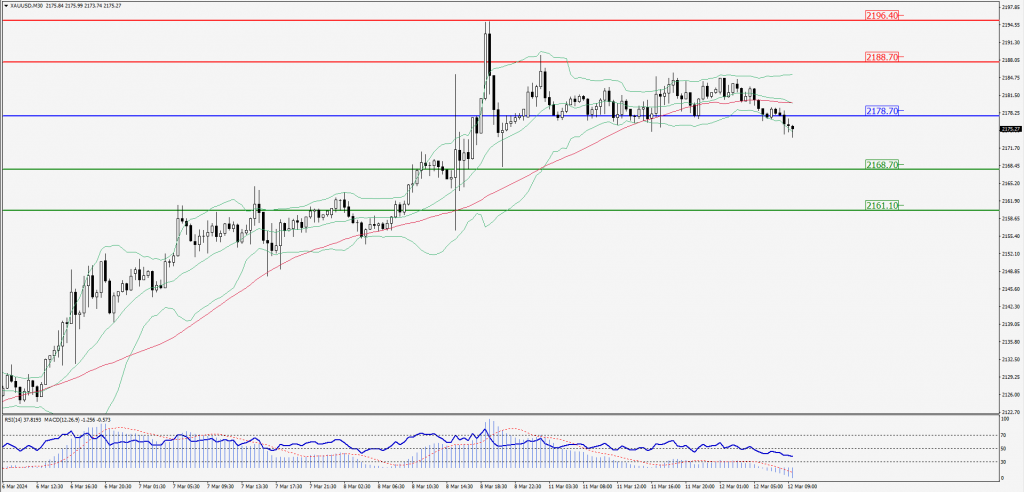
Green Lines Indicate Resistance Levels – Red Lines Indicate Support Levels
Light Blue is a Pivot Point – Black represents the price when the report was produced
Dow Jones Intraday: Trend on the upside
Our pivot point is 38,823.30
Preferable Price Action: Take buy positions above the pivot with targets at 38,888.20 & 38,940.50.
Alternative Price Action: Below 38,823.30 looks for further downside to 38,754.90 & 38,703.60.
Comment: RSI is above 50 levels and Pairs above its 20AM & 55MA.

Green Lines Indicate Resistance Levels – Red Lines Indicate Support Levels
Light Blue is a Pivot Point – Black represents the price when the report was produced