Market Wrap: Stocks, Bonds, Commodities
US stocks ended sharply higher on Tuesday, with the S&P 500 registering a record-high close as Oracle shares surged and consumer price data failed to dampen investors’ hopes of interest rate cuts in the coming months.
The Dow Jones Industrial Average rose 253.83 points to 39,005.49, the S&P 500 gain 1.12% to 5,175.27 and the Nasdaq Composite add 16.90 points to 16,265.64.
MSCI’s index of Asia-Pacific stocks outside Japan is decline 0.38% to 660.09 levels. The Australian index was higher by 0.22% to 7,729.40. Japanese Nikkei Index drop 0.40% today.
European stocks were mixed on Wednesday, with the Stoxx Europe 50 Index rose 1.03% to 4,981.55, Germany’s DAX drop 0.13% to 17,942.45, and France’s CAC advance 0.84% to 8087.48 and U.K.’s FTSE 100 add 1.02% to 7,747.81.
Benchmark 10-year U.S. Treasury fell as demand for safe assets ascend again, today 10-year bond yields negative 0.51% to 4.135.
Oil prices rose on Wednesday on expectations of strong global demand, including in the world’s top consumer the United States, and as even somewhat sticky U.S. inflation did not dent expectations the Fed might start cutting rates soon.
Spot Brent crude oil Ascend 0.38% to $82.22 per barrel. US West Texas Intermediate crude is up 0.39% to $77.87 a barrel.
The yellow metal gold is decline 0.04% to 2,165.25 dollars per ounce.
Market Wrap: Forex
The U.S. dollar edged higher in early European trade Friday, but was still on course for a hefty weekly drop as Federal Reserve Chair Jerome Powell signaled lower interest rates in coming months, while the euro slipped back from recent highs after the European Central Bank meeting.
Today, the U.S. dollar index measures the Greenback against a trade-weighted basket of six major currencies, which surged 0.02% to 102.572.
The Euro US Dollar (EUR/USD) is a widely traded pair that is down 0.01% today. This left the pair trading around $1.09220.
The Japanese yen was negative against the U.S. dollar on Wednesday. Today USD/JPY is slipped 0.04% to the 147.640 level.
Another commodity-related currency positive against the U.S dollar, AUD/USD fell 0.06% to 0.66090, and NZD/USD surged 0.15% to 0.61590 level.
EUR/USD Intraday: Support level at 1.09250
Our pivot point is at 1.09250
Preferable Price Action: Take buy positions above pivot level with targets at 1.09420 & 1.09540 in extension.
Alternative Price Action: Below pivot looks for a further downside to 1.09080 & 1.08950.
Comment: RSI is above 50 levels. 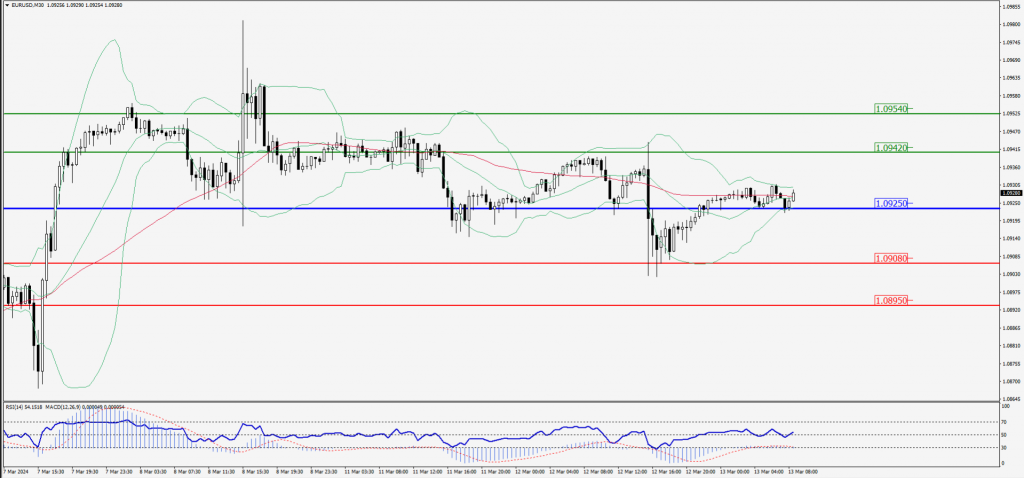
Green Lines Indicate Resistance Levels – Red Lines Indicate Support Levels
Light Blue is a Pivot Point – Black represents the price when the report was produced
GBP/USD Intraday: Resistance level at 1.27970
Our pivot point is at 1.27970
Preferable Price Action: Sell positions below pivot with targets at 1.27740 & 1.27590 in extension.
Alternative Price Action: The price above pivot would call for further upside to 1.28200 & 1.28370.
Comment: RSI is below 50 levels. 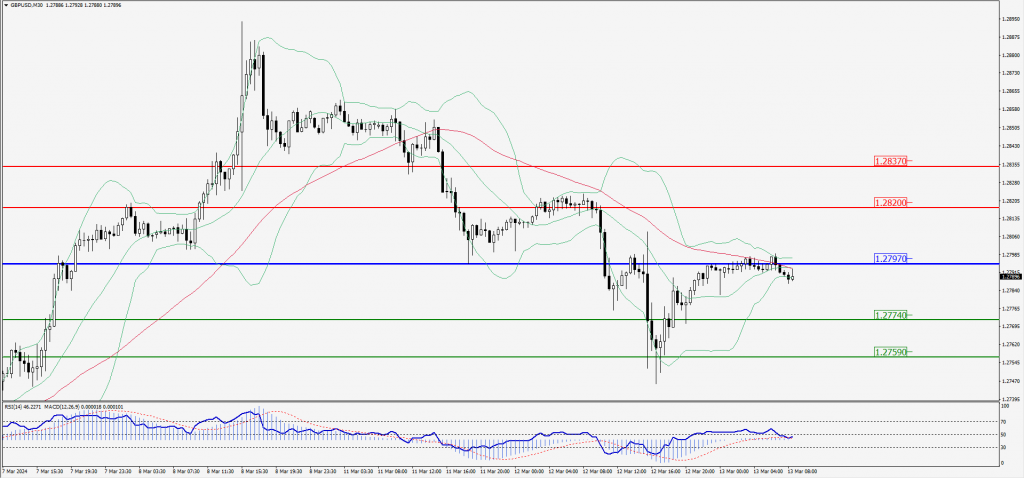
Green Lines Indicate Resistance Levels – Red Lines Indicate Support Levels
Light Blue is a Pivot Point – Black represents the price when the report was produced
USD/JPY Intraday: Trend on the upside
Our pivot point is at 147.430
Preferable Price Action: Buy position above pivot with the target at 147.890 and 148.210 in extension.
Alternative Price Action: The downside breakout of the pivot would call for 146.970 and 146.680.
Comment: MACD is above 50 level.
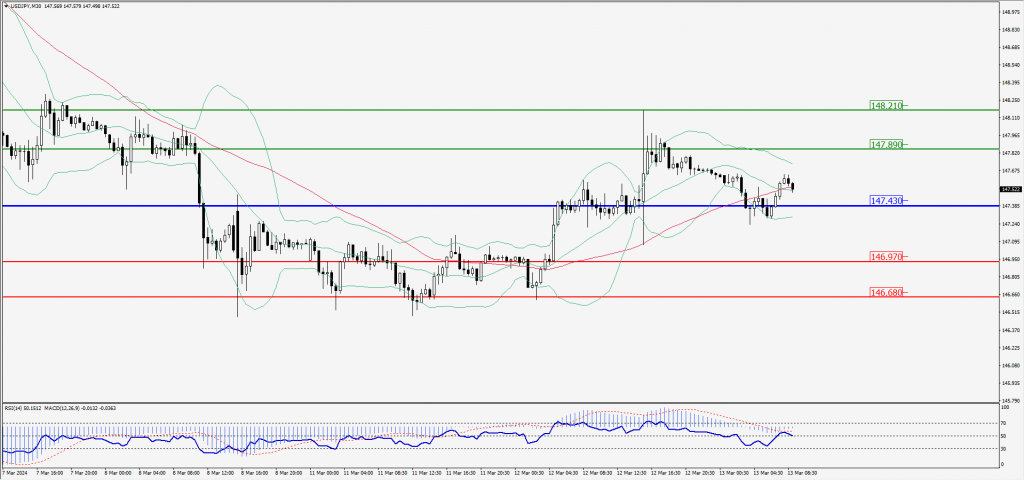
Green Lines Indicate Resistance Levels – Red Lines Indicate Support Levels
Light Blue is a Pivot Point – Black represents the price when the report was produced
AUD/USD Intraday: Trend on the upside
Our pivot point is at 0.66120
Preferable Price Action: Buy positions above pivot with targets at 0.66320 & 0.66470 in extension.
Alternative Price Action: Below pivot looks for a further downside with 0.65930 & 0.65780 as targets.
Comment: RSI is above 50 levels and pairs above its 20MA & 55MA
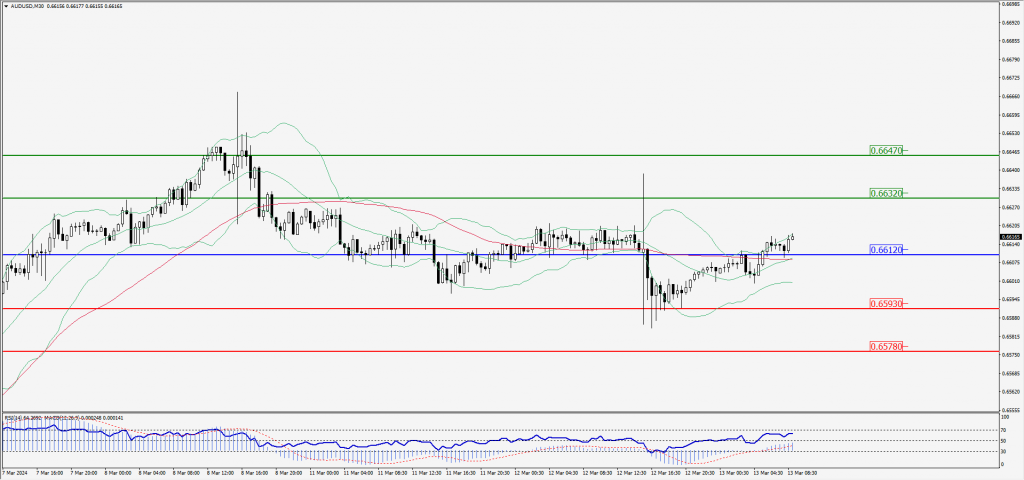
Green Lines Indicate Resistance Levels – Red Lines Indicate Support Levels
Light Blue is a Pivot Point – Black represents the price when the report was produced
CRUDEOIL Intraday: Trend on the upside
Our pivot point is at 77.84
Preferable Price Action: Above pivot buy oil with 78.35 & 78.75 as targets.
Alternative Price Action: Sell crude below pivot with targets at 77.31 and 76.84 in extension.
Comment: MACD is positive territory and Pairs above 20MA.
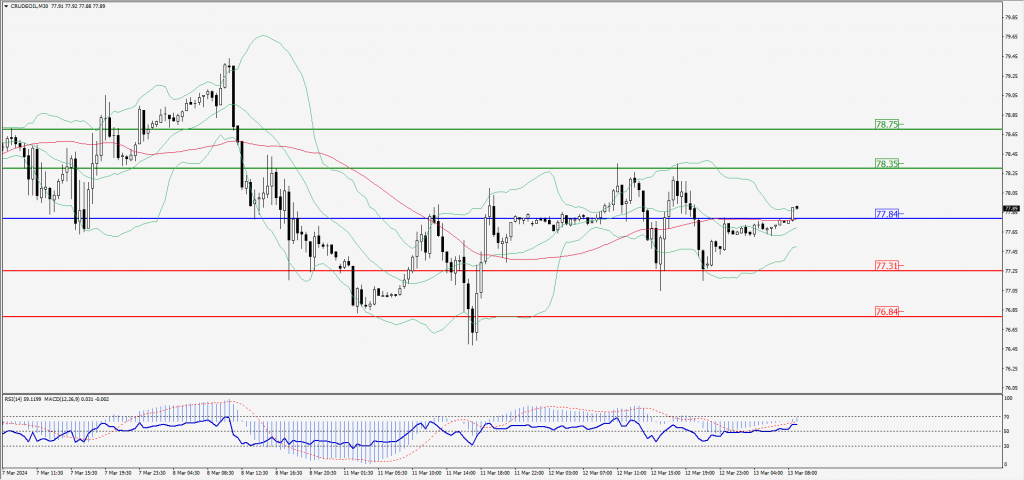
Green Lines Indicate Resistance Levels – Red Lines Indicate Support Levels
Light Blue is a Pivot Point – Black represents the price when the report was produced
XAU/USD Intraday: Trend on the downside
Our pivot point is 2162.80
Preferable Price Action: Further downside to 2152.40 and 2144.40.
Alternative Price Action: If the price gives an upside breakout of a pivot, then the price extends to 2172.40 and 2180.70.
Comment: MACD is below 50 level and Pairs Below 55MA.
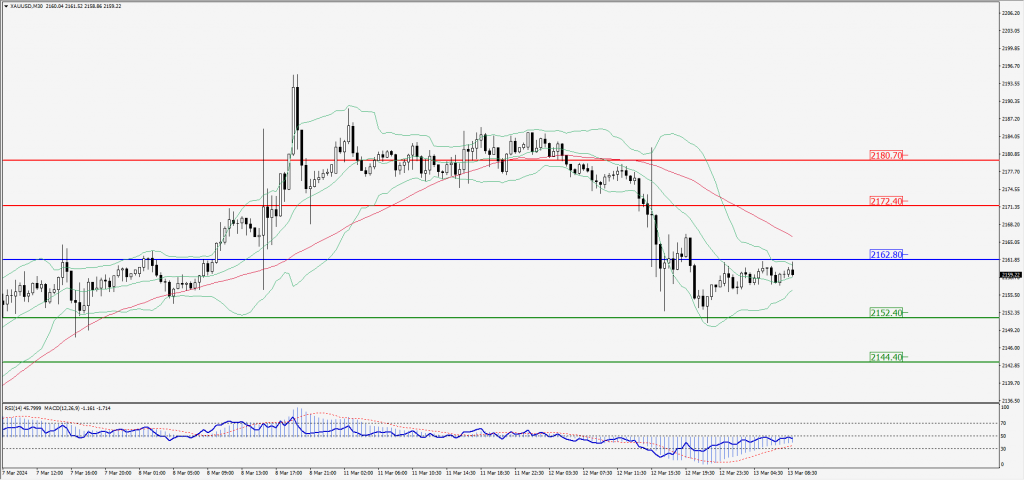
Green Lines Indicate Resistance Levels – Red Lines Indicate Support Levels
Light Blue is a Pivot Point – Black represents the price when the report was produced
Dow Jones Intraday: Trend on the upside
Our pivot point is 38,975.40
Preferable Price Action: Take buy positions above the pivot with targets at 39,060.80 & 39,121.20.
Alternative Price Action: Below 38,975.40 looks for further downside to 38,885.20 & 38,806.60.
Comment: RSI is above 50 levels and Pairs above 55MA.
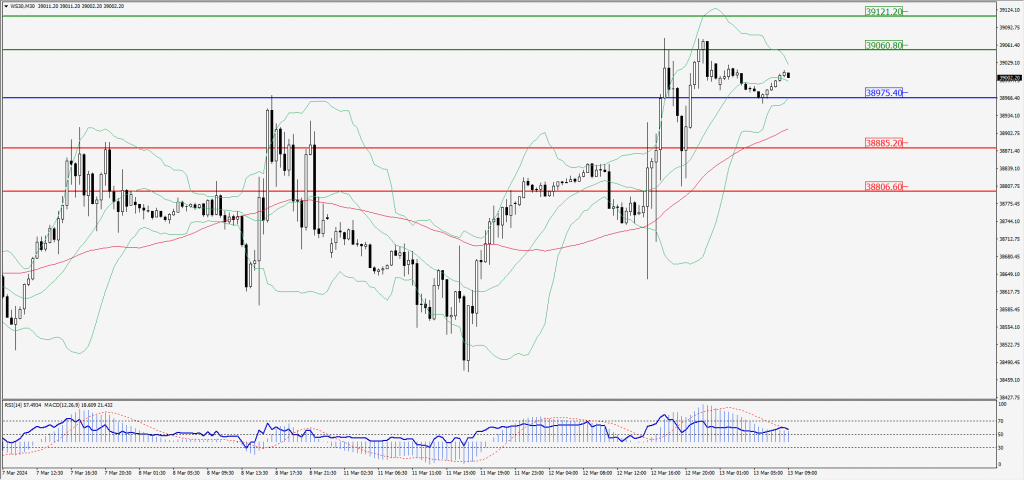
Green Lines Indicate Resistance Levels – Red Lines Indicate Support Levels
Light Blue is a Pivot Point – Black represents the price when the report was produced