Market Wrap: Stocks, Bonds, Commodities
U.S. stocks tumbled in a broad sell-off on Wednesday as Alphabet shares slid after the Google parent posted disappointing earnings and as U.S. Treasury yields rose, reviving fears that interest rates could stay higher for longer.
The Dow Jones Industrial Average fell 105.45 points to 33,035.93, the S&P 500 lose 1.43% to 4,186.77 and the Nasdaq Composite subtract 318.65 points to 12,821.22.
MSCI’s index of Asia-Pacific stocks outside Japan is decline 1.27% to 578.44 levels. The Australian index was lower by 0.61% to 6,812.30. Japanese Nikkei Index drop 2.22% today.
European stocks were negative on Tuesday, with the Stoxx Europe 50 Index fell 1.10% to 4,027.55, Germany’s DAX drop 1.27% to 14,702.35, and France’s CAC decline 0.94% to 6,850.37 and U.K.’s FTSE 100 subtract 0.84% to 7,351.66.
Benchmark 10-year U.S. Treasury fell as demand for safe assets ascend again, today 10-year bond yields negative 0.08% to 4.9520.
Oil prices rose about 2% on Wednesday, buoyed by worries about conflict in the Middle East, but gains were capped by higher U.S. crude inventories and gloomy economic prospects in Europe.
Spot Brent crude oil drop 0.41% to $89.80 per barrel. US West Texas Intermediate crude is down 0.53% to $84.92 a barrel.
The yellow metal gold is advance 0.36% to 2,002.25 dollars per ounce.
Market Wrap: Forex
The dollar rose against a basket of currencies on Tuesday as a slew of fresh economic data highlighted the strength of the U.S. economy relative to the United Kingdom and the European Union.
Today, the U.S. dollar index measures the Greenback against a trade-weighted basket of six major currencies, which surged 0.21% to 106.570.
The Euro US Dollar (EUR/USD) is a widely traded pair that is down 0.17% today. This left the pair trading around $1.05470.
The Japanese yen was negative against the U.S. dollar on Tuesday. Today USD/JPY is surged 0.11% to the 150.370 level.
Another commodity-related currency positive against the U.S dollar, AUD/USD rose 0.02% to 0.63100, and NZD/USD surged 0.05% to 0.58050 level.
EUR/USD Intraday: Trend on the downside
Our pivot point is at 1.05580
Preferable Price Action: Take sell positions below pivot level with targets at 1.05180 & 1.04940 in extension.
Alternative Price Action: Above pivot looks for a further upside to 1.05940 & 1.06200.
Comment: RSI is below 50 levels and Pairs below its 20MA & 55MA.
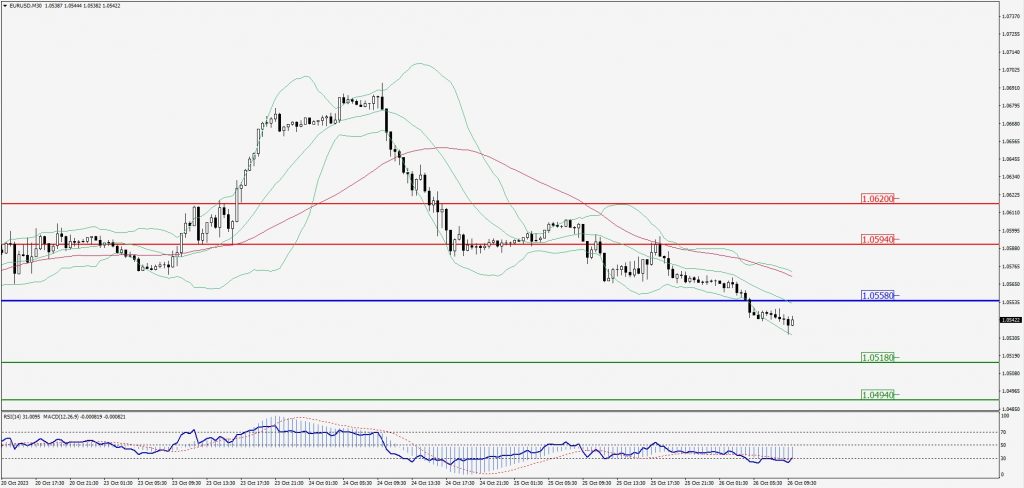
Green Lines Indicate Resistance Levels – Red Lines Indicate Support Levels
Light Blue is a Pivot Point – Black represents the price when the report was produced
GBP/USD Intraday: Trend on the downside
Our pivot point is at 1.21070
Preferable Price Action: Sell positions below pivot with targets at 1.20500 & 1.20150 in extension.
Alternative Price Action: The price above pivot would call for further upside to 1.21610 & 1.22010.
Comment: RSI is below 50 levels and Pairs below its 20MA & 55MA.
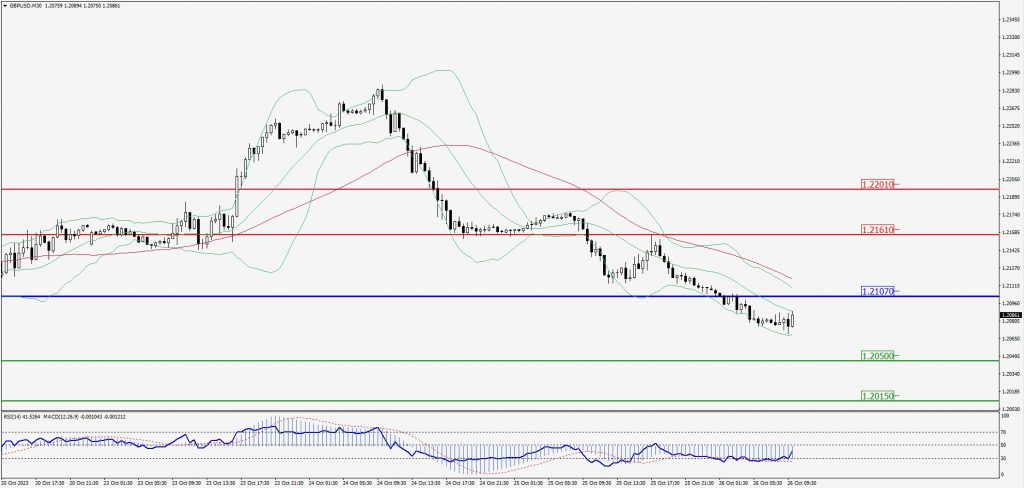
Green Lines Indicate Resistance Levels – Red Lines Indicate Support Levels
Light Blue is a Pivot Point – Black represents the price when the report was produced
USD/JPY Intraday: Major trend on the upside
Our pivot point is at 150.470
Preferable Price Action: Buy position above pivot with the target at 150.770 and 150.990 in extension.
Alternative Price Action: The downside breakout of the pivot would call for 150.230 and 150.040.
Comment: MACD is above 50 level and Pairs above its 20MA & 55MA.
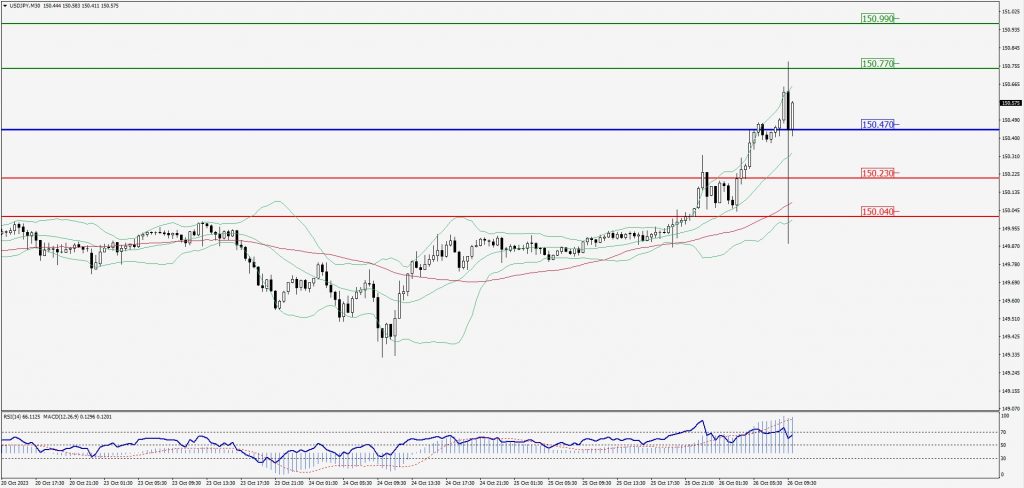
Green Lines Indicate Resistance Levels – Red Lines Indicate Support Levels
Light Blue is a Pivot Point – Black represents the price when the report was produced
AUD/USD Intraday: In a consolidation zone
Our pivot point is at 0.63070
Preferable Price Action: Sell positions below pivot with targets at 0.62780 & 0.62600 in extension.
Alternative Price Action: Above pivot looks for a further upside with 0.63330 & 0.63520 as targets.
Comment: RSI is at 50 levels and Pairs below 55MA.
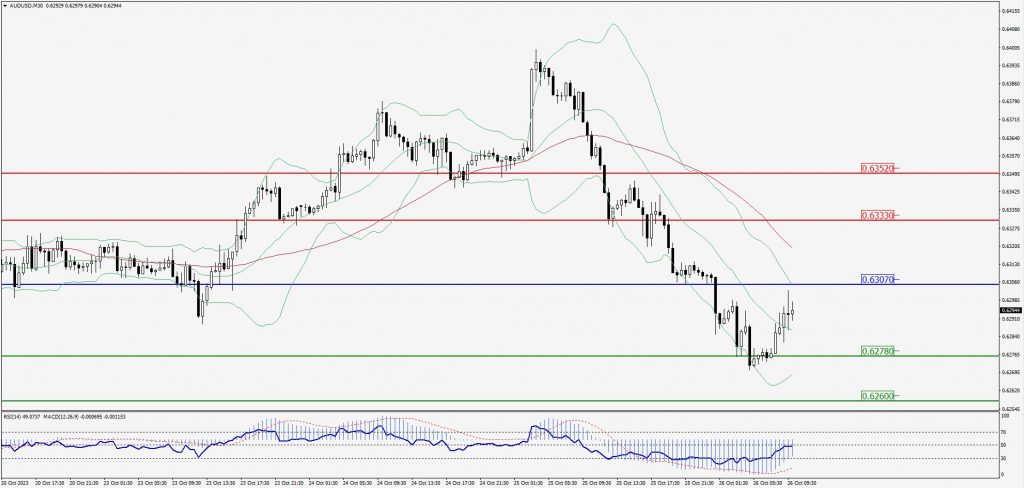
Green Lines Indicate Resistance Levels – Red Lines Indicate Support Levels
Light Blue is a Pivot Point – Black represents the price when the report was produced
CRUDEOIL Intraday: Support level at 84.43
Our pivot point is at 84.43
Preferable Price Action: Above pivot buy oil with 85.82 & 86.77 as targets.
Alternative Price Action: Sell crude below pivot with targets at 83.14 and 82.14 in extension.
Comment: MACD is positive territory and Pairs above 55MA.
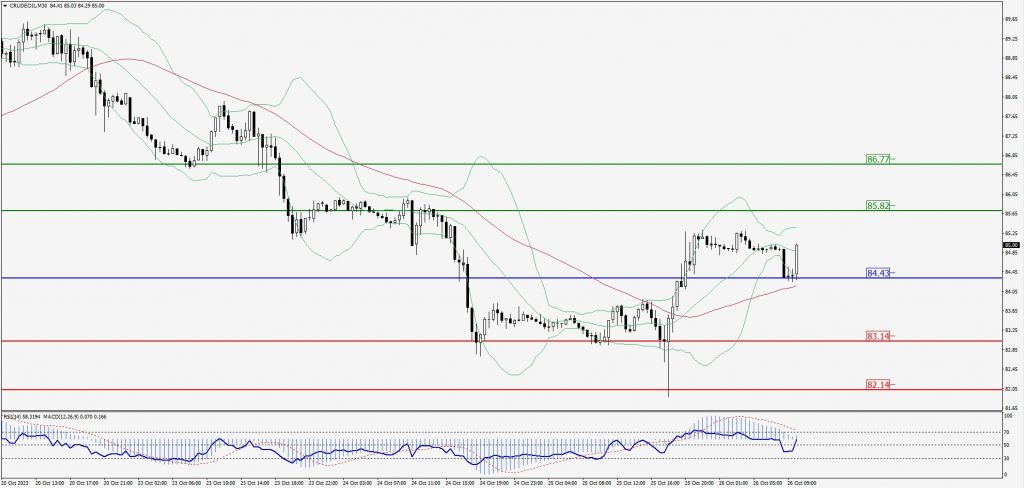
Green Lines Indicate Resistance Levels – Red Lines Indicate Support Levels
Light Blue is a Pivot Point – Black represents the price when the report was produced
XAU/USD Intraday: Trend on the upside
Our pivot point is 1985.20
Preferable Price Action: Further upside to 1996.60 and 2004.90.
Alternative Price Action: If the price gives a downside breakout of a pivot, then the price extends to 1975.30 and 1968.30.
Comment: MACD is above 50 level and Pairs above 55MA.
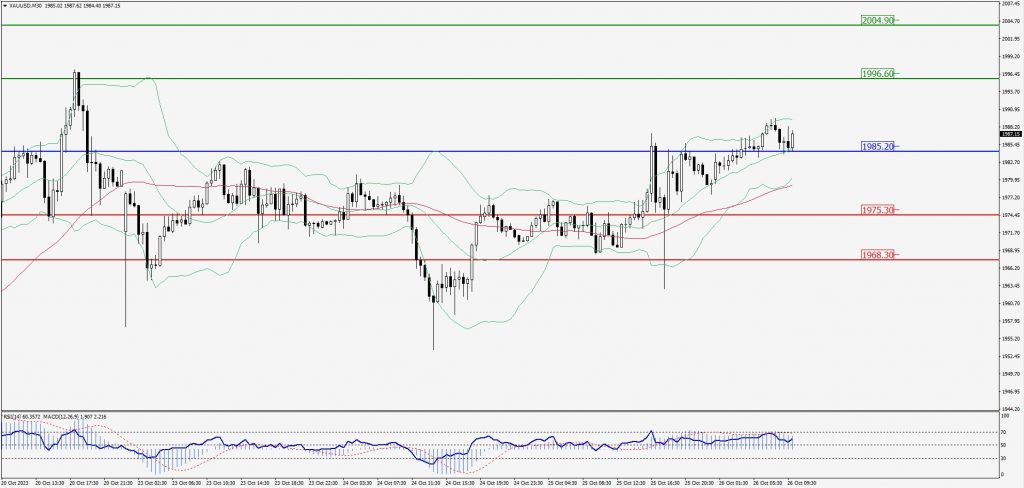
Green Lines Indicate Resistance Levels – Red Lines Indicate Support Levels
Light Blue is a Pivot Point – Black represents the price when the report was produced
Dow Jones Intraday: Trend on the downside
Our pivot point is 32,972.00
Preferable Price Action: Take sell positions below the pivot with targets at 32,826.00 & 32,743.00.
Alternative Price Action: Above 32,972.00 looks for further upside to 33,096.00 & 33,192.00.
Comment: RSI is below 50 levels and Pairs below its 20MA & 55MA.
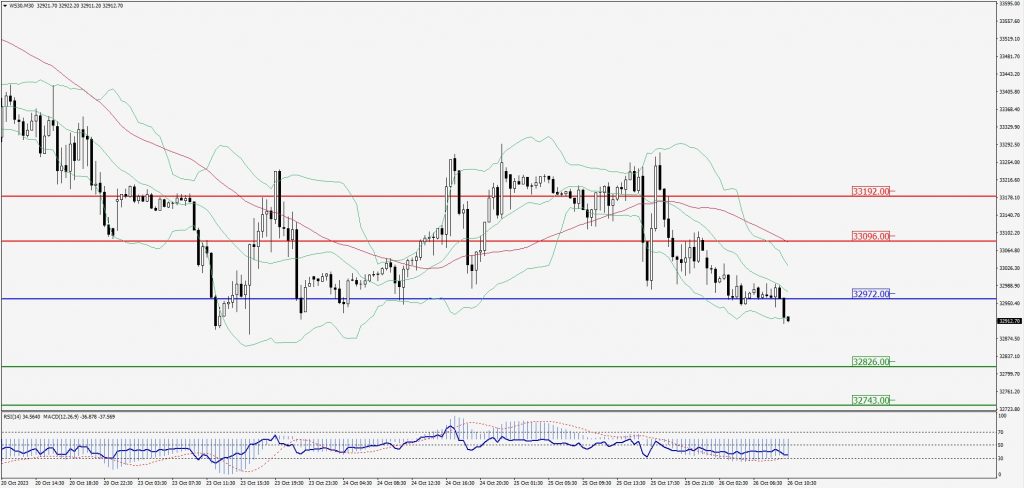
Green Lines Indicate Resistance Levels – Red Lines Indicate Support Levels
Light Blue is a Pivot Point – Black represents the price when the report was produced