Market Wrap: Stocks, Bonds, Commodities
U.S. stocks tumbled on Thursday, dragged by tech and tech-adjacent megacap shares as investors digested mixed quarterly earnings and signs of economic resiliency that could encourage the Federal Reserve to keep interest rates at a restrictive level longer than expected.
The Dow Jones Industrial Average fell 251.63 points to 32,784.30, the S&P 500 lose 1.18% to 4,137.23 and the Nasdaq Composite subtract 225.62 points to 12,595.61.
MSCI’s index of Asia-Pacific stocks outside Japan is advance 1.14% to 584.74 levels. The Australian index was higher by 0.21% to 6,826.90. Japanese Nikkei Index ascend 1.38% today.
European stocks were mixed on Friday, with the Stoxx Europe 50 Index rose 0.17% to 4,056.35, Germany’s DAX ascend 0.56% to 14,811.35, and France’s CAC decline 0.40% to 6,861.31 and U.K.’s FTSE 100 add 0.31% to 7,376.69.
Benchmark 10-year U.S. Treasury fell as demand for safe assets ascend again, today 10-year bond yields positive 0.60% to 4.8750.
Oil prices rose on Friday, regaining ground after tumbling more than $2 a barrel in the previous session as concerns of a wider Middle East conflict eased while the United States, the world’s biggest oil consumer, showed signs of weakening demand.
Spot Brent crude oil ascend 1.92% to $89.63 per barrel. US West Texas Intermediate crude is up 1.91% to $84.80 a barrel.
The yellow metal gold is decline 0.05% to 1,996.35 dollars per ounce.
Market Wrap: Forex
The dollar rose against a basket of currencies on Tuesday as a slew of fresh economic data highlighted the strength of the U.S. economy relative to the United Kingdom and the European Union.
Today, the U.S. dollar index measures the Greenback against a trade-weighted basket of six major currencies, which slipped 0.01% to 106.410.
The Euro US Dollar (EUR/USD) is a widely traded pair that is up 0.01% today. This left the pair trading around $1.05620.
The Japanese yen was negative against the U.S. dollar on Friday. Today USD/JPY is slipped 0.18% to the 150.110 level.
Another commodity-related currency positive against the U.S dollar, AUD/USD rose 0.45% to 0.63500, and NZD/USD surged 0.10% to 0.58260 level.
EUR/USD Intraday: In a consolidation zone
Our pivot point is at 1.05700
Preferable Price Action: Take sell positions below pivot level with targets at 1.05240 & 1.04980 in extension.
Alternative Price Action: Above pivot looks for a further upside to 1.06090 & 1.06380.
Comment: RSI is below 50 levels and Pairs below 20MA.
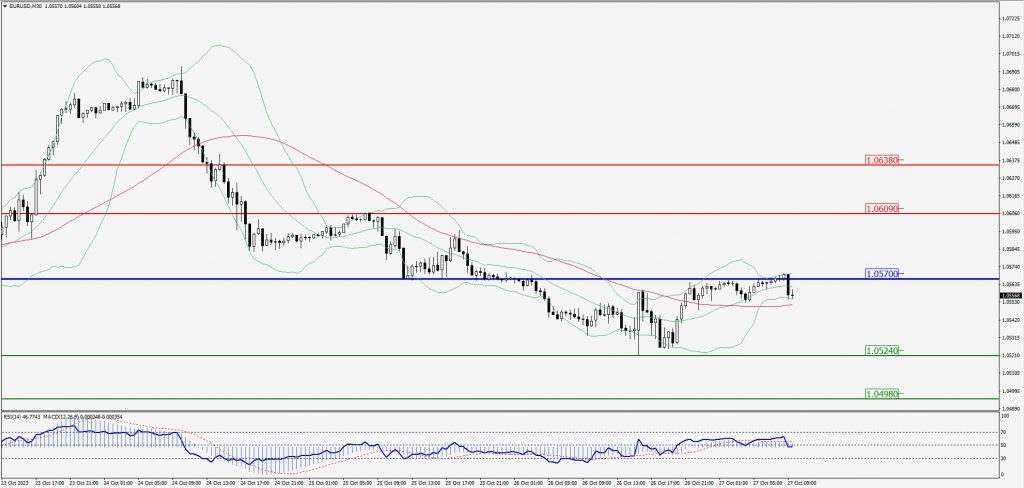
Green Lines Indicate Resistance Levels – Red Lines Indicate Support Levels
Light Blue is a Pivot Point – Black represents the price when the report was produced
GBP/USD Intraday: Trend on the downside
Our pivot point is at 1.21400
Preferable Price Action: Sell positions below pivot with targets at 1.20980 & 1.20730 in extension.
Alternative Price Action: The price above pivot would call for further upside to 1.21740 & 1.22000.
Comment: RSI is below 50 levels and Pairs below 20MA.
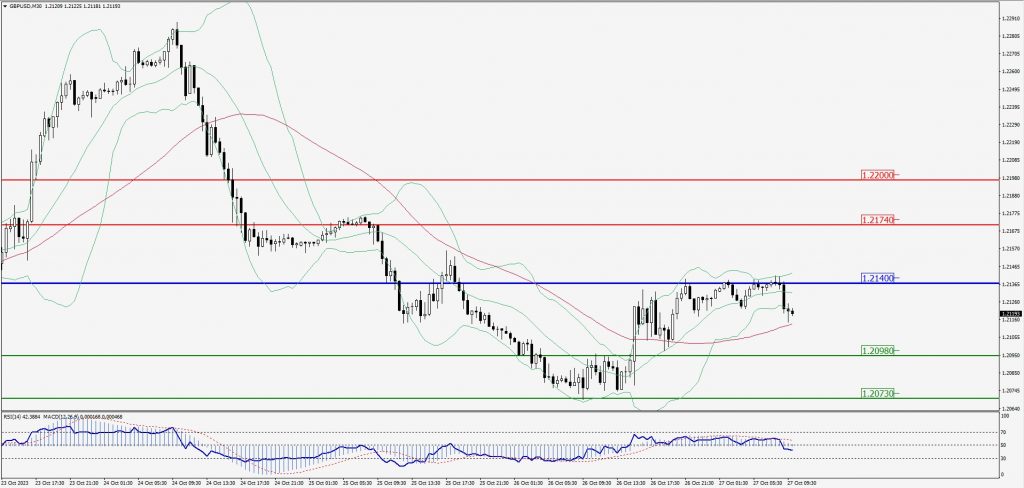
Green Lines Indicate Resistance Levels – Red Lines Indicate Support Levels
Light Blue is a Pivot Point – Black represents the price when the report was produced
USD/JPY Intraday: Trend on the downside
Our pivot point is at 150.320
Preferable Price Action: Sell position below pivot with the target at 150.030 and 149.860 in extension.
Alternative Price Action: The upside breakout of the pivot would call for 150.550 and 150.740.
Comment: MACD is below 50 level and Pairs below its 20MA & 55MA.
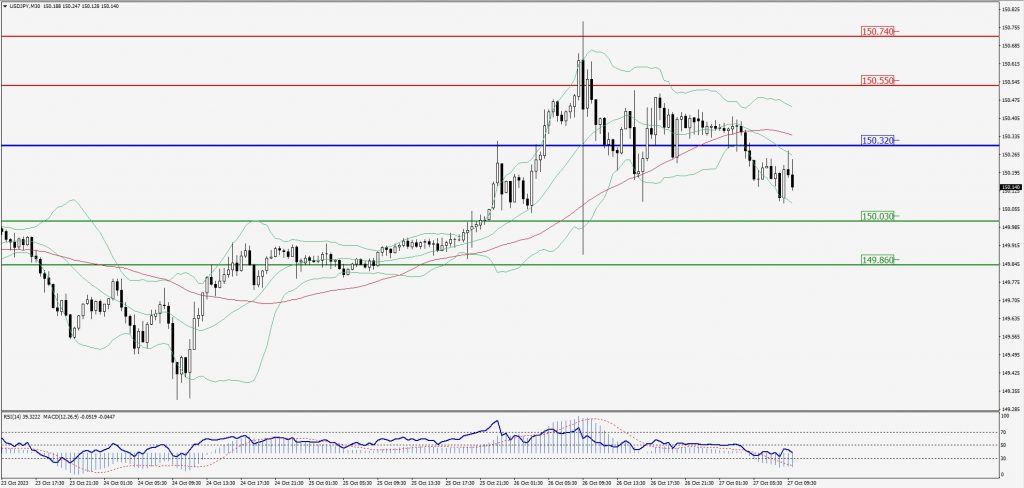
Green Lines Indicate Resistance Levels – Red Lines Indicate Support Levels
Light Blue is a Pivot Point – Black represents the price when the report was produced
AUD/USD Intraday: Trend on the upside
Our pivot point is at 0.63300
Preferable Price Action: Buy positions above pivot with targets at 0.63570 & 0.63750 in extension.
Alternative Price Action: Below pivot looks for a further downside with 0.63070 & 0.62920 as targets.
Comment: RSI is above 50 levels and Pairs above 55MA.
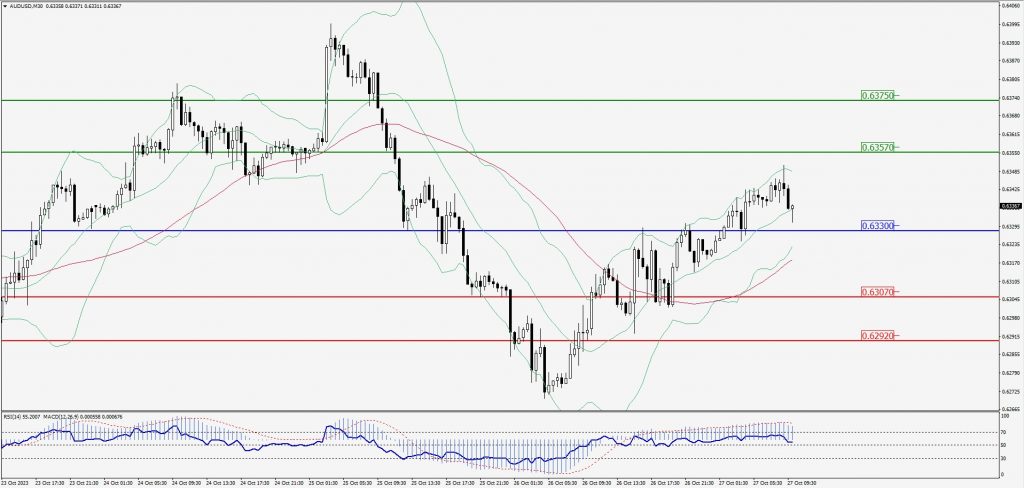
Green Lines Indicate Resistance Levels – Red Lines Indicate Support Levels
Light Blue is a Pivot Point – Black represents the price when the report was produced
CRUDEOIL Intraday: Trend on the upside
Our pivot point is at 84.04
Preferable Price Action: Above pivot buy oil with 85.16 & 86.04 as targets.
Alternative Price Action: Sell crude below pivot with targets at 82.95 and 82.19 in extension.
Comment: MACD is positive territory and Pairs above its 20MA & 55MA.
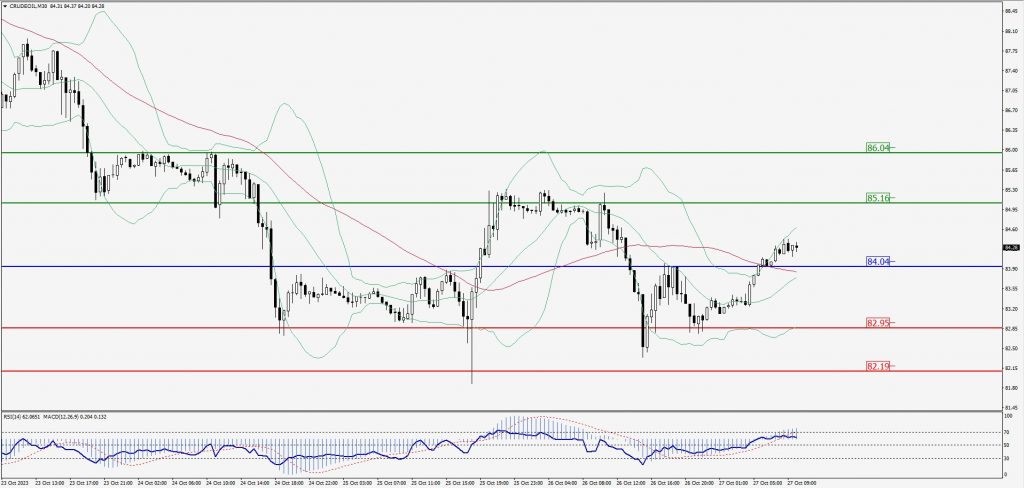
Green Lines Indicate Resistance Levels – Red Lines Indicate Support Levels
Light Blue is a Pivot Point – Black represents the price when the report was produced
XAU/USD Intraday: Trend on the upside
Our pivot point is 1985.40
Preferable Price Action: Further upside to 1992.80 and 1998.40.
Alternative Price Action: If the price gives a downside breakout of a pivot, then the price extends to 1979.30 and 1974.90.
Comment: MACD is above 50 level and Pairs above 55MA.
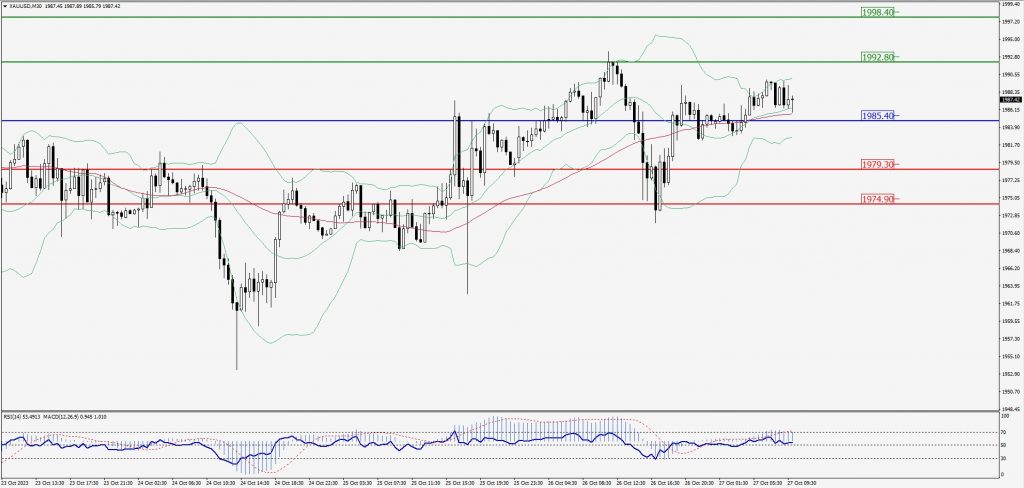
Green Lines Indicate Resistance Levels – Red Lines Indicate Support Levels
Light Blue is a Pivot Point – Black represents the price when the report was produced
Dow Jones Intraday: Trend on the downside
Our pivot point is 32,870.00
Preferable Price Action: Take sell positions below the pivot with targets at 32,730.00 & 32,638.00.
Alternative Price Action: Above 32,870.00 looks for further upside to 32,987.00 & 33,071.00.
Comment: RSI is below 50 levels and Pairs below its 20MA & 55MA.
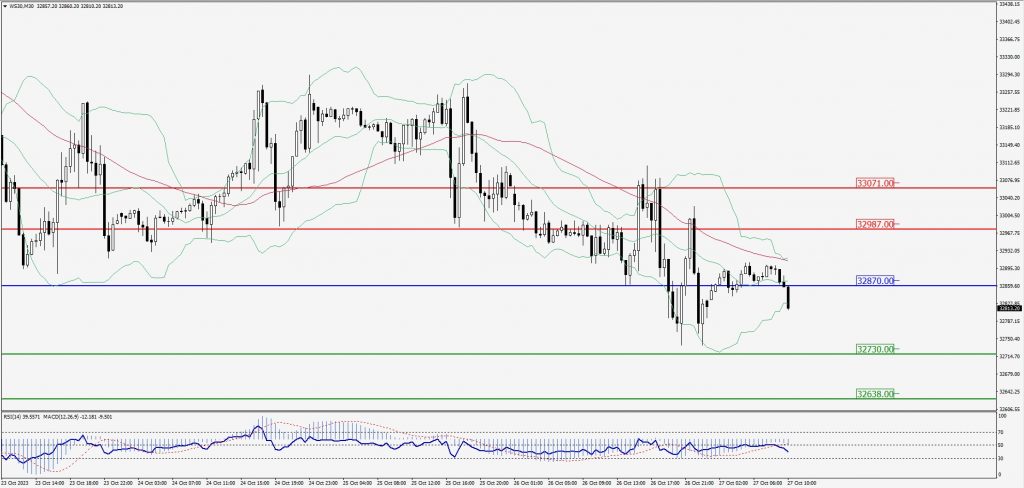
Green Lines Indicate Resistance Levels – Red Lines Indicate Support Levels
Light Blue is a Pivot Point – Black represents the price when the report was produced