Market Wrap: Stocks, Bonds, Commodities
Wall Street ended higher on Tuesday as a spate of solid corporate earnings and upbeat forecasts stoked investor risk appetite and sparked a broad rally.
The Dow Jones Industrial Average rose 204.97 points to 33,141.38, the S&P 500 gain 0.73% to 4,247.68 and the Nasdaq Composite add 121.55 points to 13,139.88.
MSCI’s index of Asia-Pacific stocks outside Japan is advance 0.10% to 586.44 levels. The Australian index was lower by 0.04% to 6,854.30. Japanese Nikkei Index ascend 0.60% today.
European stocks were mixed on Wednesday, with the Stoxx Europe 50 Index fell 0.19% to 4,057.75, Germany’s DAX drop 0.12% to 14,862.75, and France’s CAC decline 0.20% to 6,879.97 and U.K.’s FTSE 100 add 0.07% to 7,394.76.
Benchmark 10-year U.S. Treasury fell as demand for safe assets ascend again, today 10-year bond yields positive 0.45% to 4.8620.
Oil prices were nearly flat on Wednesday as signs of tighter U.S. supplies countered economic data that dampened the outlook for energy demand.
Spot Brent crude oil ascend 0.30% to $88.35 per barrel. US West Texas Intermediate crude is up 0.17% to $83.89 a barrel.
The yellow metal gold is decline 0.22% to 1,981.75 dollars per ounce.
Market Wrap: Forex
The dollar was on the front foot on Wednesday, drawing support from yet another resilient US economic data reading, while the euro struggled to make headway on the back of a darkening growth outlook in the bloc.
Today, the U.S. dollar index measures the Greenback against a trade-weighted basket of six major currencies, which surged 0.21% to 106.300.
The Euro US Dollar (EUR/USD) is a widely traded pair that is down 0.18% today. This left the pair trading around $1.05690.
The Japanese yen was negative against the U.S. dollar on Wednesday. Today USD/JPY is surged 0.01% to the 149.930 level.
Another commodity-related currency negative against the U.S dollar, AUD/USD fell 0.20% to 0.63420, and NZD/USD slipped 0.24% to 0.58280 level.
EUR/USD Intraday: Trend on the downside
Our pivot point is at 1.06070
Preferable Price Action: Take sell positions below pivot level with targets at 1.05550 & 1.05270 in extension.
Alternative Price Action: Above pivot looks for a further upside to 1.06500 & 1.06790.
Comment: RSI is below 50 levels and Pairs below its 20MA & 55MA.
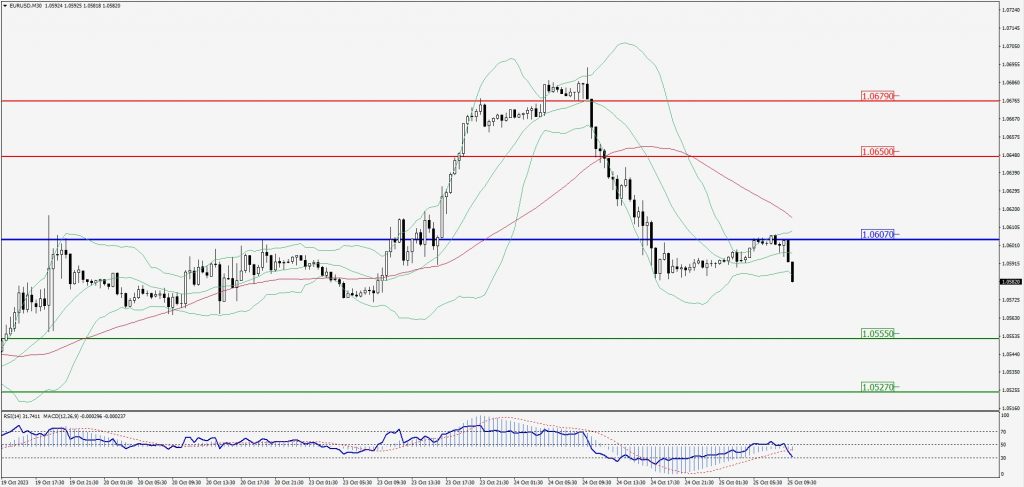
Green Lines Indicate Resistance Levels – Red Lines Indicate Support Levels
Light Blue is a Pivot Point – Black represents the price when the report was produced
GBP/USD Intraday: Major trend on the downside
Our pivot point is at 1.21670
Preferable Price Action: Sell positions below pivot with targets at 1.21210 & 1.20930 in extension.
Alternative Price Action: The price above pivot would call for further upside to 1.22070 & 1.22350.
Comment: RSI is below 50 levels and Pairs below its 20MA & 55MA.
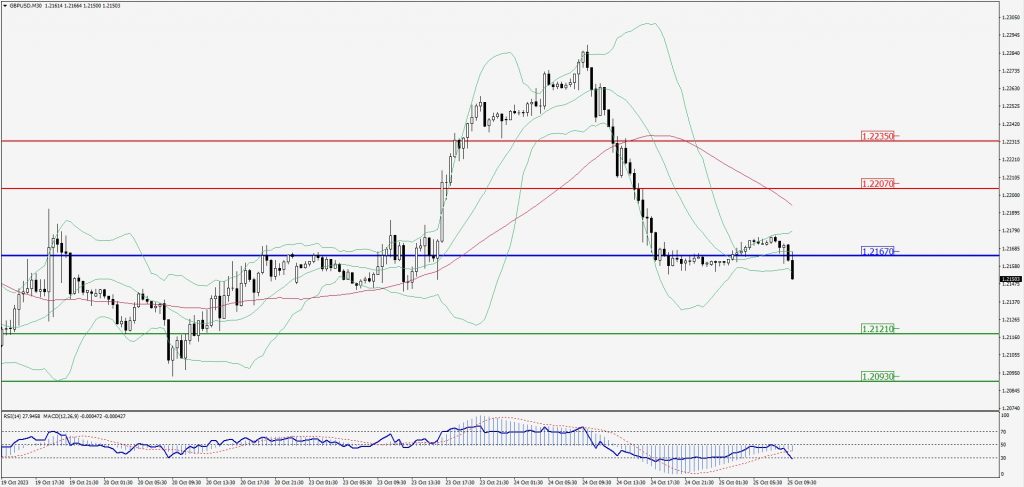
Green Lines Indicate Resistance Levels – Red Lines Indicate Support Levels
Light Blue is a Pivot Point – Black represents the price when the report was produced
USD/JPY Intraday: Support level at 149.840
Our pivot point is at 149.840
Preferable Price Action: Buy position above pivot with the target at 150.030 and 150.150 in extension.
Alternative Price Action: The downside breakout of the pivot would call for 149.680 and 149.560.
Comment: MACD is above 50 level and Pairs above its 20MA & 55MA.
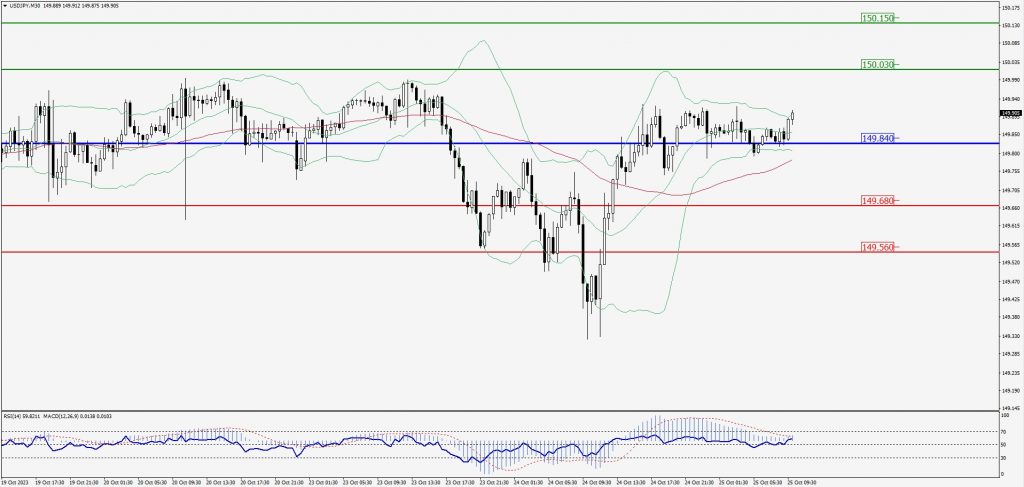
Green Lines Indicate Resistance Levels – Red Lines Indicate Support Levels
Light Blue is a Pivot Point – Black represents the price when the report was produced
AUD/USD Intraday: Trend on the downside
Our pivot point is at 0.63760
Preferable Price Action: Sell positions below pivot with targets at 0.63530 & 0.63380 in extension.
Alternative Price Action: Above pivot looks for a further upside with 0.63960 & 0.64110 as targets.
Comment: RSI is below 50 levels and Pairs below 20MA.
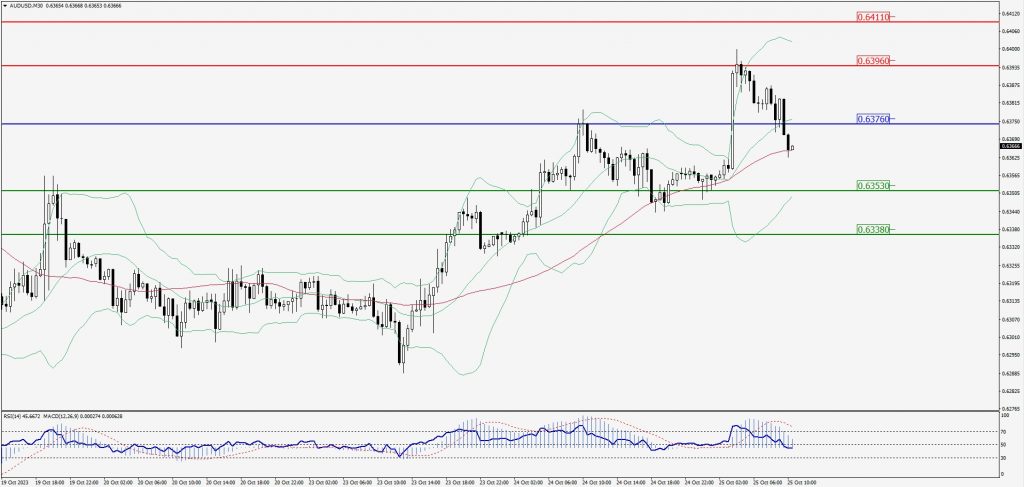
Green Lines Indicate Resistance Levels – Red Lines Indicate Support Levels
Light Blue is a Pivot Point – Black represents the price when the report was produced
CRUDEOIL Intraday: Trend on the downside
Our pivot point is at 83.66
Preferable Price Action: Below pivot sell oil with 82.18 & 81.32 as targets.
Alternative Price Action: Buy crude above pivot with targets at 84.75 and 85.58 in extension.
Comment: MACD is negative territory and Pairs below 55MA.
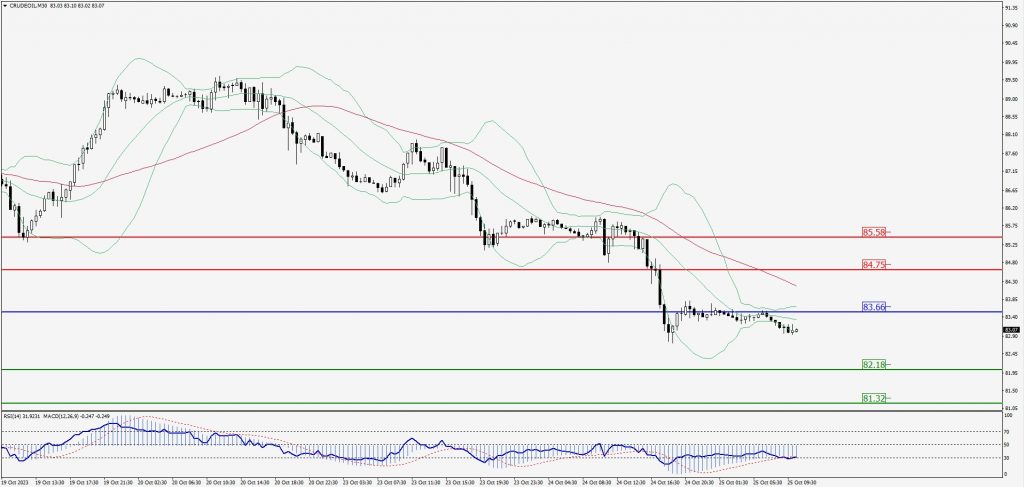
Green Lines Indicate Resistance Levels – Red Lines Indicate Support Levels
Light Blue is a Pivot Point – Black represents the price when the report was produced
XAU/USD Intraday: Trend on the downside
Our pivot point is 1973.40
Preferable Price Action: Further downside to 1961.00 and 1953.50.
Alternative Price Action: If the price gives an upside breakout of a pivot, then the price extends to 1983.90 and 1991.80.
Comment: MACD is below 50 level and Pairs below its 20MA & 55MA.
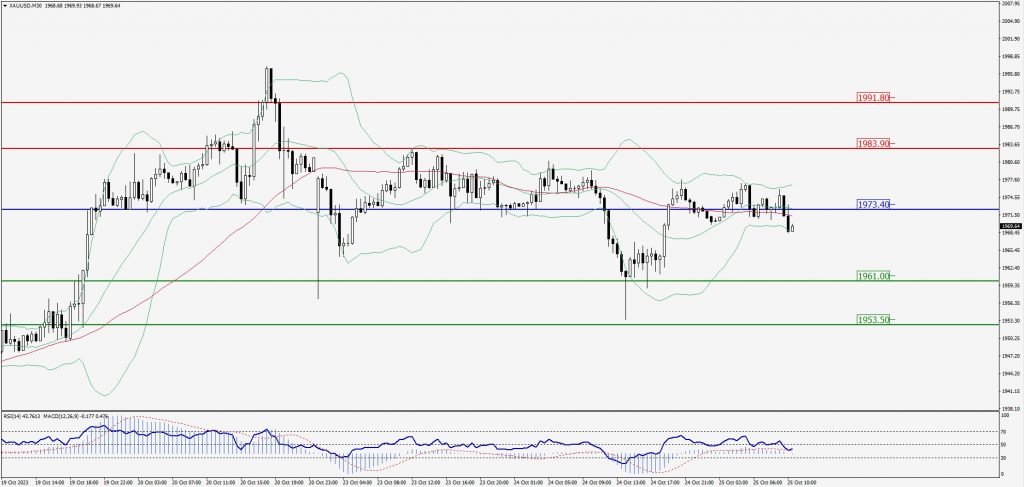
Green Lines Indicate Resistance Levels – Red Lines Indicate Support Levels
Light Blue is a Pivot Point – Black represents the price when the report was produced
Dow Jones Intraday: Resistance level at 33,212.00
Our pivot point is 33,212.00
Preferable Price Action: Take sell positions below the pivot with targets at 33,011.00 & 32,875.00.
Alternative Price Action: Above 33,212.00 looks for further upside to 33,373.00 & 33,495.00.
Comment: RSI is below 50 levels and Pairs below 20MA.
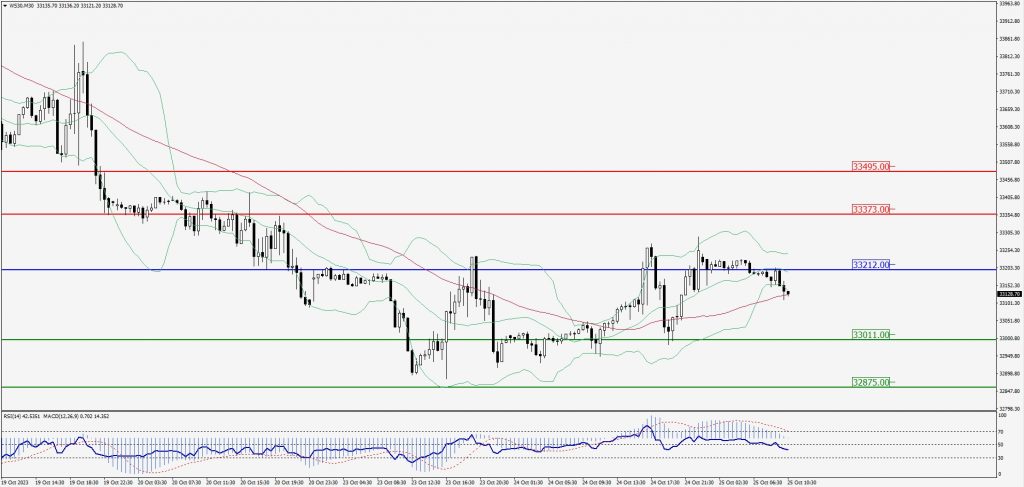
Green Lines Indicate Resistance Levels – Red Lines Indicate Support Levels
Light Blue is a Pivot Point – Black represents the price when the report was produced