Market Wrap: Stocks, Bonds, Commodities
Stock futures are near flat Tuesday night following a tough session that dragged the Dow Jones Industrial Average into negative territory for 2023.
The Dow Jones Industrial Average fell 430.97 points to 33,002.38, the S&P 500 fell 1.37% to 4,229.45 and the Nasdaq Composite subtract 248.31 points to 13,059.47.
MSCI’s index of Asia-Pacific stocks outside Japan is decline 1.23% to 590.51 levels. The Australian index was lower by 0.77% to 6,890.20. Japanese Nikkei Index drop 2.17% today.
European stocks were mixed on Wednesday, with the Stoxx Europe 50 Index rose 0.02% to 4,096.55, Germany’s DAX drop 0.20% to 15,058.75, and France’s CAC advance 0.10% to 7,004.29 and U.K.’s FTSE 100 add 0.03% to 7,472.66.
Benchmark 10-year U.S. Treasury fell as demand for safe assets ascend again, today 10-year bond yields positive 0.06% to 4.8020.
Oil prices recovered slightly after hitting a three-week low on Tuesday, as investors weighed a stronger US dollar, darkening global economic signals and tightening supply.
Spot Brent crude oil drop 0.62% to $90.36 per barrel. US West Texas Intermediate crude is down 0.67% to $88.66 a barrel.
The yellow metal gold is decline 0.11% to 1,839.55 dollars per ounce.
Market Wrap: Forex
The yen strengthened sharply against the dollar on Tuesday, leading some market participants to believe Japanese policymakers had intervened to support the currency, although others said the size of the move was not convincing enough.
Today, the U.S. dollar index measures the Greenback against a trade-weighted basket of six major currencies, which slipped 0.17% to 106.540.
The Euro US Dollar (EUR/USD) is a widely traded pair that is up 0.29% today. This left the pair trading around $1.04940.
The Japanese yen was negative against the U.S. dollar on Wednesday. Today USD/JPY is slipped 0.03% to the 148.000 level.
Another commodity-related currency mixed against the U.S dollar, AUD/USD rose 0.40% to 0.63250, and NZD/USD slipped 0.05% to 0.59030 level.
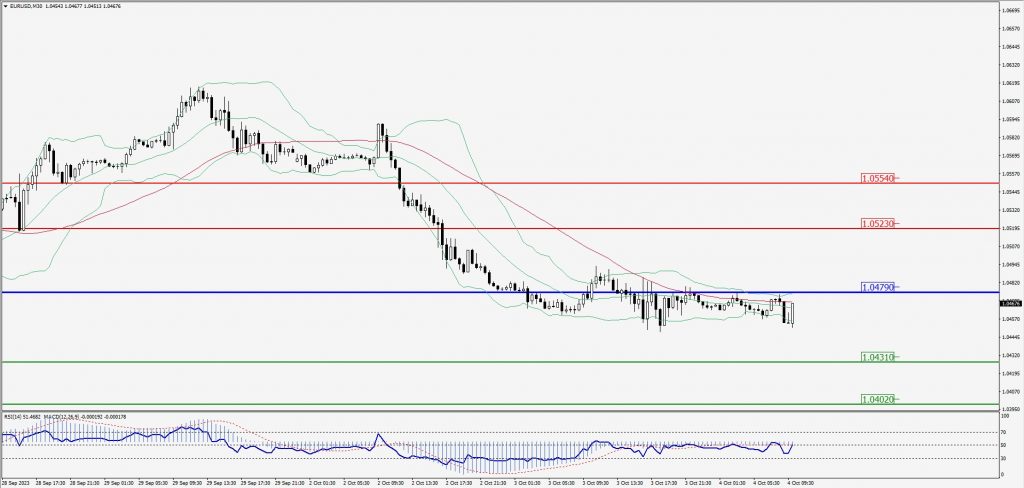
EUR/USD Intraday: Resistance level at 1.04790
Our pivot point is at 1.04790
Preferable Price Action: Take sell positions below pivot level with targets at 1.04310 & 1.04020 in extension.
Alternative Price Action: Above pivot looks for a further upside to 1.05230 & 1.05540.
Comment: RSI is at 50 levels and Pairs below 55MA.
Green Lines Indicate Resistance Levels – Red Lines Indicate Support Levels
Light Blue is a Pivot Point – Black represents the price when the report was produced
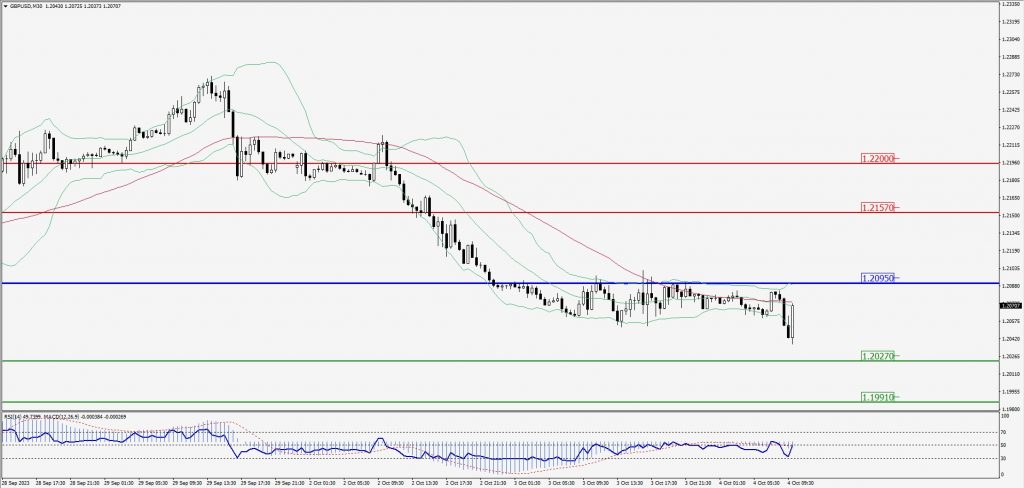
GBP/USD Intraday: In a consolidation zone
Our pivot point is at 1.20950
Preferable Price Action: Sell positions below pivot with targets at 1.20270 & 1.19910 in extension.
Alternative Price Action: The price above pivot would call for further upside to 1.21570 & 1.22000.
Comment: RSI is at 50 levels and Pairs below 20MA.
Green Lines Indicate Resistance Levels – Red Lines Indicate Support Levels
Light Blue is a Pivot Point – Black represents the price when the report was produced
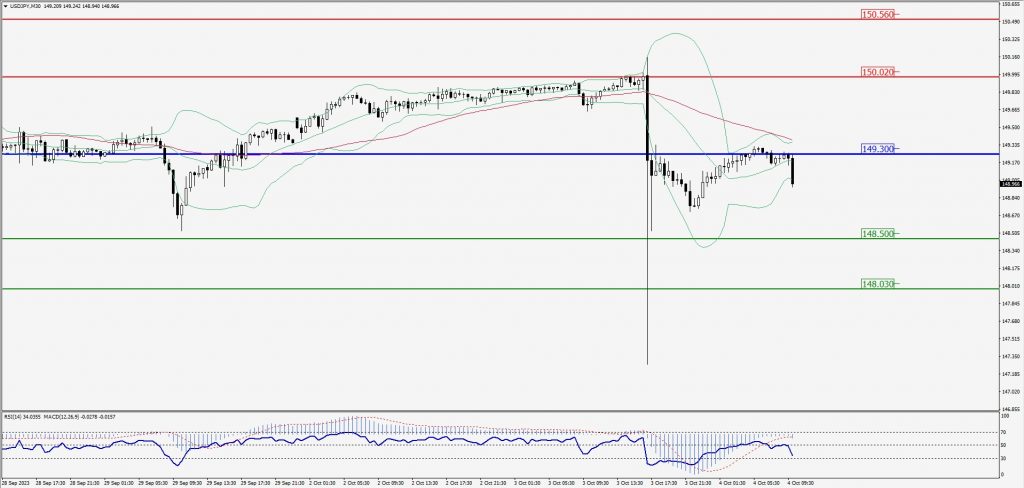
USD/JPY Intraday: Trend on the downside
Our pivot point is at 149.300
Preferable Price Action: Sell position below pivot with the target at 148.500 and 148.030 in extension.
Alternative Price Action: The upside breakout of the pivot would call for 150.020 and 150.560.
Comment: MACD is below 50 level and Pairs below 55MA.
Green Lines Indicate Resistance Levels – Red Lines Indicate Support Levels
Light Blue is a Pivot Point – Black represents the price when the report was produced
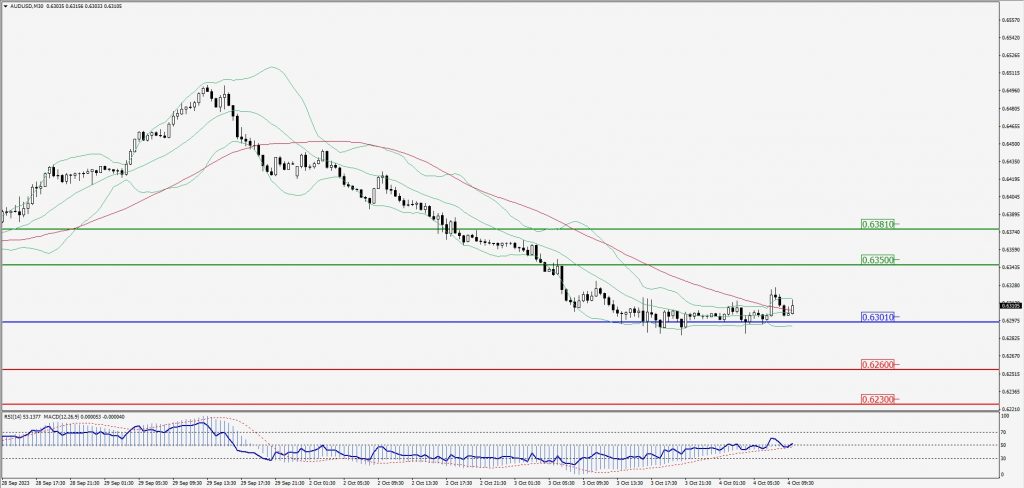
AUD/USD Intraday: Support level at 0.63010
Our pivot point is at 0.63010
Preferable Price Action: Buy positions above pivot with targets at 0.63500 & 0.63810 in extension.
Alternative Price Action: Below pivot looks for a further downside with 0.62600 & 0.62300 as targets.
Comment: RSI is above 50 levels and Pairs above 20MA.
Green Lines Indicate Resistance Levels – Red Lines Indicate Support Levels
Light Blue is a Pivot Point – Black represents the price when the report was produced
CRUDEOIL Intraday: Trend on the downside
Our pivot point is at 88.35
Preferable Price Action: Below pivot sell oil with 86.67 & 85.36 as targets.
Alternative Price Action: Buy crude above pivot with targets at 89.96 and 91.25 in extension.
Comment: MACD is negative territory and Pairs below its 20MA & 55MA.
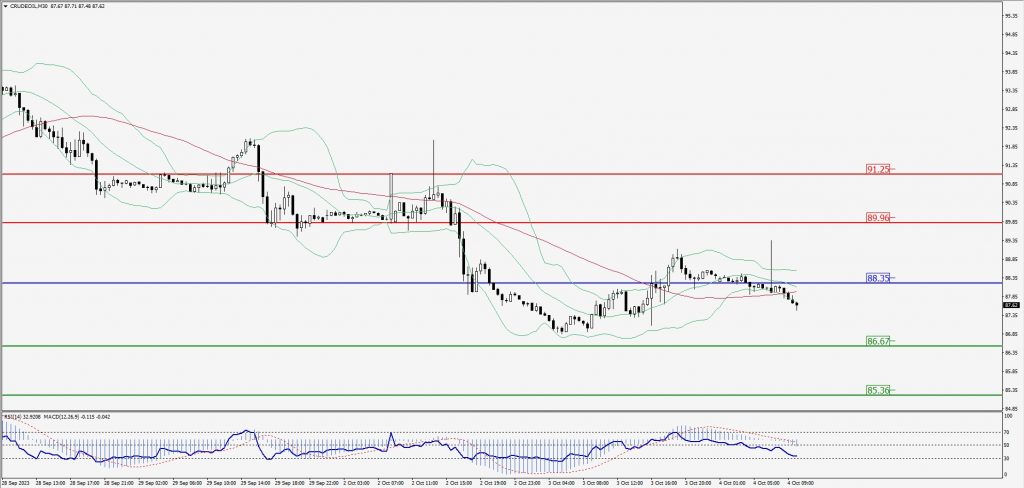
Green Lines Indicate Resistance Levels – Red Lines Indicate Support Levels
Light Blue is a Pivot Point – Black represents the price when the report was produced
XAU/USD Intraday: Trend on the downside
Our pivot point is 1826.20
Preferable Price Action: Further downside to 1808.50 and 1797.50.
Alternative Price Action: If the price gives an upside breakout of a pivot, then the price extends to 1841.20 and 1853.30.
Comment: MACD is below 50 level and Pairs below its 20MA & 55MA.
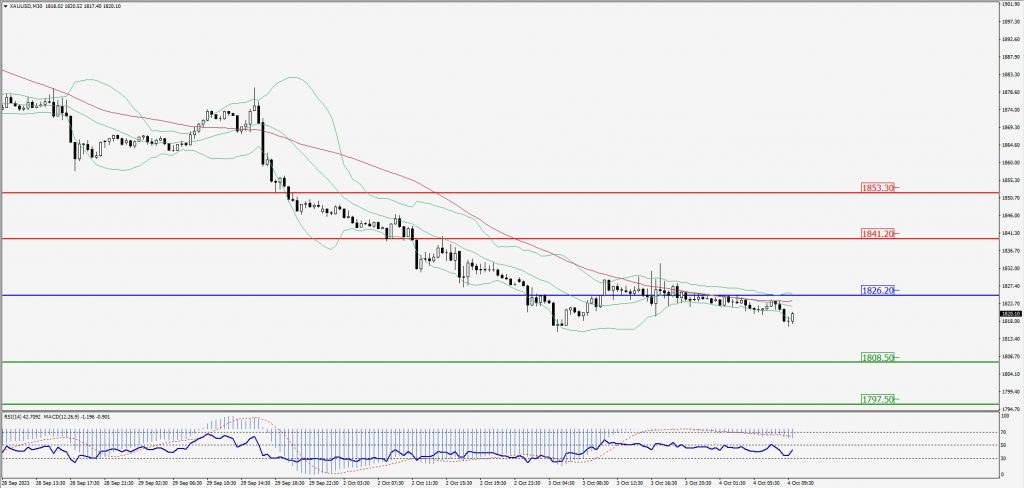
Green Lines Indicate Resistance Levels – Red Lines Indicate Support Levels
Light Blue is a Pivot Point – Black represents the price when the report was produced
Dow Jones Intraday: Trend on the downside
Our pivot point is 32,966.00
Preferable Price Action: Take sell positions below the pivot with targets at 32,761.00 & 32,615.00.
Alternative Price Action: Above 32,966.00 looks for further upside to 33,145.00 & 33,304.00.
Comment: RSI is below 50 levels and Pairs below its 20MA & 55MA.
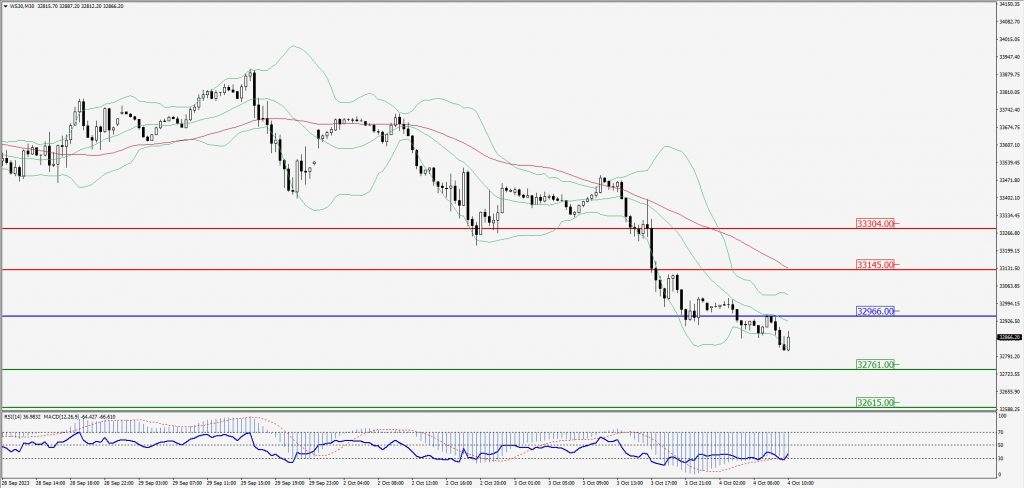
Green Lines Indicate Resistance Levels – Red Lines Indicate Support Levels
Light Blue is a Pivot Point – Black represents the price when the report was produced