Market Wrap: Stocks, Bonds, Commodities
Asia’s stock markets made a tentative start to the fourth quarter in holiday-thinned trade on Monday, nudging sideways while the dollar held firm and a last-minute deal to avert a U.S. government shutdown lifted S&P 500 futures.
The Dow Jones Industrial Average fell 158.84 points to 33,507.50, the S&P 500 lose 0.27% to 4,288.05 and the Nasdaq Composite add 18.05 points to 13,219.32.
MSCI’s index of Asia-Pacific stocks outside Japan is advance 0.18% to 605.62 levels. The Australian index was lower by 0.22% to 7,033.20. Japanese Nikkei Index drop 0.21% today.
European stocks were positive on Monday, with the Stoxx Europe 50 Index rose 0.17% to 4,181.85, Germany’s DAX ascend 0.10% to 15,402.85, and France’s CAC rose 0.16% to 7,145.82 and U.K.’s FTSE 100 subtract 0.10% to 7,600.25.
Benchmark 10-year U.S. Treasury fell as demand for safe assets ascend again, today 10-year bond yields positive 1.16% to 4.6290.
Oil prices held steady on Monday after suffering losses at the end of last week, as investors’ focus returned to a tight global supply outlook while a last-minute deal that avoided a U.S. government shutdown restored some risk appetite.
Spot Brent crude oil ascend 0.44% to $92.61 per barrel. US West Texas Intermediate crude is up 0.47% to $91.22 a barrel.
The yellow metal gold is decline 0.59% to 1,855.15 dollars per ounce.
Market Wrap: Forex
The U.S. dollar’s share of global currency reserves reported to the International Monetary Fund was 58.9% in the second quarter, unchanged from the first three months of the year, IMF data showed on Friday.
Today, the U.S. dollar index measures the Greenback against a trade-weighted basket of six major currencies, which surged 0.19% to 106.010.
The Euro US Dollar (EUR/USD) is a widely traded pair that is down 0.10% today. This left the pair trading around $1.05600.
The Japanese yen was negative against the U.S. dollar on Monday. Today USD/JPY is surged 0.26% to the 149.750 level.
Another commodity-related currency negative against the U.S dollar, AUD/USD fell 0.46% to 0.64040, and NZD/USD slipped 0.24% to 0.59810 level.
EUR/USD Intraday: Trend on the upside
Our pivot point is at 1.05740
Preferable Price Action: Take buy positions above pivot level with targets at 1.06130 & 1.06420 in extension.
Alternative Price Action: Below pivot looks for a further downside to 1.05400 & 1.05160.
Comment: RSI is above 50 levels and Pairs above its 20MA & 55MA.
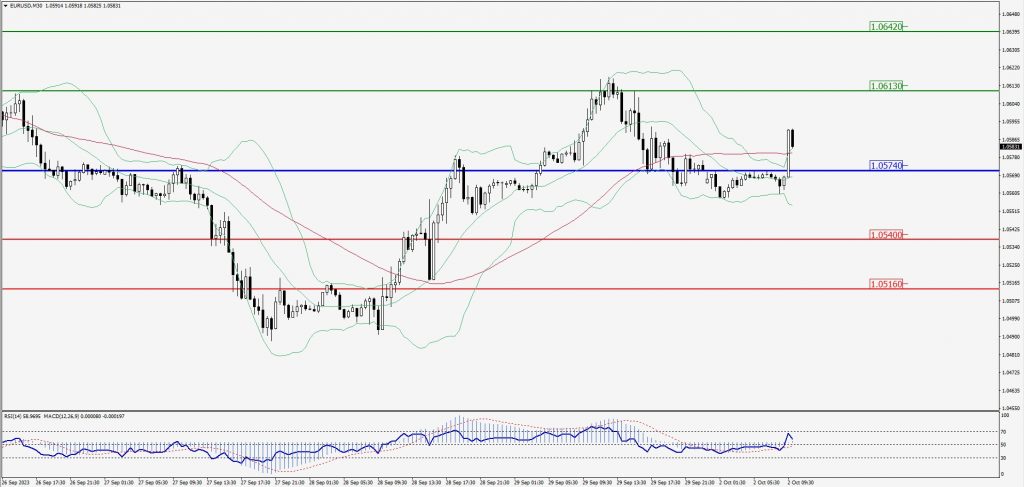
Green Lines Indicate Resistance Levels – Red Lines Indicate Support Levels
Light Blue is a Pivot Point – Black represents the price when the report was produced
GBP/USD Intraday: Trend on the upside
Our pivot point is at 1.21980
Preferable Price Action: Buy positions above pivot with targets at 1.22440 & 1.22780 in extension.
Alternative Price Action: The price below pivot would call for further downside to 1.21580 & 1.21340.
Comment: RSI is above 50 levels and Pairs above 20MA.
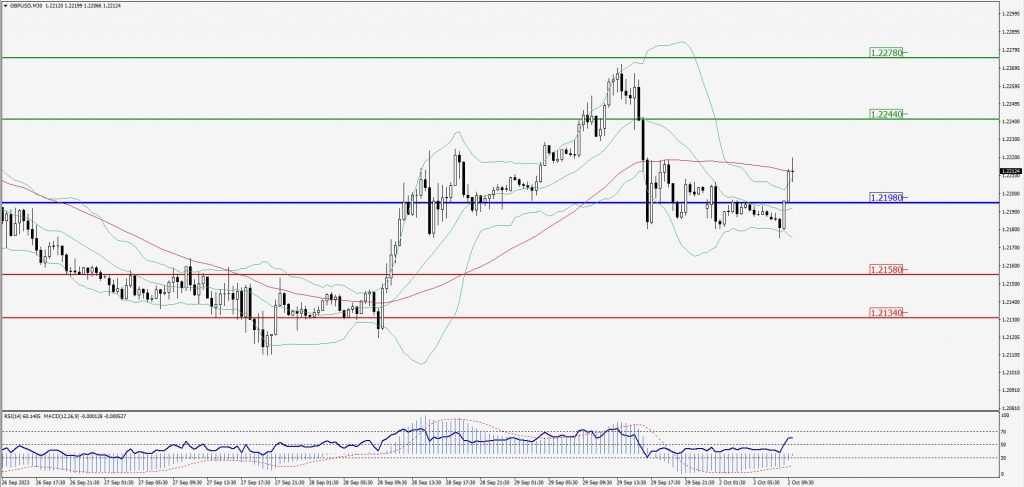
Green Lines Indicate Resistance Levels – Red Lines Indicate Support Levels
Light Blue is a Pivot Point – Black represents the price when the report was produced
USD/JPY Intraday: Support level at 149.510
Our pivot point is at 149.510
Preferable Price Action: Buy position above pivot with the target at 149.810 and 150.000 in extension.
Alternative Price Action: The downside breakout of the pivot would call for 149.250 and 149.060.
Comment: MACD is above 50 level and Pairs above 55MA.
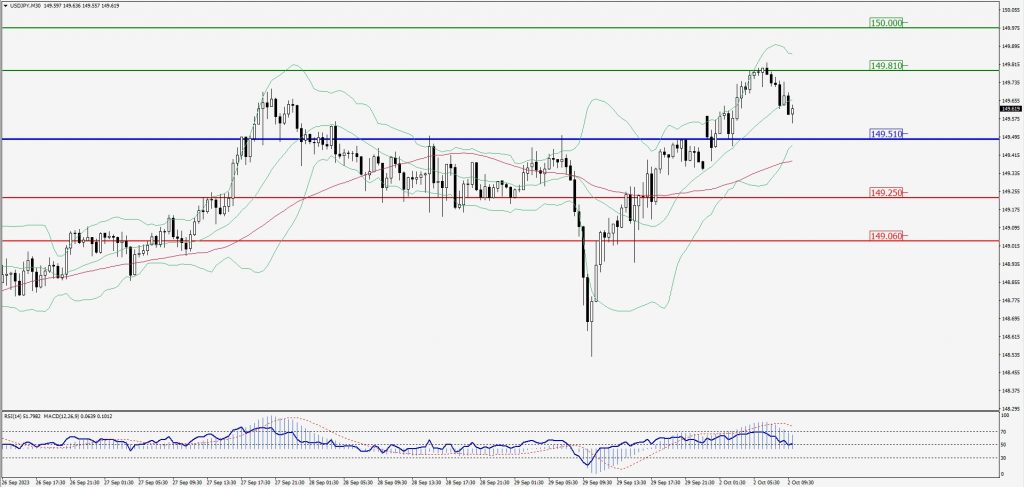
Green Lines Indicate Resistance Levels – Red Lines Indicate Support Levels
Light Blue is a Pivot Point – Black represents the price when the report was produced
AUD/USD Intraday: Trend on the downside
Our pivot point is at 0.64330
Preferable Price Action: Sell positions below pivot with targets at 0.63990 & 0.63760 in extension.
Alternative Price Action: Above pivot looks for a further upside with 0.64620 & 0.64830 as targets.
Comment: RSI is below 50 levels and Pairs below 20MA & 55MA.
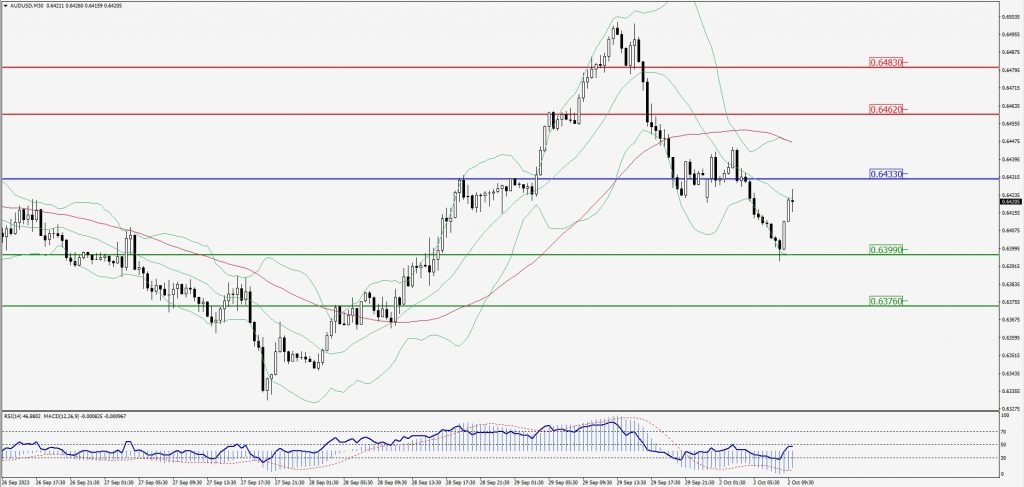
Green Lines Indicate Resistance Levels – Red Lines Indicate Support Levels
Light Blue is a Pivot Point – Black represents the price when the report was produced
CRUDEOIL Intraday: Trend on the downside
Our pivot point is at 90.67
Preferable Price Action: Below pivot sell oil with 89.40 & 88.59 as targets.
Alternative Price Action: Buy crude above pivot with targets at 91.79 and 92.68 in extension.
Comment: MACD is negative territory and Pairs below 55MA.
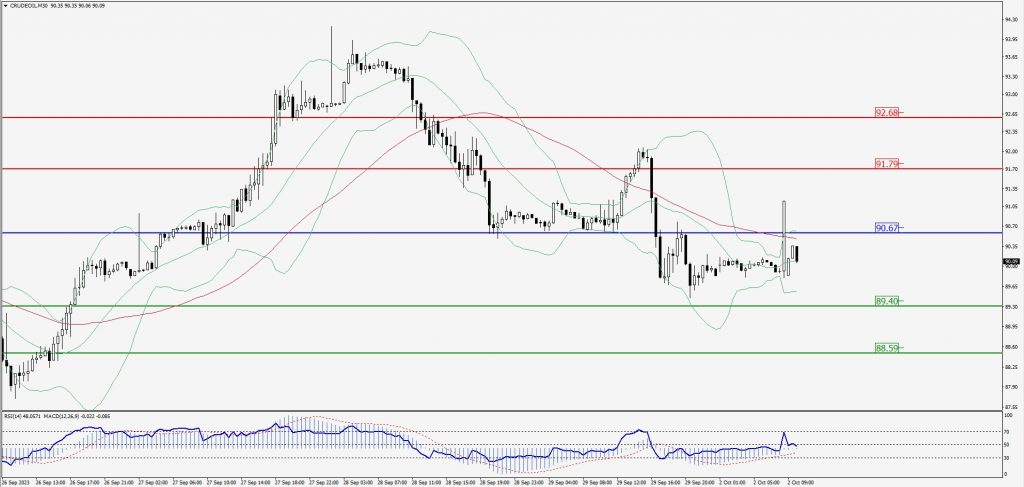
Green Lines Indicate Resistance Levels – Red Lines Indicate Support Levels
Light Blue is a Pivot Point – Black represents the price when the report was produced
Dow Jones Intraday: Trend on the upside
Our pivot point is 33,672.00
Preferable Price Action: Take buy positions above the pivot with targets at 33,825.00 & 33,947.00.
Alternative Price Action: Below 33,672.00 looks for further downside to 33,542.00 & 33,454.00.
Comment: RSI is above 50 levels and Pairs above its 20MA & 55MA.
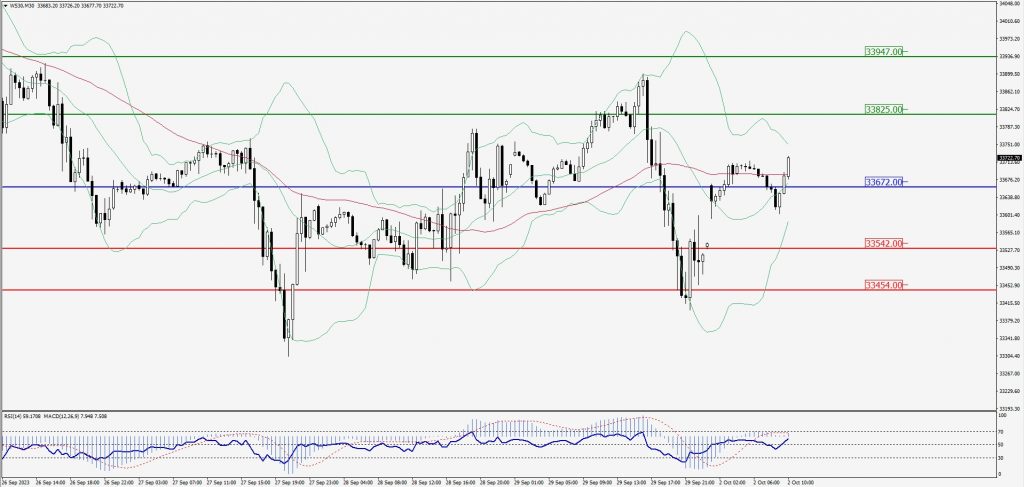
Green Lines Indicate Resistance Levels – Red Lines Indicate Support Levels
Light Blue is a Pivot Point – Black represents the price when the report was produced