Market Wrap: Stocks, Bonds, Commodities
Apple held talks with DuckDuckGo to replace Alphabet’s Google as the default search engine for the private mode on Apple Safari browser, the Bloomberg News reported on Wednesday, citing people familiar with the discussions.
The Dow Jones Industrial Average rose 127.17 points to 33,129.55, the S&P 500 rose 0.81% to 4,263.75 and the Nasdaq Composite add 176.54 points to 13,236.01.
MSCI’s index of Asia-Pacific stocks outside Japan is advance 0.56% to 593.63 levels. The Australian index was higher by 0.51% to 6,925.50. Japanese Nikkei Index ascend 1.69% today.
European stocks were mixed on Thursday, with the Stoxx Europe 50 Index rose 0.03% to 4,100.25, Germany’s DAX drop 0.07% to 15,089.75, and France’s CAC decline 0.24% to 6,979.22 and U.K.’s FTSE 100 add 0.09% to 7,419.83.
Benchmark 10-year U.S. Treasury fell as demand for safe assets ascend again, today 10-year bond yields positive 0.34% to 4.7490.
Oil fell by over $3 a barrel on Wednesday, as demand fears stemming from macroeconomic headwinds offset pledges by Saudi Arabia and Russia to continue crude output cuts to the end of 2023.
Spot Brent crude oil drop 0.90% to $85.06 per barrel. US West Texas Intermediate crude is down 0.89% to $83.47 a barrel.
The yellow metal gold is decline 0.02% to 1,834.45 dollars per ounce.
Market Wrap: Forex
The yen and euro received some much needed relief on Thursday as the dollar and U.S. Treasury yields both stalled after U.S. private payrolls growth slowed sharply, leading investors to reduce bets the Federal Reserve will hike rates again this year.
Today, the U.S. dollar index measures the Greenback against a trade-weighted basket of six major currencies, which slipped 0.02% to 106.510.
The Euro US Dollar (EUR/USD) is a widely traded pair that is up 0.09% today. This left the pair trading around $1.05120.
The Japanese yen was negative against the U.S. dollar on Thursday. Today USD/JPY is slipped 0.12% to the 148.930 level.
Another commodity-related currency positive against the U.S dollar, AUD/USD rose 0.25% to 0.63390, and NZD/USD surged 0.25% to 0.59280 level.
EUR/USD Intraday: Trend on the downside
Our pivot point is at 1.05180
Preferable Price Action: Take sell positions below pivot level with targets at 1.04860 & 1.04650 in extension.
Alternative Price Action: Above pivot looks for a further upside to 1.05500 & 1.05720.
Comment: RSI is below 50 levels and Pairs below 20MA.
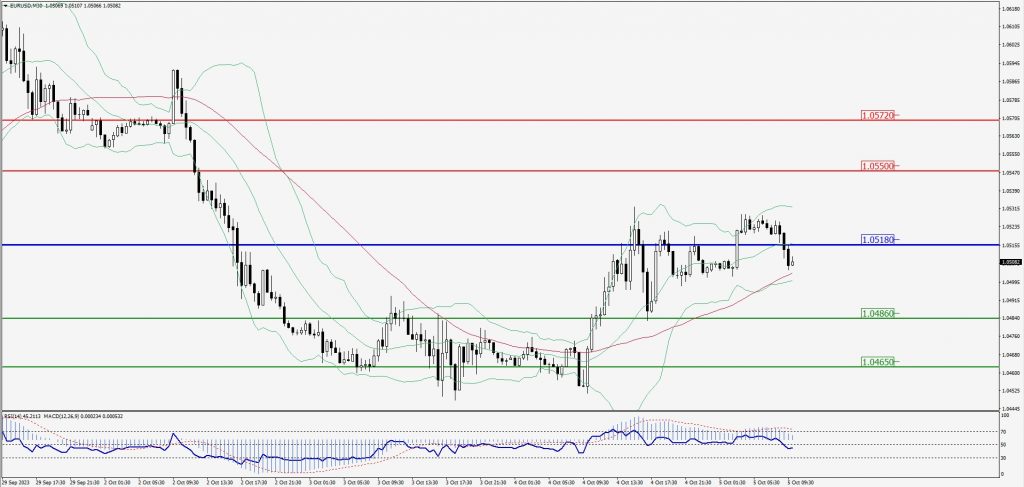
Green Lines Indicate Resistance Levels – Red Lines Indicate Support Levels
Light Blue is a Pivot Point – Black represents the price when the report was produced
GBP/USD Intraday: Resistance level at 1.21620
Our pivot point is at 1.21620
Preferable Price Action: Sell positions below pivot with targets at 1.21020 & 1.20670 in extension.
Alternative Price Action: The price above pivot would call for further upside to 1.22180 & 1.22590.
Comment: RSI is below 50 levels and Pairs below 20MA.
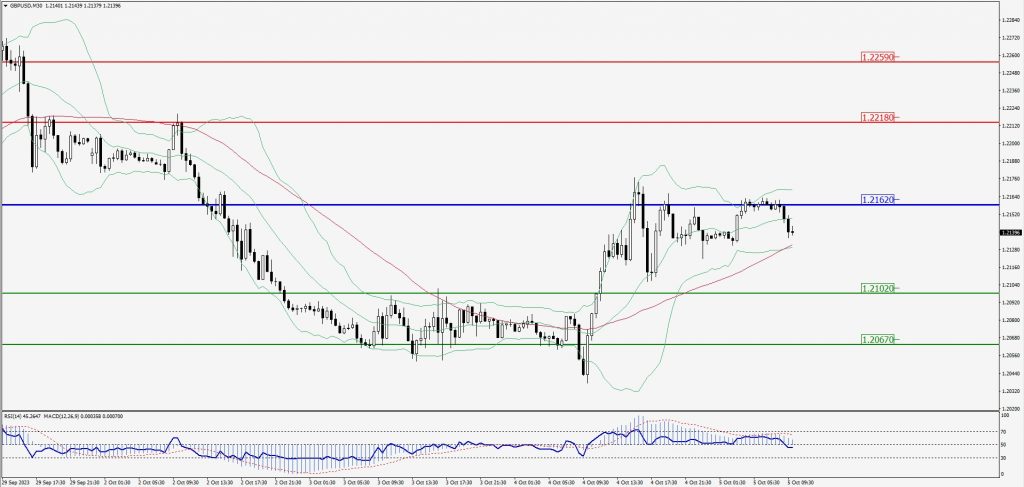
Green Lines Indicate Resistance Levels – Red Lines Indicate Support Levels
Light Blue is a Pivot Point – Black represents the price when the report was produced
USD/JPY Intraday: Trend on the upside
Our pivot point is at 148.760
Preferable Price Action: Buy position above pivot with the target at 149.350 and 149.780 in extension.
Alternative Price Action: The downside breakout of the pivot would call for 148.220 and 147.820.
Comment: MACD is above 50 level and Pairs above 20MA.
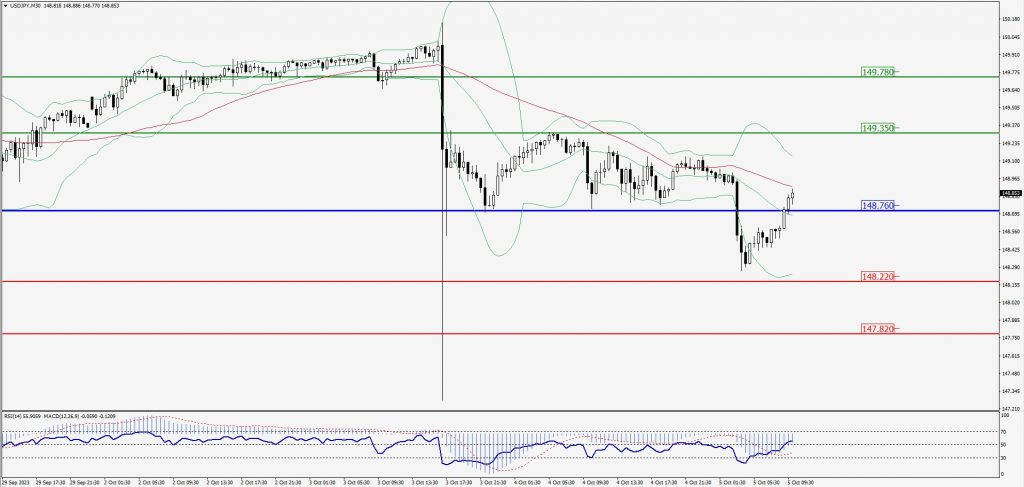
Green Lines Indicate Resistance Levels – Red Lines Indicate Support Levels
Light Blue is a Pivot Point – Black represents the price when the report was produced
AUD/USD Intraday: In a consolidation zone
Our pivot point is at 0.63660
Preferable Price Action: Sell positions below pivot with targets at 0.63120 & 0.62780 in extension.
Alternative Price Action: Above pivot looks for a further upside with 0.64150 & 0.64500 as targets.
Comment: RSI is below 50 levels and Pairs below 20MA.
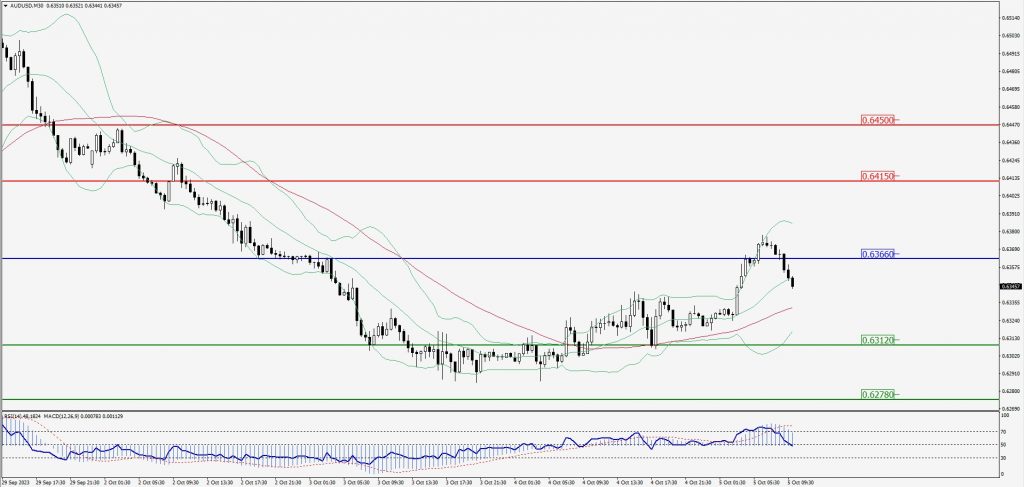
Green Lines Indicate Resistance Levels – Red Lines Indicate Support Levels
Light Blue is a Pivot Point – Black represents the price when the report was produced
CRUDEOIL Intraday: Trend on the downside
Our pivot point is at 84.43
Preferable Price Action: Below pivot sell oil with 81.62 & 80.23 as targets.
Alternative Price Action: Buy crude above pivot with targets at 86.82 and 88.41 in extension.
Comment: MACD is negative territory and Pairs below 55MA.
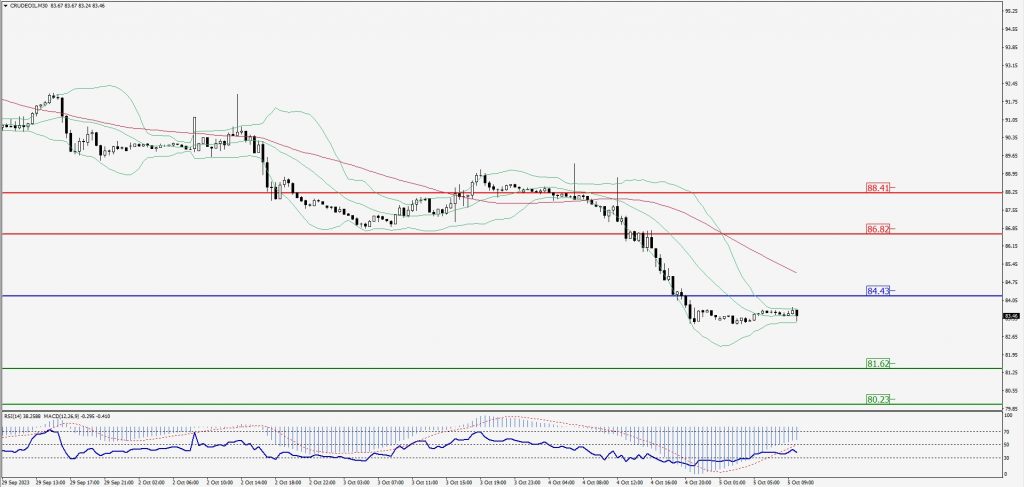
Green Lines Indicate Resistance Levels – Red Lines Indicate Support Levels
Light Blue is a Pivot Point – Black represents the price when the report was produced
XAU/USD Intraday: Resistance level at 1828.20
Our pivot point is 1828.20
Preferable Price Action: Further downside to 1808.50 and 1796.60.
Alternative Price Action: If the price gives an upside breakout of a pivot, then the price extends to 1845.50 and 1857.30.
Comment: MACD is below 50 level and Pairs below 20MA.
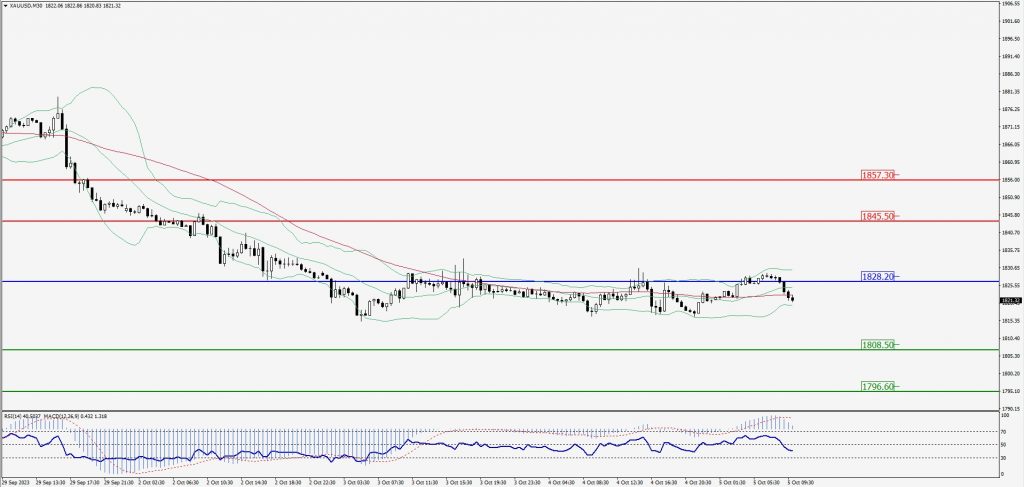
Green Lines Indicate Resistance Levels – Red Lines Indicate Support Levels
Light Blue is a Pivot Point – Black represents the price when the report was produced
Dow Jones Intraday: Trend on the downside
Our pivot point is 33,148.00
Preferable Price Action: Take sell positions below the pivot with targets at 32,837.00 & 32,646.00.
Alternative Price Action: Above 33,148.00 looks for further upside to 33,424.00 & 33,646.00.
Comment: RSI is below 50 levels and Pairs below 20MA.
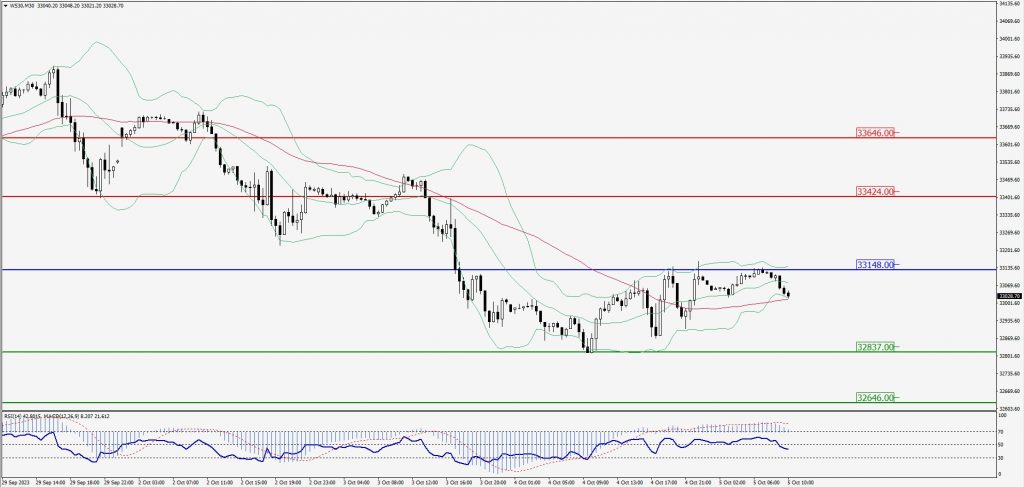
Green Lines Indicate Resistance Levels – Red Lines Indicate Support Levels
Light Blue is a Pivot Point – Black represents the price when the report was produced