Market Wrap: Stocks, Bonds, Commodities
Australia stocks were lower after the close on Tuesday, as losses in the Materials, Metals & Mining and A-REITs sectors led shares lower.
The Dow Jones Industrial Average gain 6.06 points to 34,624.30, the S&P 500 rose 0.07% to 4,453.53 and the Nasdaq Composite add 1.90 points to 13,710.24.
MSCI’s index of Asia-Pacific stocks outside Japan is decline 0.16% to 618.45 levels. The Australian index was lower by 0.47% to 7,196.60. Japanese Nikkei Index drop 0.80% today.
European stocks were mixed on Tuesday, with the Stoxx Europe 50 Index rose 0.15% to 4,252.35, Germany’s DAX drop 0.12% to 15,708.55, and France’s CAC ascend 0.16% to 7,288.11 and U.K.’s FTSE 100 add 0.14% to 7,663.00.
Benchmark 10-year U.S. Treasury fell as demand for safe assets ascend again, today 10-year bond yields positive 0.09% to 4.3220.
Oil prices rose on Tuesday for a fourth consecutive session as weak U.S. shale output spurred further concerns about a supply deficit stemming from extended production cuts by Saudi Arabia and Russia.
Spot Brent crude oil ascend 0.58% to $94.99 per barrel. US West Texas Intermediate crude is up 0.79% to $91.28 a barrel.
The yellow metal gold is advance 0.10% to 1,955.25 dollars per ounce.
Market Wrap: Forex
The U.S. dollar traded largely unchanged in early European trade Tuesday, drifting ahead of the start of the latest two-day Federal Reserve policy meeting, the highlight of several key central bank rate decisions this week.
Today, the U.S. dollar index measures the Greenback against a trade-weighted basket of six major currencies, which slipped 0.10% to 104.880.
The Euro US Dollar (EUR/USD) is a widely traded pair that is up 0.17% today. This left the pair trading around $1.06730.
The Japanese yen was negative against the U.S. dollar on Tuesday. Today USD/JPY is surged 0.05% to the 147.680 level.
Another commodity-related currency positive against the U.S dollar, AUD/USD rose 0.37% to 0.64580, and NZD/USD surged 0.35% to 0.59380 level.
EUR/USD Intraday: Trend on the downside
Our pivot point is at 1.06890
Preferable Price Action: Take sell positions below pivot level with targets at 1.06630 & 1.06460 in extension.
Alternative Price Action: Above pivot looks for a further upside to 1.07120 & 1.07280.
Comment: RSI is below 50 levels and Pairs below 20MA.
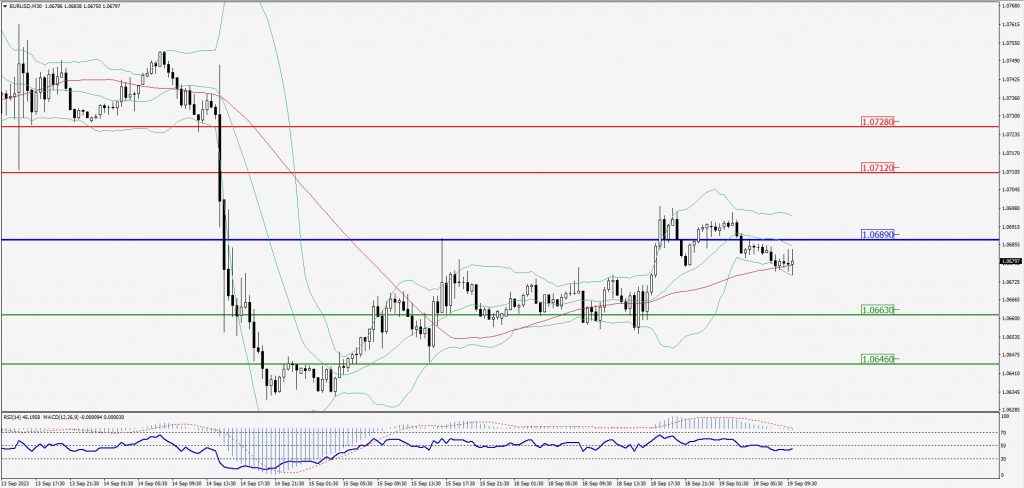
Green Lines Indicate Resistance Levels – Red Lines Indicate Support Levels
Light Blue is a Pivot Point – Black represents the price when the report was produced
GBP/USD Intraday: Resistance level at 1.23940
Our pivot point is at 1.23940
Preferable Price Action: Sell positions below pivot with targets at 1.23540 & 1.23300 in extension.
Alternative Price Action: The price above pivot would call for further upside to 1.24280 & 1.24540.
Comment: RSI is below 50 levels and Pairs below 20MA.
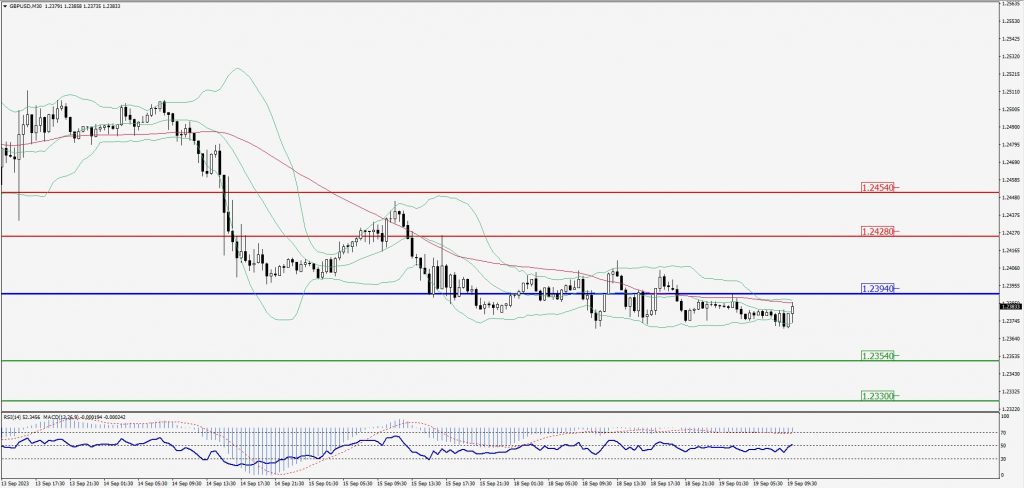
Green Lines Indicate Resistance Levels – Red Lines Indicate Support Levels
Light Blue is a Pivot Point – Black represents the price when the report was produced
USD/JPY Intraday: Trend on the upside
Our pivot point is at 147.770
Preferable Price Action: Buy position above pivot with the target at 147.990 and 148.140 in extension.
Alternative Price Action: The downside breakout of the pivot would call for 147.580 and 147.440.
Comment: MACD is above 50 level and Pairs above its 20MA & 55MA.
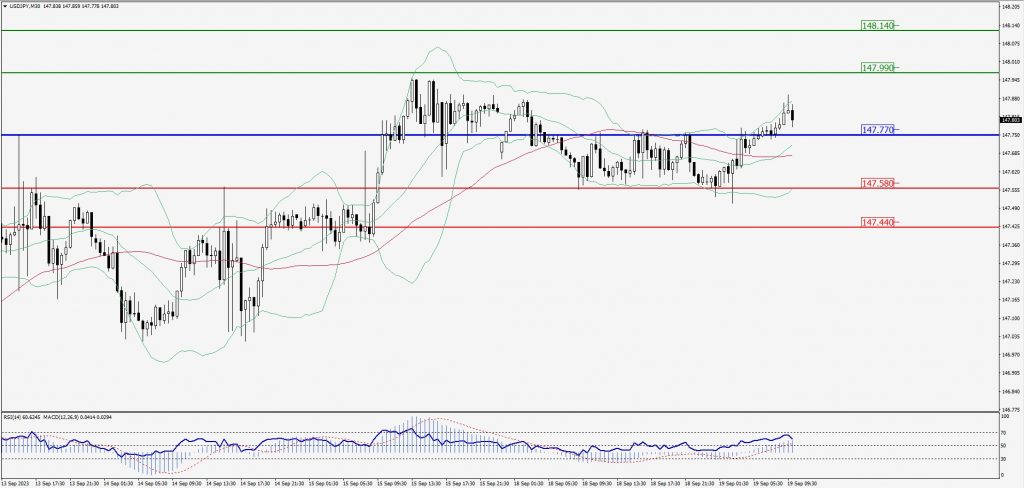
Green Lines Indicate Resistance Levels – Red Lines Indicate Support Levels
Light Blue is a Pivot Point – Black represents the price when the report was produced
AUD/USD Intraday: Support level at 0.64310
Our pivot point is at 0.64310
Preferable Price Action: Buy positions above pivot with targets at 0.64530 & 0.64720 in extension.
Alternative Price Action: Below pivot looks for a further downside with 0.64140 & 0.64000 as targets.
Comment: RSI is above 50 levels and Pairs above 20MA.
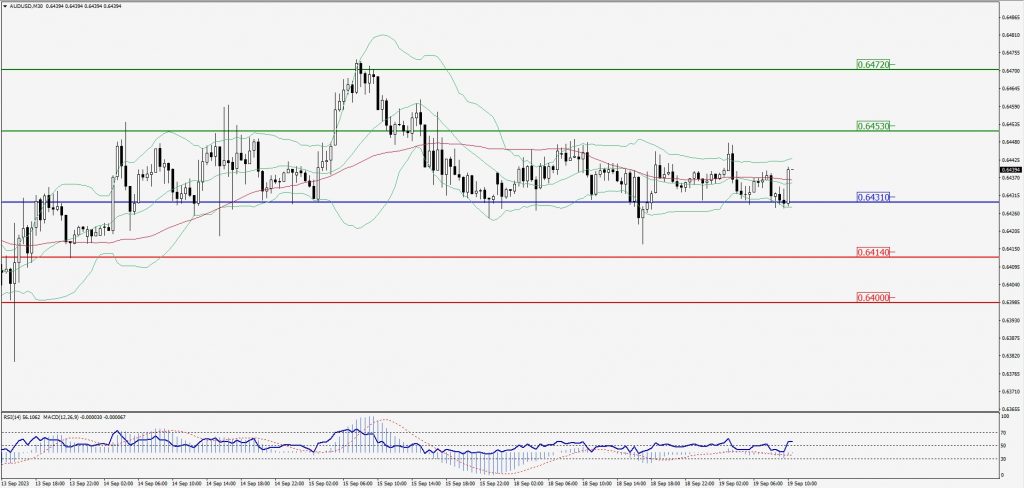
Green Lines Indicate Resistance Levels – Red Lines Indicate Support Levels
Light Blue is a Pivot Point – Black represents the price when the report was produced
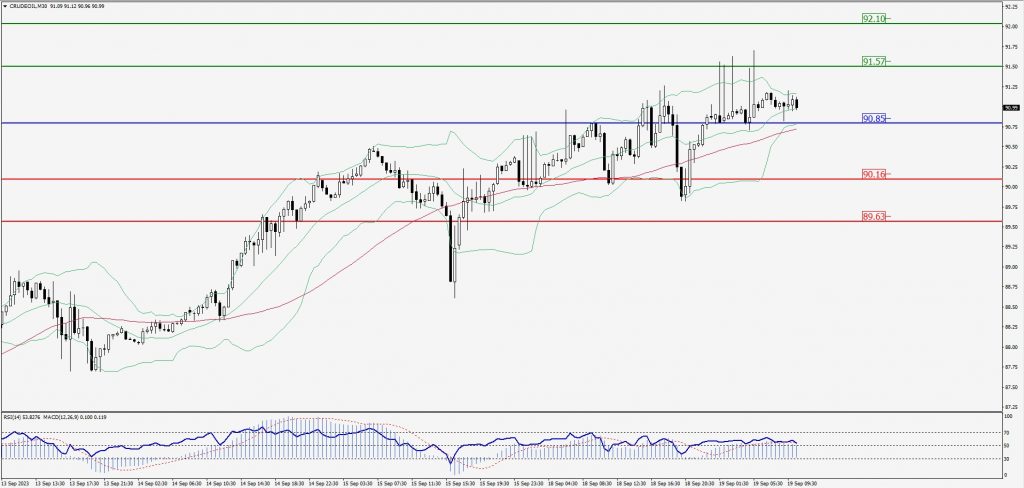
CRUDEOIL Intraday: Trend on the upside
Our pivot point is at 90.85
Preferable Price Action: Above pivot buy oil with 91.57 & 92.10 as targets.
Alternative Price Action: Sell crude below pivot with targets at 90.16 and 89.63 in extension.
Comment: MACD is positive territory and Pairs above its 20MA & 55MA.
Green Lines Indicate Resistance Levels – Red Lines Indicate Support Levels
Light Blue is a Pivot Point – Black represents the price when the report was produced
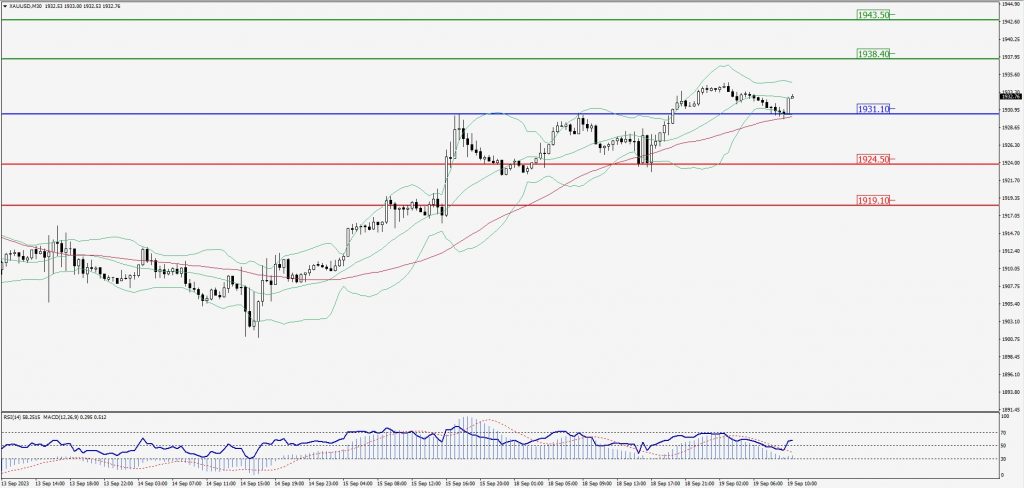
XAU/USD Intraday: Trend on the upside
Our pivot point is 1931.10
Preferable Price Action: Further upside to 1938.40 and 1943.50.
Alternative Price Action: If the price gives a downside breakout of a pivot, then the price extends to 1924.50 and 1919.10.
Comment: MACD is above 50 level and Pairs above 55MA.
Green Lines Indicate Resistance Levels – Red Lines Indicate Support Levels
Light Blue is a Pivot Point – Black represents the price when the report was produced
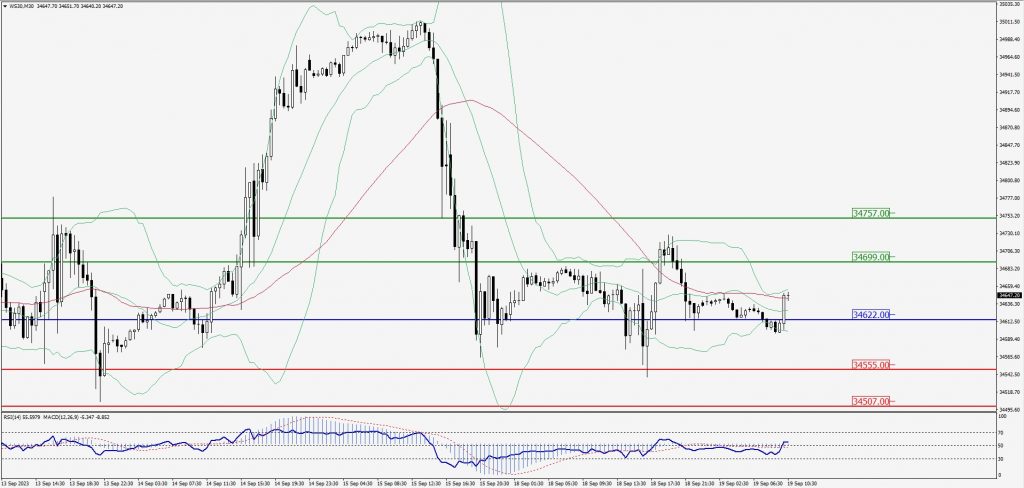
Dow Jones Intraday: Trend on the upside
Our pivot point is 34,622.00
Preferable Price Action: Take buy positions above the pivot with targets at 34,699.00 & 34,757.00.
Alternative Price Action: Below 34,622.00 looks for further downside to 34,555.00 & 34,507.00.
Comment: RSI is above 50 levels and Pairs above 20MA.
Green Lines Indicate Resistance Levels – Red Lines Indicate Support Levels
Light Blue is a Pivot Point – Black represents the price when the report was produced