Market Wrap: Stocks, Bonds, Commodities
Australia stocks were lower after the close on Monday, as losses in the IT, Energy and Telecoms Services sectors led shares lower.
The Dow Jones Industrial Average lose 288.87 points to 34,618.24, the S&P 500 fell 1.22% to 4,450.32 and the Nasdaq Composite subtract 217.72 points to 13,708.33.
MSCI’s index of Asia-Pacific stocks outside Japan is decline 1.00% to 619.53 levels. The Australian index was lower by 0.67% to 7,230.40. Japanese Nikkei Index ascend 1.10% today.
European stocks were negative on Monday, with the Stoxx Europe 50 Index fell 0.78% to 4,261.45, Germany’s DAX drop 0.60% to 15,799.25, and France’s CAC decline 1.04% to 7,302.38 and U.K.’s FTSE 100 subtract 0.35% to 7,683.55.
Benchmark 10-year U.S. Treasury fell as demand for safe assets ascend again, today 10-year bond yields positive 0.51% to 4.3440.
Oil prices rose for a third straight session on Monday, buoyed by forecasts of a widening supply deficit in the fourth quarter after Saudi Arabia and Russia extended cuts and by optimism about a recovery in demand in China.
Spot Brent crude oil ascend 0.49% to $94.39 per barrel. US West Texas Intermediate crude is up 0.59% to $90.55 a barrel.
The yellow metal gold is advance 0.05% to 1,947.15 dollars per ounce.
Market Wrap: Forex
The U.S. dollar hovered near a six-month high on Monday as traders looked ahead to interest rate decisions from the Federal Reserve, the Bank of England and the Bank of Japan this week.
Today, the U.S. dollar index measures the Greenback against a trade-weighted basket of six major currencies, which slipped 0.10% to 104.880.
The Euro US Dollar (EUR/USD) is a widely traded pair that is up 0.17% today. This left the pair trading around $1.06730.
The Japanese yen was negative against the U.S. dollar on Monday. Today USD/JPY is slipped 0.14% to the 147.610 level.
Another commodity-related currency positive against the U.S dollar, AUD/USD rose 0.10% to 0.64390, and NZD/USD surged 0.15% to 0.59090 level.
EUR/USD Intraday: Trend on the downside
Our pivot point is at 1.06750
Preferable Price Action: Take sell positions below pivot level with targets at 1.06370 & 1.06140 in extension.
Alternative Price Action: Above pivot looks for a further upside to 1.07070 & 1.07330.
Comment: RSI is below 50 levels and Pairs below 20MA.
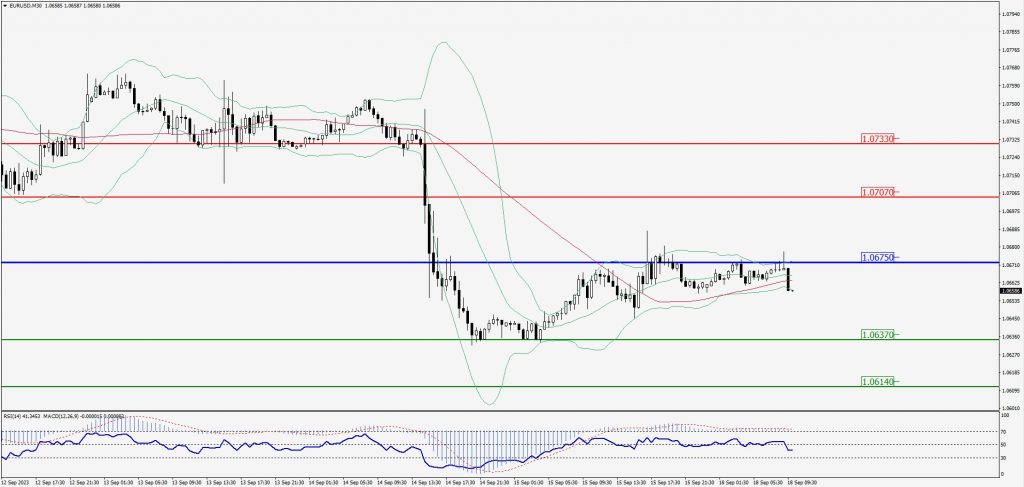
Green Lines Indicate Resistance Levels – Red Lines Indicate Support Levels
Light Blue is a Pivot Point – Black represents the price when the report was produced
GBP/USD Intraday: Trend on the downside
Our pivot point is at 1.24030
Preferable Price Action: Sell positions below pivot with targets at 1.23720 & 1.23530 in extension.
Alternative Price Action: The price above pivot would call for further upside to 1.24320 & 1.24540.
Comment: RSI is below 50 levels and Pairs below 55MA.
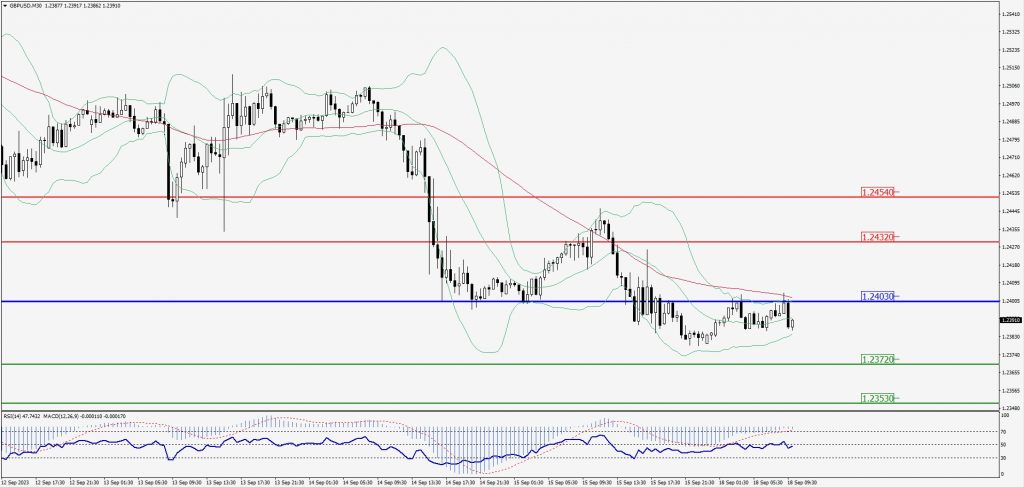
Green Lines Indicate Resistance Levels – Red Lines Indicate Support Levels
Light Blue is a Pivot Point – Black represents the price when the report was produced
USD/JPY Intraday: Trend on the downside
Our pivot point is at 147.770
Preferable Price Action: Sell position below pivot with the target at 147.480 and 147.260 in extension.
Alternative Price Action: The upside breakout of the pivot would call for 148.050 and 148.290.
Comment: MACD is below 50 level and Pairs below its 20MA & 55MA.
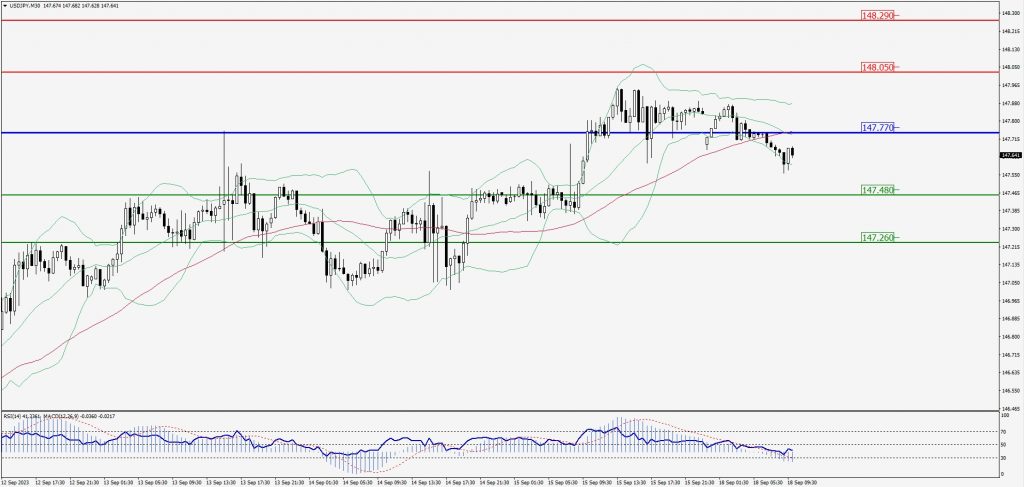
Green Lines Indicate Resistance Levels – Red Lines Indicate Support Levels
Light Blue is a Pivot Point – Black represents the price when the report was produced
AUD/USD Intraday: Support level at 0.64380
Our pivot point is at 0.64380
Preferable Price Action: Buy positions above pivot with targets at 0.64590 & 0.64740 in extension.
Alternative Price Action: Below pivot looks for a further downside with 0.64150 & 0.64000 as targets.
Comment: RSI is above 50 levels and Pairs above 20MA.
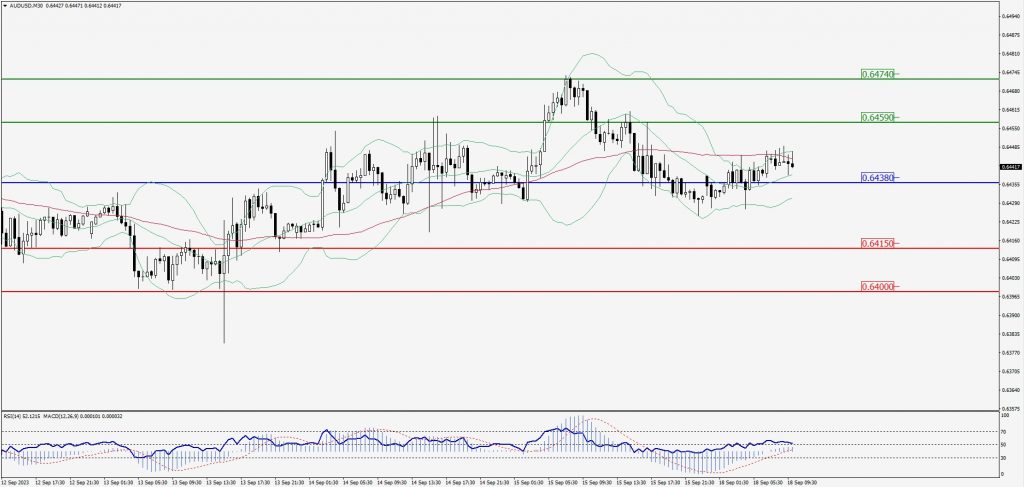
Green Lines Indicate Resistance Levels – Red Lines Indicate Support Levels
Light Blue is a Pivot Point – Black represents the price when the report was produced
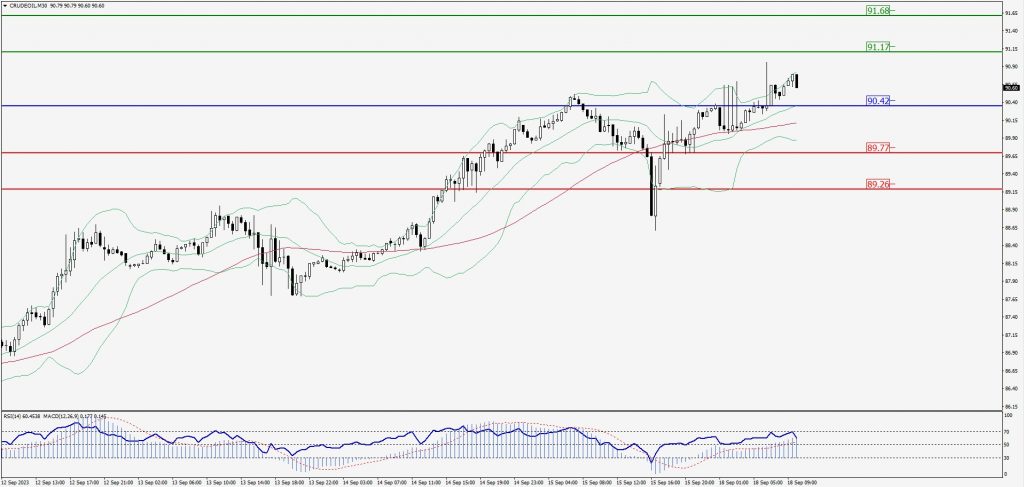
CRUDEOIL Intraday: Trend on the upside
Our pivot point is at 90.42
Preferable Price Action: Above pivot buy oil with 91.17 & 91.68 as targets.
Alternative Price Action: Sell crude below pivot with targets at 89.77 and 89.26 in extension.
Comment: MACD is positive territory and Pairs above its 20MA & 55MA.
Green Lines Indicate Resistance Levels – Red Lines Indicate Support Levels
Light Blue is a Pivot Point – Black represents the price when the report was produced
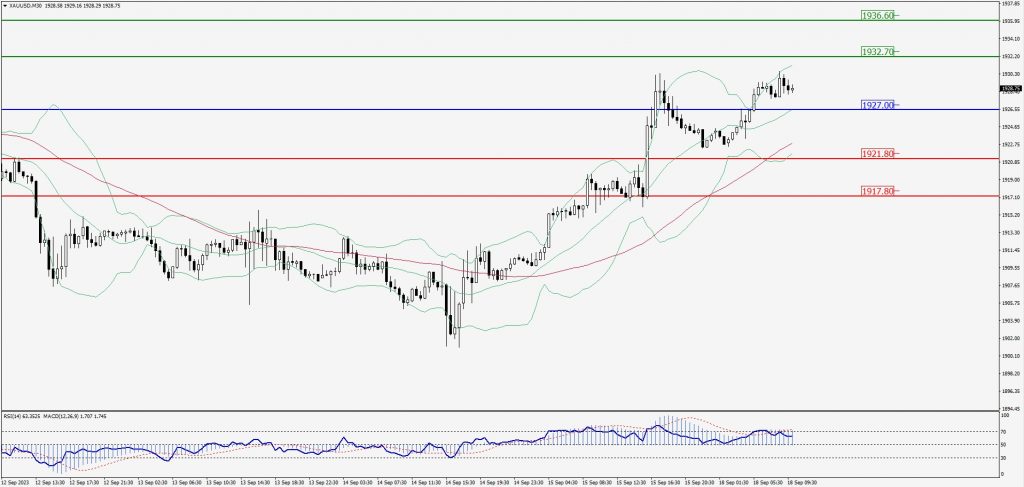
XAU/USD Intraday: Trend on the upside
Our pivot point is 1927.00
Preferable Price Action: Further upside to 1932.70 and 1936.60.
Alternative Price Action: If the price gives a downside breakout of a pivot, then the price extends to 1921.80 and 1917.80.
Comment: MACD is above 50 level and Pairs above its 20MA & 55MA.
Green Lines Indicate Resistance Levels – Red Lines Indicate Support Levels
Light Blue is a Pivot Point – Black represents the price when the report was produced
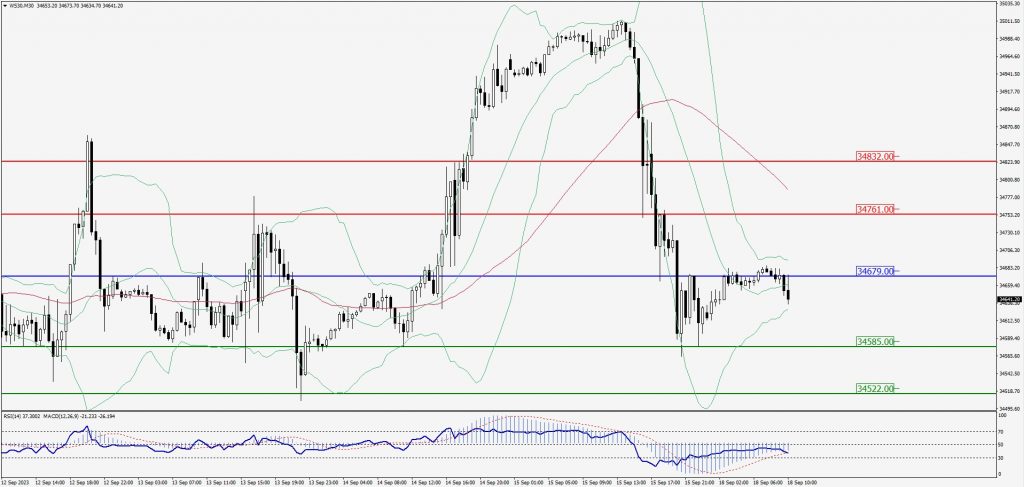
Dow Jones Intraday: Resistance level at 34,679.00
Our pivot point is 34,679.00
Preferable Price Action: Take sell positions below the pivot with targets at 34,585.00 & 34,522.00.
Alternative Price Action: Above 34,679.00 looks for further upside to 34,761.00 & 34,832.00.
Comment: RSI is below 50 levels and Pairs below 55MA.
Green Lines Indicate Resistance Levels – Red Lines Indicate Support Levels
Light Blue is a Pivot Point – Black represents the price when the report was produced