Market Wrap: Stocks, Bonds, Commodities
Stock futures were calm on Tuesday evening as Wall Street geared up for the latest interest rate decision and economic update from the Federal Reserve.
The Dow Jones Industrial Average lose 106.57 points to 34,517.73, the S&P 500 fell 0.22% to 4,443.93 and the Nasdaq Composite subtract 32.05 points to 13,678.19.
MSCI’s index of Asia-Pacific stocks outside Japan is decline 0.58% to 614.40 levels. The Australian index was lower by 0.46% to 7,163.30. Japanese Nikkei Index drop 0.73% today.
European stocks were positive on Wednesday, with the Stoxx Europe 50 Index rose 0.50% to 4,263.75, Germany’s DAX ascend 0.57% to 15,754.55, and France’s CAC ascend 0.29% to 7,303.11 and U.K.’s FTSE 100 subtract 0.63% to 7,708.27.
Benchmark 10-year U.S. Treasury fell as demand for safe assets ascend again, today 10-year bond yields negative 0.44% to 4.3480.
Oil prices jumped more than $1 on Tuesday, signaling a fourth consecutive session of gains as weak U.S. shale output compounded supply concerns from extended production cuts by Saudi Arabia and Russia.
Spot Brent crude oil drop 1.24% to $93.17 per barrel. US West Texas Intermediate crude is down 1.29% to $89.31 a barrel.
The yellow metal gold is decline 0.15% to 1,950.75 dollars per ounce.
Market Wrap: Forex
The U.S. dollar traded in a steady fashion in Europe Wednesday ahead of the conclusion of the latest Federal Reserve policy meeting, while sterling weakened after a surprise drop in the headline U.K. inflation rate.
Today, the U.S. dollar index measures the Greenback against a trade-weighted basket of six major currencies, which slipped 0.08% to 104.740.
The Euro US Dollar (EUR/USD) is a widely traded pair that is up 0.17% today. This left the pair trading around $1.06950.
The Japanese yen was negative against the U.S. dollar on Wednesday. Today USD/JPY is surged 0.11% to the 148.030 level.
Another commodity-related currency positive against the U.S dollar, AUD/USD rose 0.22% to 0.64680, and NZD/USD surged 0.19% to 0.59450 level.
EUR/USD Intraday: Support level at 1.06840
Our pivot point is at 1.06840
Preferable Price Action: Take buy positions above pivot level with targets at 1.07100 & 1.07280 in extension.
Alternative Price Action: Below pivot looks for a further downside to 1.06610 & 1.06460.
Comment: RSI is above 50 levels and Pairs above its 20MA & 55MA.
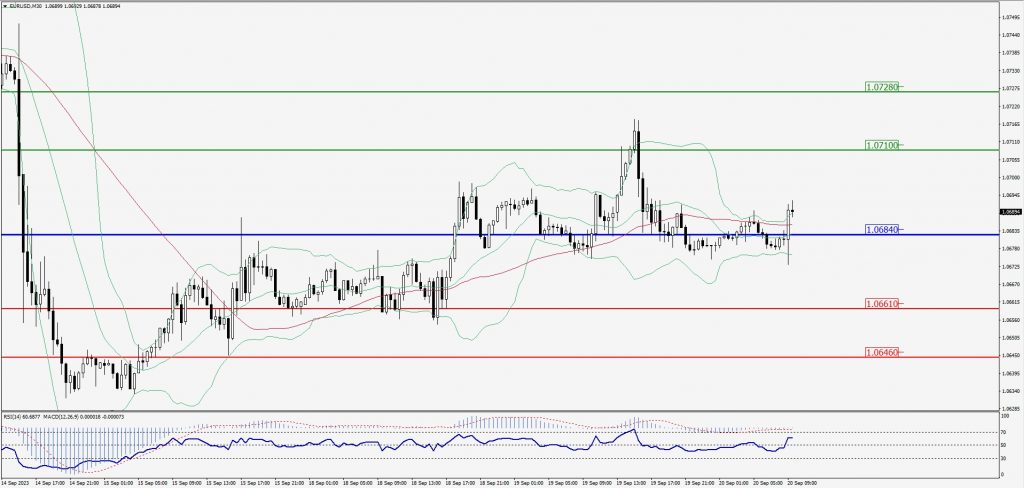
Green Lines Indicate Resistance Levels – Red Lines Indicate Support Levels
Light Blue is a Pivot Point – Black represents the price when the report was produced
GBP/USD Intraday: Major trend on the downside
Our pivot point is at 1.23740
Preferable Price Action: Sell positions below pivot with targets at 1.23330 & 1.23080 in extension.
Alternative Price Action: The price above pivot would call for further upside to 1.24120 & 1.24430.
Comment: RSI is below 50 levels and Pairs below its 20MA & 55MA.
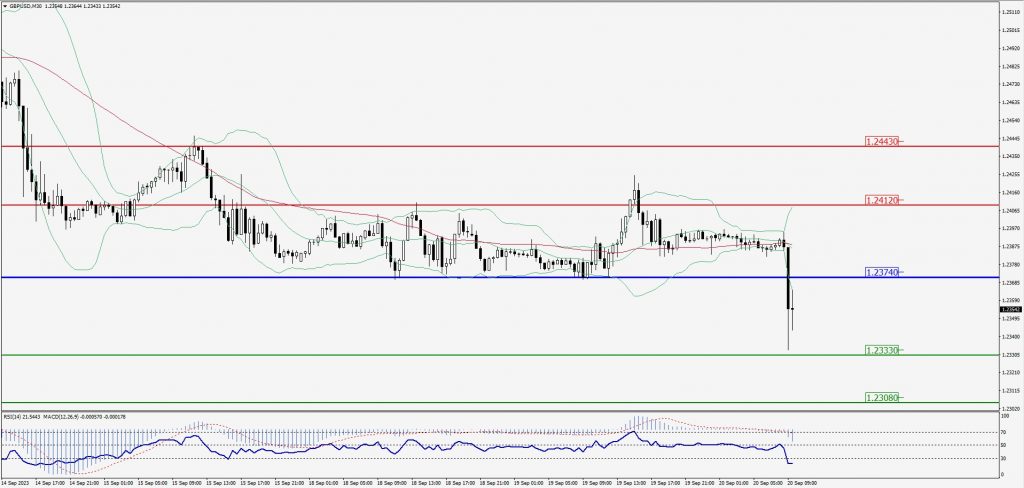
Green Lines Indicate Resistance Levels – Red Lines Indicate Support Levels
Light Blue is a Pivot Point – Black represents the price when the report was produced
USD/JPY Intraday: Trend on the upside
Our pivot point is at 147.890
Preferable Price Action: Buy position above pivot with the target at 148.120 and 148.280 in extension.
Alternative Price Action: The downside breakout of the pivot would call for 147.680 and 147.530.
Comment: MACD is above 50 level and Pairs above its 20MA & 55MA.
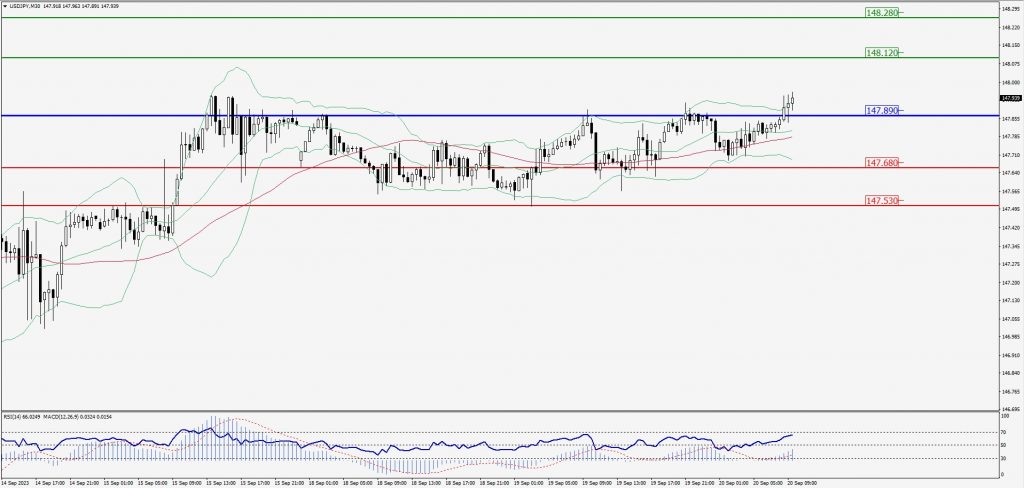
Green Lines Indicate Resistance Levels – Red Lines Indicate Support Levels
Light Blue is a Pivot Point – Black represents the price when the report was produced
AUD/USD Intraday: In a consolidation zone
Our pivot point is at 0.64520
Preferable Price Action: Buy positions above pivot with targets at 0.64700 & 0.64830 in extension.
Alternative Price Action: Below pivot looks for a further downside with 0.64350 & 0.64230 as targets.
Comment: RSI is at 50 levels and Pairs above 55MA.
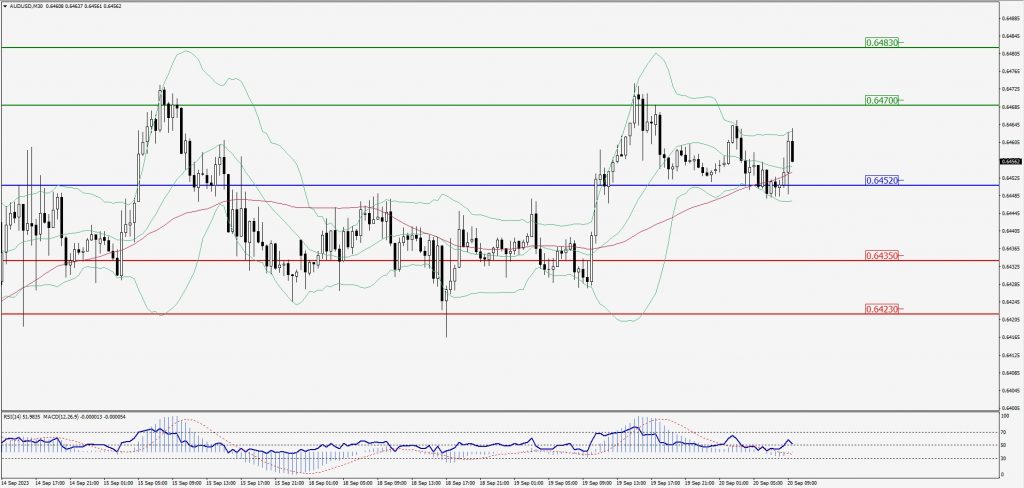
Green Lines Indicate Resistance Levels – Red Lines Indicate Support Levels
Light Blue is a Pivot Point – Black represents the price when the report was produced
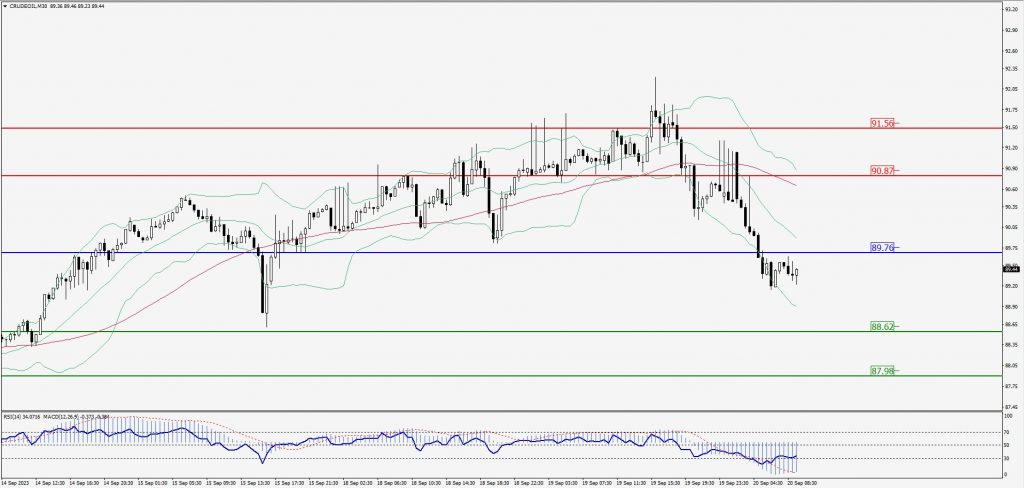
CRUDEOIL Intraday: Major trend on the downside
Our pivot point is at 89.76
Preferable Price Action: Below pivot sell oil with 88.62 & 87.98 as targets.
Alternative Price Action: Buy crude above pivot with targets at 90.87 and 91.56 in extension.
Comment: MACD is negative territory and Pairs below its 20MA & 55MA.
Green Lines Indicate Resistance Levels – Red Lines Indicate Support Levels
Light Blue is a Pivot Point – Black represents the price when the report was produced
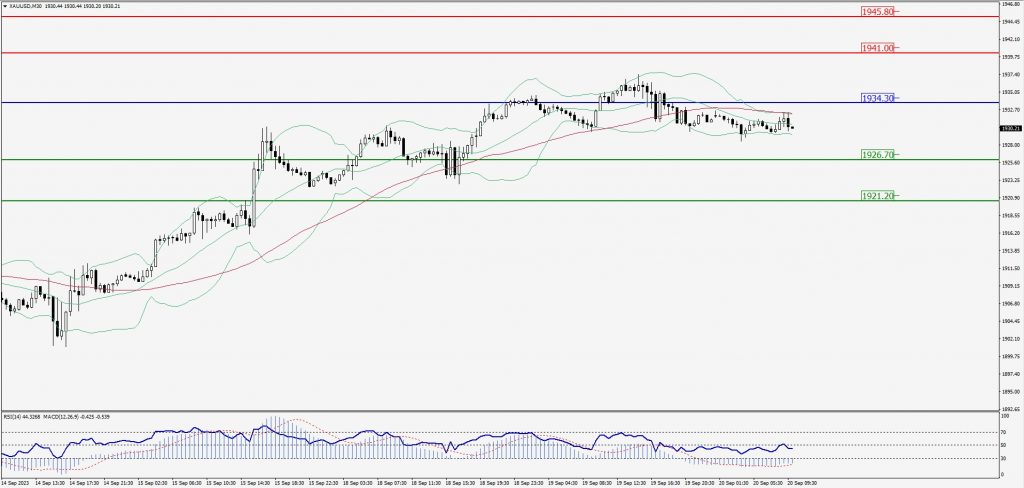
XAU/USD Intraday: Trend on the downside
Our pivot point is 1934.30
Preferable Price Action: Further downside to 1926.70 and 1921.20.
Alternative Price Action: If the price gives an upside breakout of a pivot, then the price extends to 1941.00 and 1945.80.
Comment: MACD is below 50 level and Pairs below 55MA.
Green Lines Indicate Resistance Levels – Red Lines Indicate Support Levels
Light Blue is a Pivot Point – Black represents the price when the report was produced
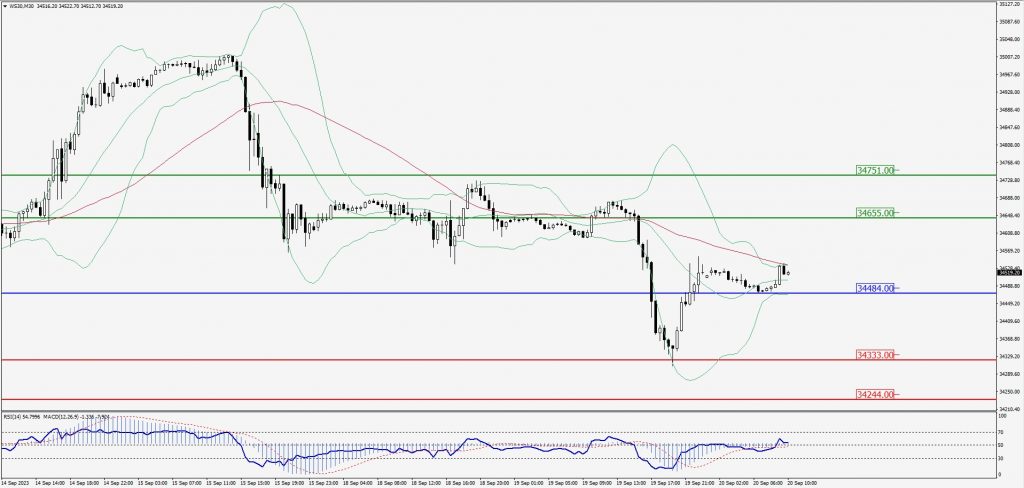
Dow Jones Intraday: Trend on the upside
Our pivot point is 34,848.00
Preferable Price Action: Take buy positions above the pivot with targets at 34,655.00 & 34,751.00.
Alternative Price Action: Below 34,484.00 looks for further downside to 34,333.00 & 34,244.00.
Comment: RSI is above 50 levels and Pairs above 20MA.
Green Lines Indicate Resistance Levels – Red Lines Indicate Support Levels
Light Blue is a Pivot Point – Black represents the price when the report was produced