Market Wrap: Stocks, Bonds, Commodities
Stock futures gained slightly on Sunday evening as Wall Street looked to shake off a rough start to August.
The Dow Jones Industrial Average rose 105.25 points to 35,281.40, the S&P 500 lose 0.11% to 4,464.05 and the Nasdaq Composite subtract 76.18 points to 13,644.85.
MSCI’s index of Asia-Pacific stocks outside Japan is decline 1.14% to 626.83 levels. The Australian index was lower by 0.86% to 7,277.00. Japanese Nikkei Index drop 1.21% today.
European stocks were mixed on Monday, with the Stoxx Europe 50 Index rose 0.36% to 4,336.85, Germany’s DAX ascend 0.57% to 15,921.15, and France’s CAC advance 0.28% to 7,361.02 and U.K.’s FTSE 100 subtract 0.13% to 7,514.34.
Benchmark 10-year U.S. Treasury fell as demand for safe assets ascend again, today 10-year bond yields negative 0.17% to 4.1600.
Oil prices edged higher on Friday after the International Energy Agency forecast record global demand and tightening supplies, propelling prices to the seventh straight week of gains, the longest such streak since 2022.
Spot Brent crude oil drop 0.45% to $86.42 per barrel. US West Texas Intermediate crude is down 0.40% to $82.86 a barrel.
The yellow metal gold is advance 0.01% to 1,946.65 dollars per ounce.
Market Wrap: Forex
The yen slipped on Monday to its lowest level against the dollar since November, breaching the key 145 mark before regaining ground as traders looked for clues of possible intervention.
Today, the U.S. dollar index measures the Greenback against a trade-weighted basket of six major currencies, which slipped 0.03% to 102.650.
The Euro US Dollar (EUR/USD) is a widely traded pair that is up 0.12% today. This left the pair trading around $1.09570.
The Japanese yen was negative against the U.S. dollar on Monday. Today USD/JPY is slipped 0.04% to the 144.890 level.
Another commodity-related currency mixed against the U.S dollar, AUD/USD fell 0.11% to 0.64910, and NZD/USD surged 0.07% to 0.59860 level.
EUR/USD Intraday: Trend on the downside
Our pivot point is at 1.09530
Preferable Price Action: Take sell positions below pivot level with targets at 1.09050 & 1.08740 in extension.
Alternative Price Action: Above pivot looks for a further upside to 1.09980 & 1.10310.
Comment: RSI is below 50 levels and Pairs below 55MA.
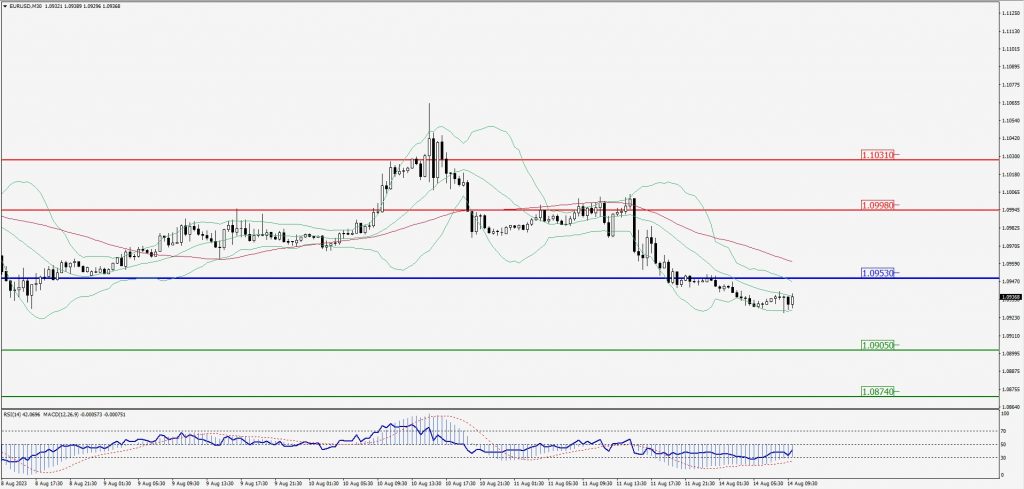
Green Lines Indicate Resistance Levels – Red Lines Indicate Support Levels
Light Blue is a Pivot Point – Black represents the price when the report was produced
GBP/USD Intraday: In a consolidation zone
Our pivot point is at 1.27040
Preferable Price Action: Sell positions below pivot with targets at 1.26540 & 1.26250 in extension.
Alternative Price Action: The price above pivot would call for further upside to 1.27430 & 1.27720.
Comment: RSI is at 50 levels and Pairs below 55MA.
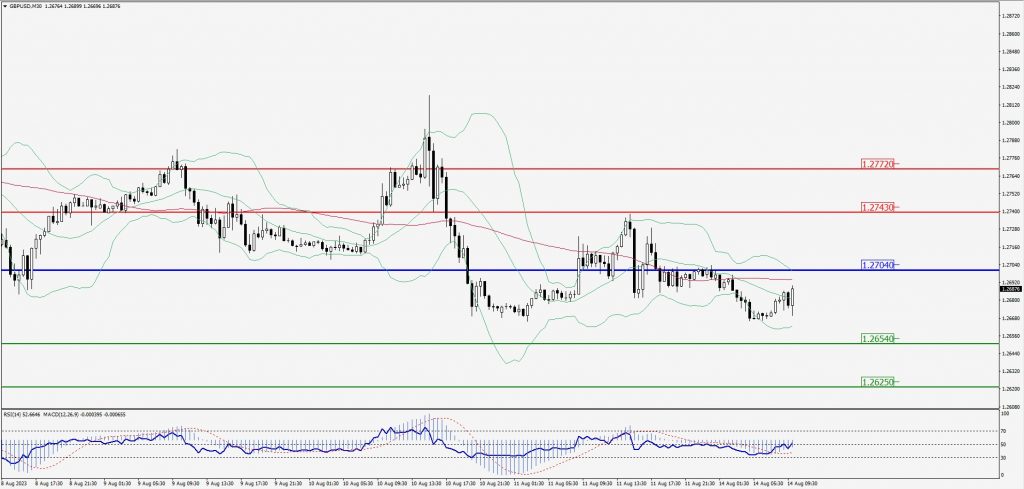
Green Lines Indicate Resistance Levels – Red Lines Indicate Support Levels
Light Blue is a Pivot Point – Black represents the price when the report was produced
USD/JPY Intraday: Resistance level at 145.040
Our pivot point is at 145.040
Preferable Price Action: Sell position below pivot with the target at 144.540 and 144.210 in extension.
Alternative Price Action: The upside breakout of the pivot would call for 145.510 and 145.850.
Comment: MACD is below 50 level and Pairs below 20MA.
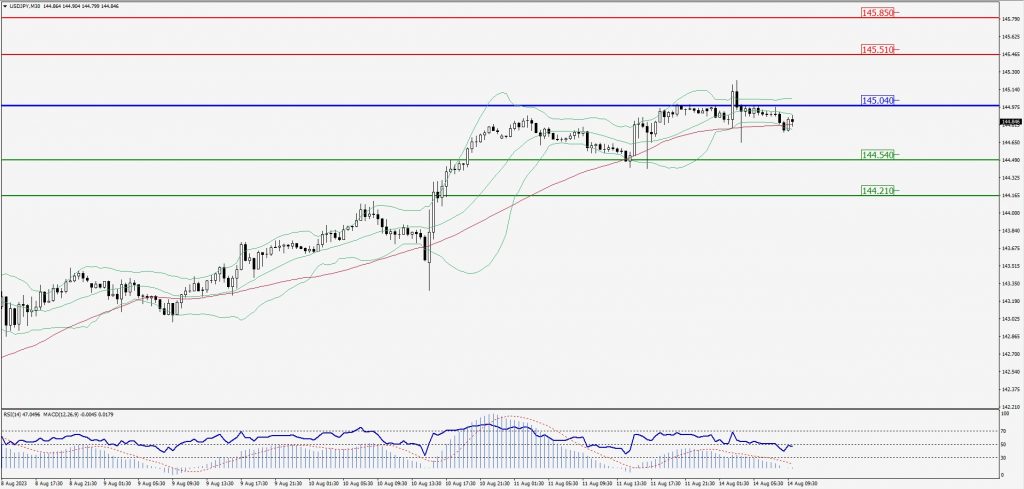
Green Lines Indicate Resistance Levels – Red Lines Indicate Support Levels
Light Blue is a Pivot Point – Black represents the price when the report was produced
AUD/USD Intraday: Trend on the downside
Our pivot point is at 0.64940
Preferable Price Action: Sell positions below pivot with targets at 0.64630 & 0.64440 in extension.
Alternative Price Action: Above pivot looks for a further upside with 0.65200 & 0.65400 as targets.
Comment: RSI is below 50 levels and Pairs below 55MA.
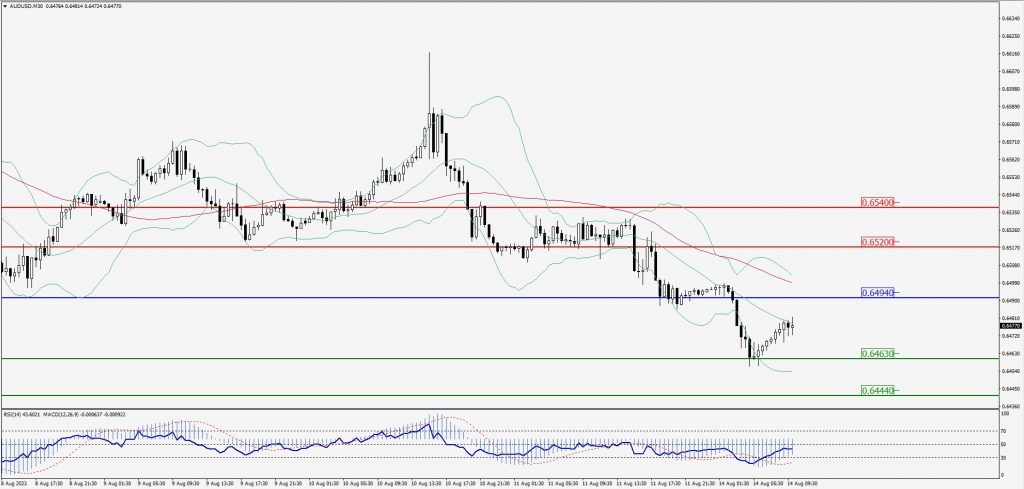
Green Lines Indicate Resistance Levels – Red Lines Indicate Support Levels
Light Blue is a Pivot Point – Black represents the price when the report was produced
CRUDEOIL Intraday: Major trend on the downside
Our pivot point is at 81.99
Preferable Price Action: Below pivot sell oil with 81.12 & 80.49 as targets.
Alternative Price Action: Buy crude above pivot with targets at 82.79 and 83.45 in extension.
Comment: MACD is negative territory and Pairs below its 20MA & 55MA.
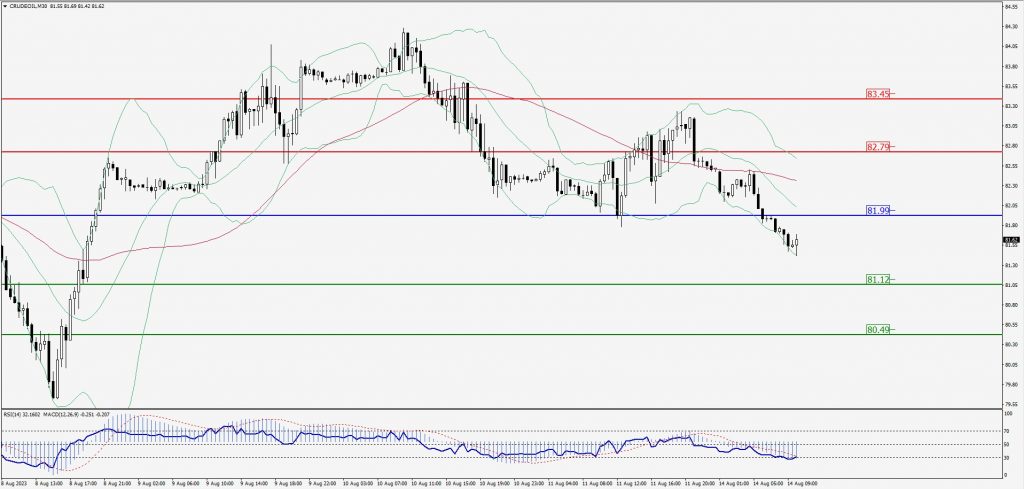
Green Lines Indicate Resistance Levels – Red Lines Indicate Support Levels
Light Blue is a Pivot Point – Black represents the price when the report was produced
XAU/USD Intraday: Trend on the downside
Our pivot point is 1914.30
Preferable Price Action: Further downside to 1906.90 and 1902.00.
Alternative Price Action: If the price gives an upside breakout of a pivot, then the price extends to 1921.00 and 1926.50.
Comment: MACD is below 50 level and Pairs below 55MA.
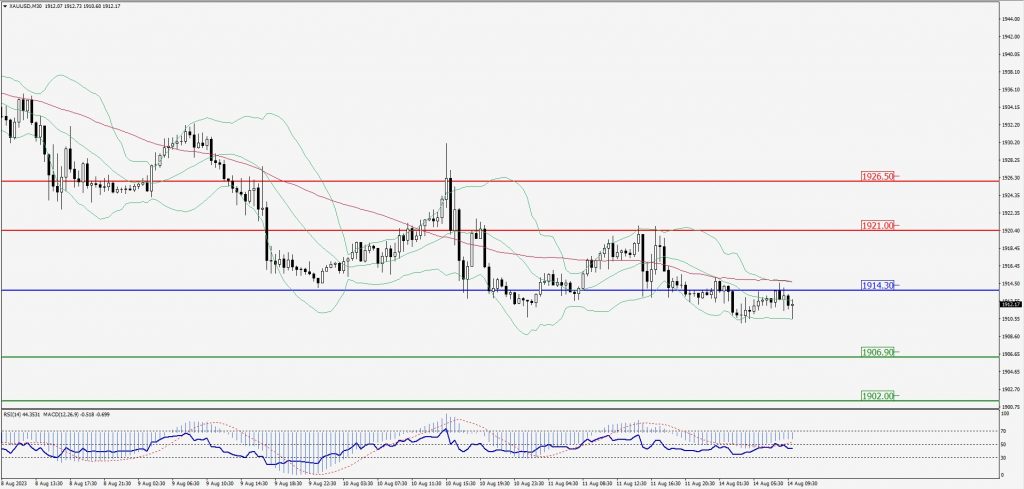
Green Lines Indicate Resistance Levels – Red Lines Indicate Support Levels
Light Blue is a Pivot Point – Black represents the price when the report was produced
Dow Jones Intraday: In a consolidation zone
Our pivot point is 35,232.00
Preferable Price Action: Take buy positions above the pivot with targets at 35,326.00 & 35,401.00.
Alternative Price Action: Below 35,232.00 looks for further downside to 35,129.00 & 35,064.00.
Comment: RSI is at 50 levels and Pairs above 55MA.
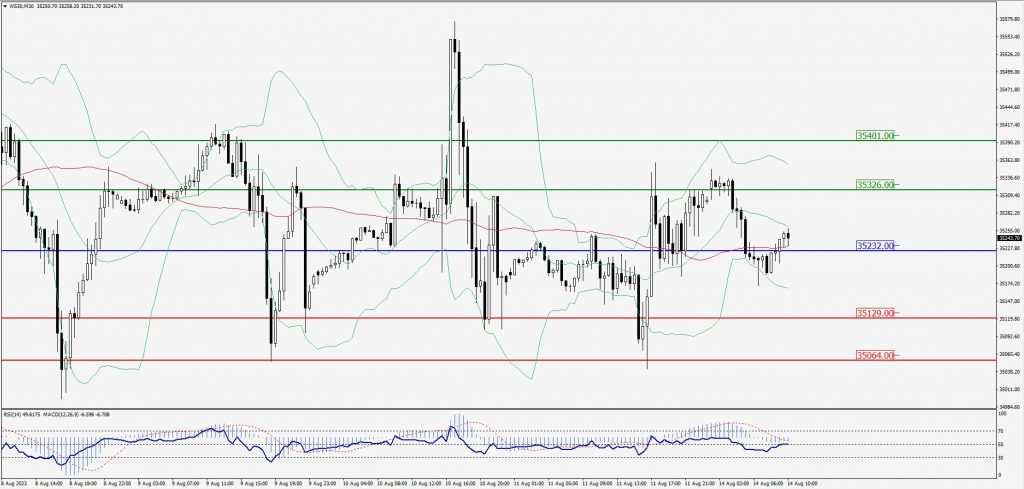
Green Lines Indicate Resistance Levels – Red Lines Indicate Support Levels
Light Blue is a Pivot Point – Black represents the price when the report was produced