Market Wrap: Stocks, Bonds, Commodities
US stock futures changed little on Tuesday night, following a selloff for the major averages. Dow Jones Industrial Average futures fell by 27 points, or 0.08 percent.
The Dow Jones Industrial Average fell 158.64 points to 35,314.49, the S&P 500 lose 0.42% to 4,499.38 and the Nasdaq Composite subtract 110.07 points to 13,884.32.
MSCI’s index of Asia-Pacific stocks outside Japan is advance 0.42% to 642.51 levels. The Australian index was higher by 0.37% to 7,338.00. Japanese Nikkei Index drop 0.40% today.
European stocks were positive on Wednesday, with the Stoxx Europe 50 Index rose 1.33% to 4,345.85, Germany’s DAX ascend 1.14% to 15,955.85, and France’s CAC advance 1.41% to 7,372.27 and U.K.’s FTSE 100 add 0.75% to 7,584.23.
Benchmark 10-year U.S. Treasury fell as demand for safe assets ascend again, today 10-year bond yields negative 0.20% to 4.0140.
Oil prices edged lower on Tuesday after data showed China’s crude imports and exports fell much more than expected in July in yet another sign of a sluggish post-COVID rebound for the world’s largest oil importer.
Spot Brent crude oil ascend 0.29% to $86.42 per barrel. US West Texas Intermediate crude is up 0.36% to $83.22 a barrel.
The yellow metal gold is advance 0.13% to 1,962.40 dollars per ounce.
Market Wrap: Forex
The dollar retreated on Wednesday after data showed the Chinese economy slipped into deflation last month, which upped the chances for the government to roll out extra stimulus measures and nudged investors into risk assets.
Today, the U.S. dollar index measures the Greenback against a trade-weighted basket of six major currencies, which slipped 0.10% to 102.233.
The Euro US Dollar (EUR/USD) is a widely traded pair that is up 0.20% today. This left the pair trading around $1.09750.
The Japanese yen was negative against the U.S. dollar on Wednesday. Today USD/JPY is slipped 0.05% to the 143.310 level.
Another commodity-related currency positive against the U.S dollar, AUD/USD rose 0.22% to 0.65590, and NZD/USD surged 0.26% to 0.60800 level.
EUR/USD Intraday: Trend on the upside
Our pivot point is at 1.09660
Preferable Price Action: Take buy positions above pivot level with targets at 1.09950 & 1.10170 in extension.
Alternative Price Action: Below pivot looks for a further downside to 1.09410 & 1.09220.
Comment: RSI is above 50 levels and Pairs above its 20MA & 55MA.
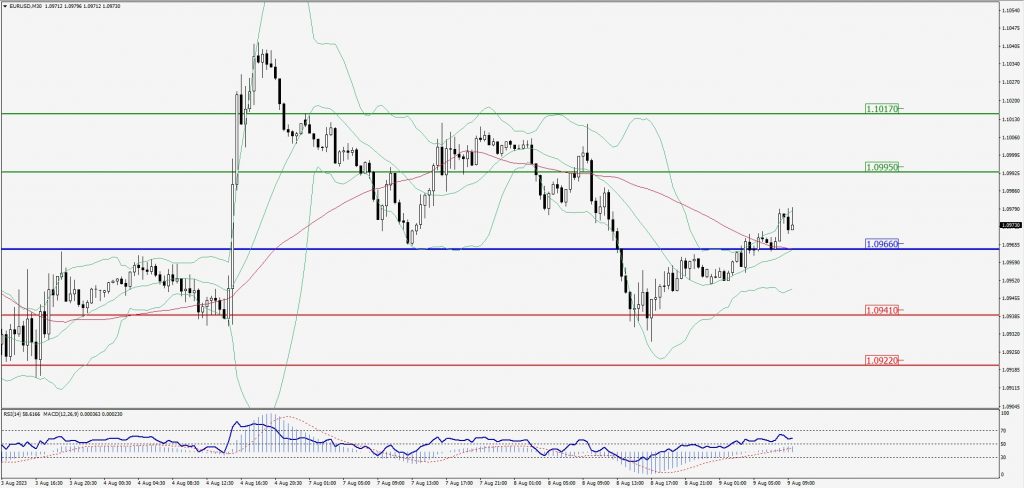
Green Lines Indicate Resistance Levels – Red Lines Indicate Support Levels
Light Blue is a Pivot Point – Black represents the price when the report was produced
GBP/USD Intraday: Major trend on the upside
Our pivot point is at 1.27620
Preferable Price Action: Buy positions above pivot with targets at 1.28050 & 1.28320 in extension.
Alternative Price Action: The price below pivot would call for further downside to 1.27270 & 1.27020.
Comment: RSI is above 50 levels and Pairs above its 20MA & 55MA.
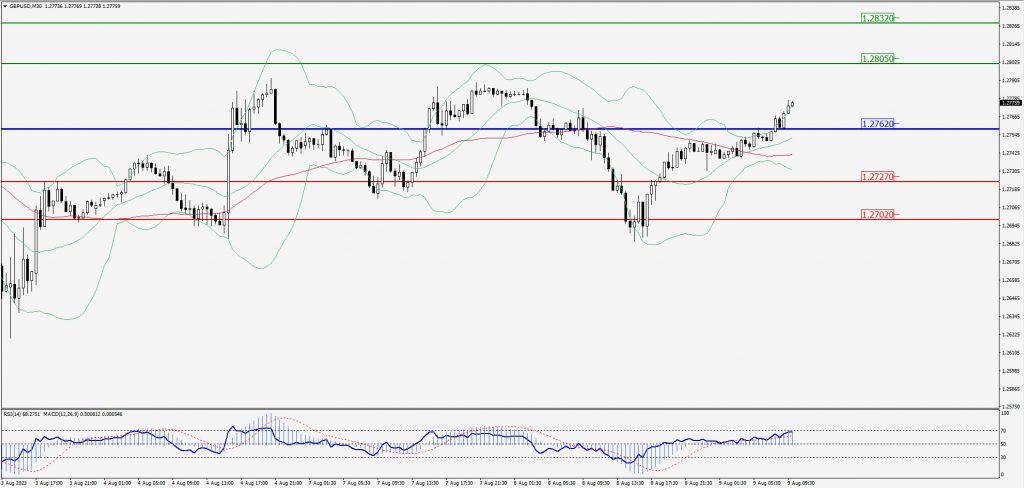
Green Lines Indicate Resistance Levels – Red Lines Indicate Support Levels
Light Blue is a Pivot Point – Black represents the price when the report was produced
USD/JPY Intraday: Trend on the downside
Our pivot point is at 143.270
Preferable Price Action: Sell position below pivot with the target at 142.810 and 142.520 in extension.
Alternative Price Action: The upside breakout of the pivot would call for 143.670 and 143.960.
Comment: MACD is below 50 level and Pairs below its 20MA & 55MA.
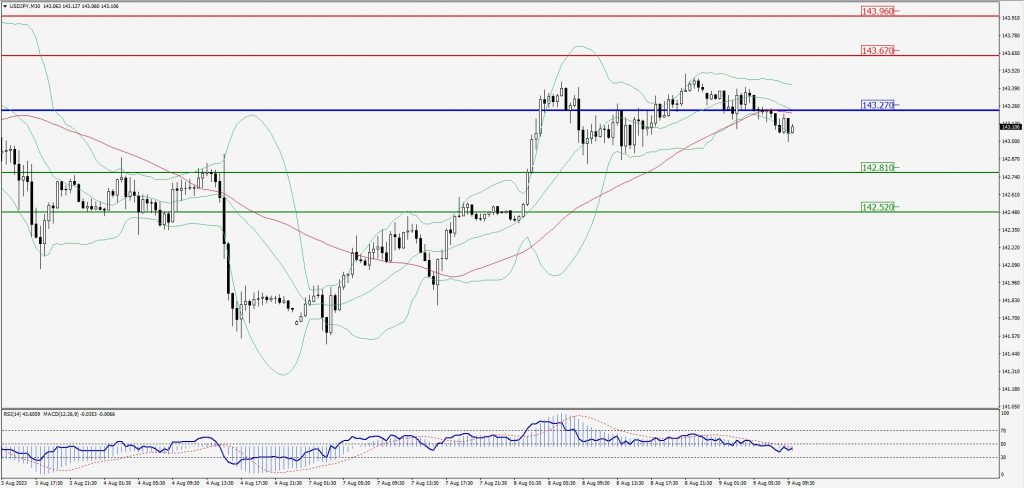
Green Lines Indicate Resistance Levels – Red Lines Indicate Support Levels
Light Blue is a Pivot Point – Black represents the price when the report was produced
AUD/USD Intraday: Trend on the upside
Our pivot point is at 0.65530
Preferable Price Action: Buy positions above pivot with targets at 0.65860 & 0.66070 in extension.
Alternative Price Action: Below pivot looks for a further downside with 0.65270 & 0.65080 as targets.
Comment: RSI is above 50 levels and Pairs above its 20MA & 55MA.
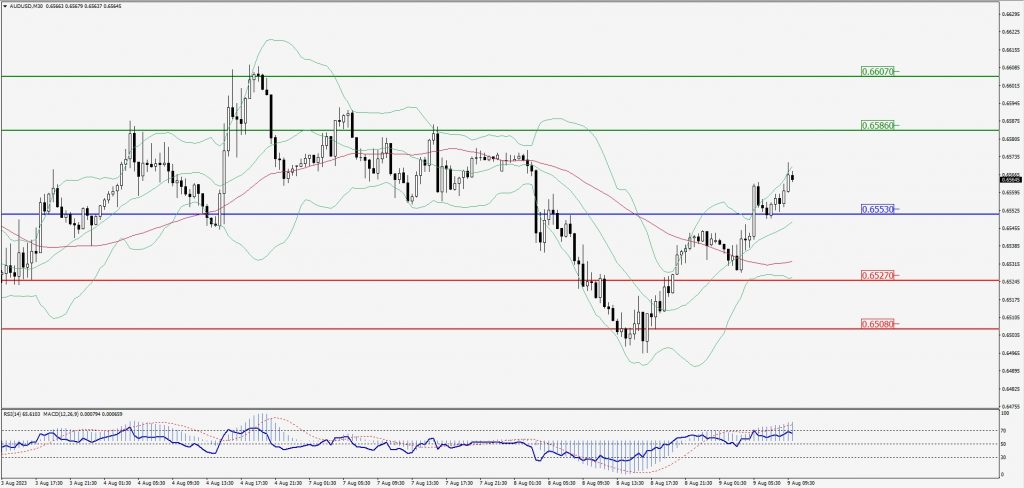
Green Lines Indicate Resistance Levels – Red Lines Indicate Support Levels
Light Blue is a Pivot Point – Black represents the price when the report was produced
CRUDEOIL Intraday: Trend on the upside
Our pivot point is at 82.14
Preferable Price Action: Above pivot buy oil with 82.89 & 83.49 as targets.
Alternative Price Action: Sell crude below pivot with targets at 81.50 and 81.01 in extension.
Comment: MACD is positive territory and Pairs above 55MA.
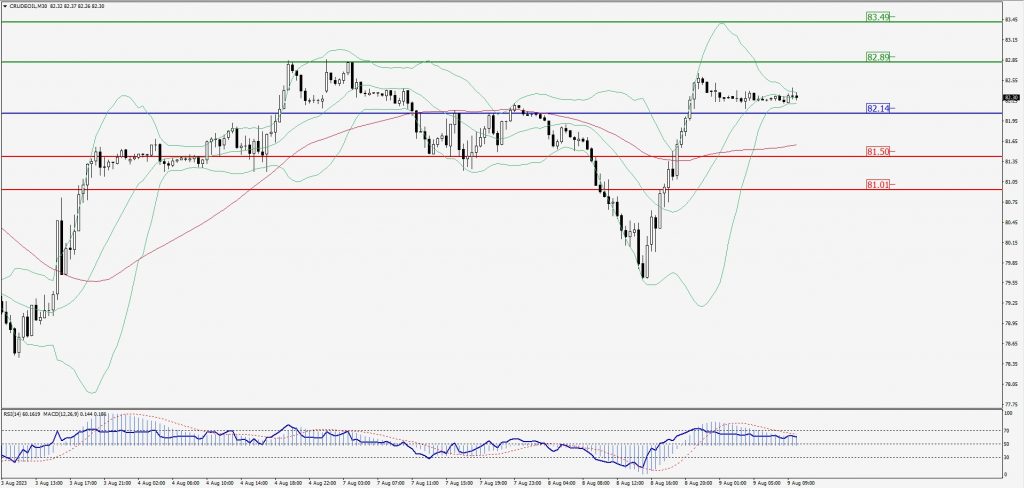
Green Lines Indicate Resistance Levels – Red Lines Indicate Support Levels
Light Blue is a Pivot Point – Black represents the price when the report was produced
XAU/USD Intraday: Trend on the upside
Our pivot point is 1928.80
Preferable Price Action: Further upside to 1935.30 and 1939.50.
Alternative Price Action: If the price gives a downside breakout of a pivot, then the price extends to 1923.60 and 1919.70.
Comment: MACD is above 50 level and Pairs above its 20MA & 55MA.
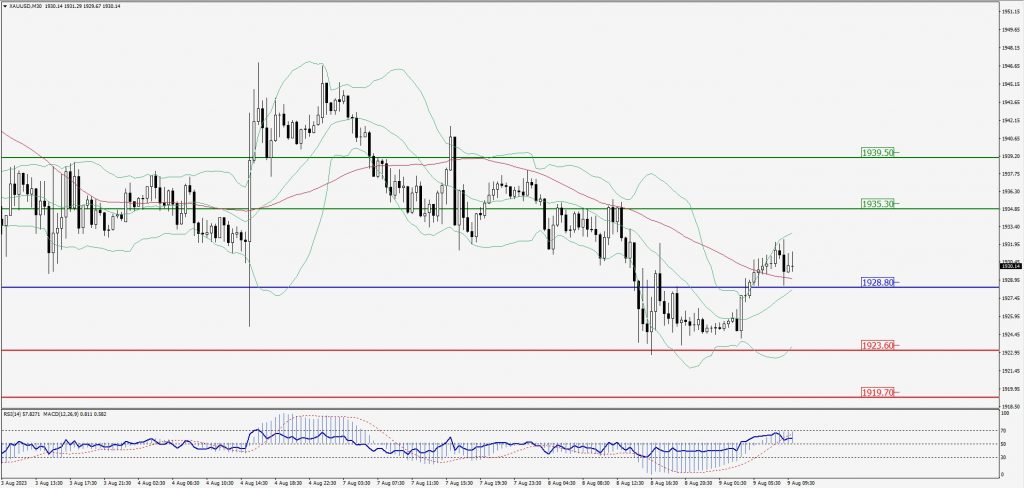
Green Lines Indicate Resistance Levels – Red Lines Indicate Support Levels
Light Blue is a Pivot Point – Black represents the price when the report was produced
Dow Jones Intraday: Support level at 35,294.00
Our pivot point is 35,294.00
Preferable Price Action: Take buy positions above the pivot with targets at 35,433.00 & 35,546.00.
Alternative Price Action: Below 35,294.00 looks for further downside to 35,170.00 & 35,068.00.
Comment: RSI is above 50 levels and Pairs above its 20MA & 55MA.
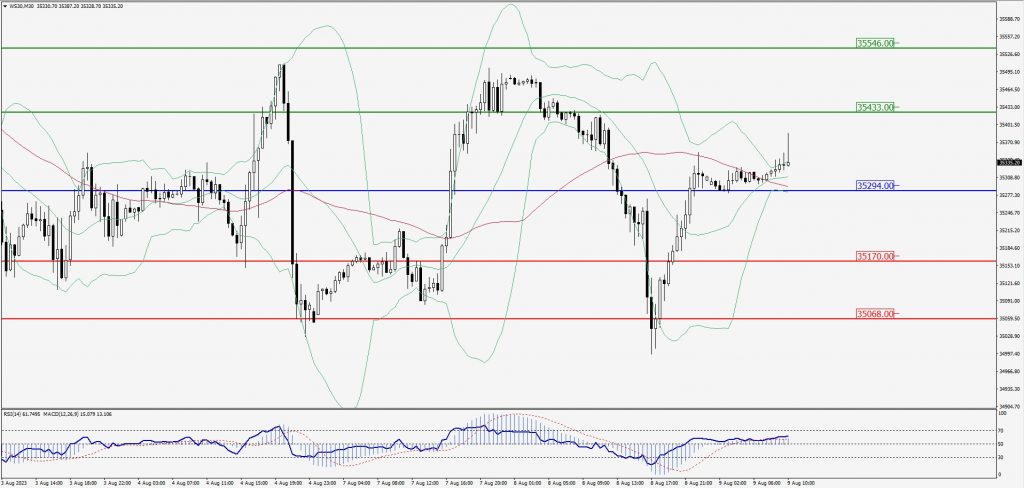
Green Lines Indicate Resistance Levels – Red Lines Indicate Support Levels
Light Blue is a Pivot Point – Black represents the price when the report was produced